Don’t be shy, ask ii…how do I achieve geographical diversification?
21st October 2021 09:19
by Nina Kelly from interactive investor
No question is a stupid one, so whether you want to find out what you need to do to start investing or how the stock market works, don’t be shy, ask ii. Email your questions to: ask@ii.co.uk

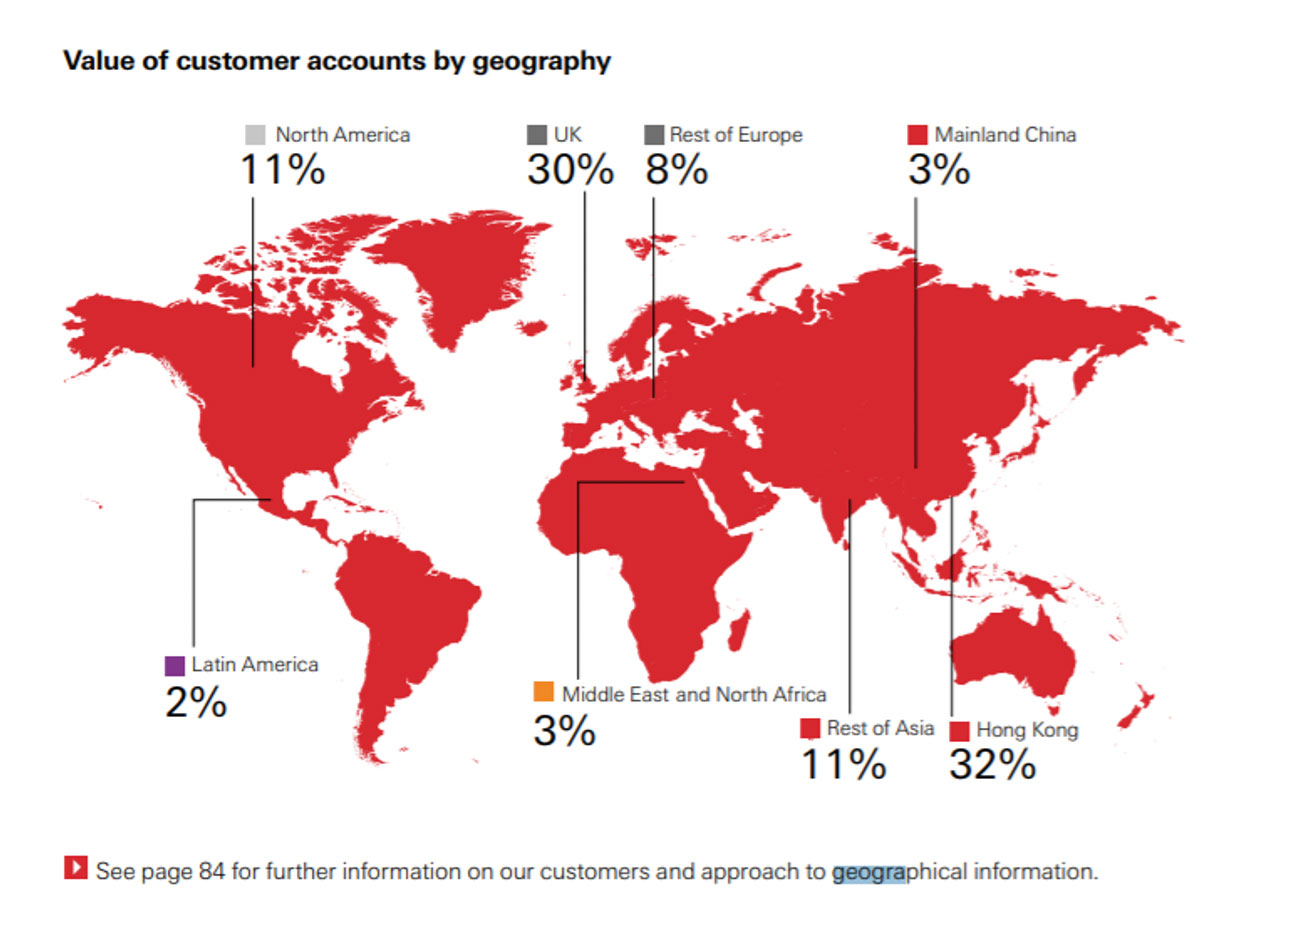
Ifor asks: From time to time we read how your investments should be allocated across markets, and I understand that. But how do you determine where your individual shares, ETFs, unit trusts, and investment trusts are invested? For example, with HSBC – should it be the UK, or China, or where?
If you can get the market split right, how do you determine how much percentage in each market and when to change?
Nina Kelly (pictured), editorial content manager at interactive investor, says: Asset allocation refers to the composition of your portfolio by asset type (shares, funds, trusts, alternatives – infrastructure and gold, for example – and bonds) and this is determined by your objectives, attitude to risk and investment time horizon.
As you rightly point out, it is important to achieve diversification across geographical areas and not bet the farm on one market. Investors focused on just one or two markets are vulnerable to geopolitical crises or other region-specific problems. Performance fluctuates too, and rarely does one region outperform the rest for long before becoming overvalued.
Once you’ve decided to diversify overseas, you may need to discover the geographical split of an investment fund or a trust. Most asset managers publish monthly factsheets on their websites, so you are able to see where the portfolio holdings are invested. Fund houses often share information on sectors as well, so you can determine a fund or trust’s exposure to, say, technology or healthcare.
- Discover more Don't be shy, ask ii questions here
- Open an ISA with interactive investor. Click here to find out how.
interactive investor recently published an infographic showing the geographical split of the Fundsmith Sustainable Equity fund. This is the kind of data that you will find on the fund manager’s website.
Exchange-traded funds (ETFs) can track stock market indices such as the S&P 500 or FTSE 100, but thematic ETFs target stocks in particular industries such as robotics or global clean energy. Here, it is important to understand your exposure from a geographic perspective to avoid undesired bias towards a particular country. The holdings of thematic ETFs, for example, can be found on the provider’s website.
With equities, there are several ways to find out where an individual company is deriving its revenue from, but you will need to do some digging. Data sites such as SharePad have geographical splits for individual companies/shares, but you can find annual results documents, half-year results and other useful information within the Investor section of company websites. They can be lengthy documents, so try a Ctrl-F search for terms such as ‘geographic’ to help speed up the process.
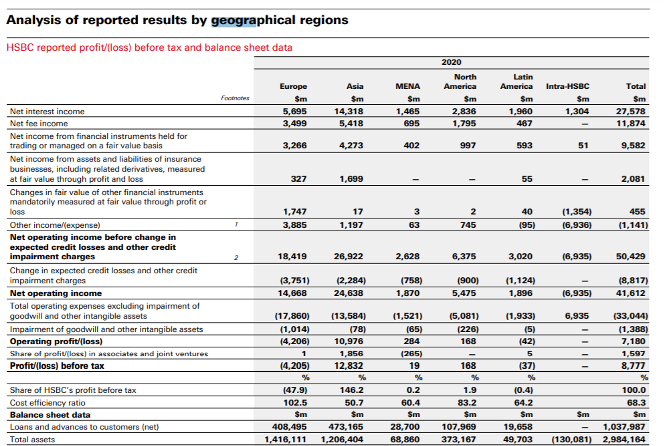
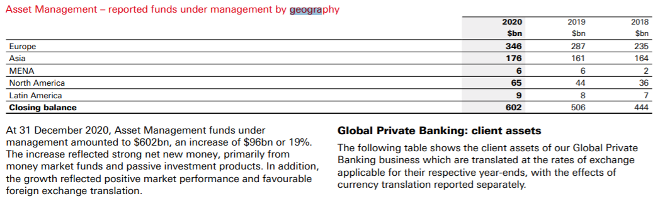
To address your question about HSBC (LSE:HSBA), I’ve found some clips from the last set of annual results that demonstrate the type of information that’s available on geographic splits.
If you are an ii customer, you can use our X-ray tool that tells you just how diversified, or not, your portfolio is by region and segment. This tool can help you avoid ‘diworsification’, when you have too many investments covering the same markets/sectors, or indeed home bias, where you overfocus on your domestic market.
In terms of your percentage weighting to different markets, consider your objectives, attitude to risk and investment horizon. Some geographies and sectors are more volatile than others (emerging markets, and biotechnology, for example), so might not be suitable for shorter-term investments or for people nearing retirement.
As a guide, I’ve listed below the geographical splits of two global equity funds that appear in ii’s Super 60 list of rated funds.
F&C Investment Trust (LSE:FCIT)’s equities at the end of August were split like this:
North America 56.7%
Europe (ex-UK 14.7%
Emerging markets 9.2%
UK 8.9%
Japan 7.2%
Pacific ex-Japan 2.4%
Cash 0.8%
As of 15 October 2021, the iShares Core MSCI World ETF (LSE:SWDA) was invested like this:
US 67.64%
Japan 6.59%
UK 4.19%
Canada 3.35%
France 3.22%
Switzerland 2.77%
Germany 2.59%
Australia 2.00%
Netherlands 1.42%
Sweden 1.08%
Cash 0.55%
Other 4.59%
Remember, these splits are not necessarily right for everyone, and are only an indication of what a geographically diverse global fund can look like. Each fund will have its own way of deciding how its investments will be split across regions.
- Don't be shy, ask ii...how do I tidy up my investment portfolio?
- Examine the pension savings habits of investors at different life stages
Not comfortable designing your own diversified portfolio? You could consider multi-asset funds, where a manager does the asset allocation decision-making for you. There are two approaches: active (attracts a higher fee, and the manager undertakes the stock-picking) or passive (low-cost tracker funds). Examples of multi-asset funds include Vanguard’s LifeStrategy range, but there are many to choose from.
Alternatively, interactive investor also has five ready-made growth and income model portfolios, including an ethical one. These diversified models are designed to make selections easier. You can examine them, including the methodology and underlying holdings, here.
These articles are provided for information purposes only. Occasionally, an opinion about whether to buy or sell a specific investment may be provided by third parties. The content is not intended to be a personal recommendation to buy or sell any financial instrument or product, or to adopt any investment strategy as it is not provided based on an assessment of your investing knowledge and experience, your financial situation or your investment objectives. The value of your investments, and the income derived from them, may go down as well as up. You may not get back all the money that you invest. The investments referred to in this article may not be suitable for all investors, and if in doubt, an investor should seek advice from a qualified investment adviser.
Full performance can be found on the company or index summary page on the interactive investor website. Simply click on the company's or index name highlighted in the article.