Eight trusts with potential for strong returns
There remain a number of idiosyncratic situations offering great opportunities for long-term investors.
15th February 2019 15:31
by Thomas McMahon from interactive investor
There remain a number of idiosyncratic situations offering great opportunities for long-term investors.

This content is provided by Kepler Trust Intelligence, an investment trust focused website for private and professional investors. Kepler Trust Intelligence is a third-party supplier and not part of interactive investor. It is provided for information only and does not constitute a personal recommendation.
Material produced by Kepler Trust Intelligence should be considered a marketing communication, and is not independent research.
Sweet treats
One of the attractions of investment trusts is the potential to pick up discounted bargains, which can supercharge net asset value (NAV) returns if correctly anticipated. As we have remarked before, closed-ended funds have historically delivered superior NAV returns. But buying shares on a substantial discount can significantly enhance those NAV returns should the discount narrow on a sustained basis.
The reasons for investment companies long run NAV outperformance of equivalent open-ended funds, lies with their structural advantages, as we discussed in detail last year. Firstly, they have the ability to make the best use of less liquid assets and managers can manage those assets without having to worry about inflows and outflows. Secondly, they can employ gearing, which should be accretive to returns over the long run even if timing isn't attempted, assuming equity markets continue to rise over the course of each cycle.
While we tend to focus on the trusts with long-term potential, here we are considering those trusts currently sitting on discounts that have caught our eye. These trusts are trading on unusually wide discounts (at least 10% in absolute terms), but most importantly, have the potential to produce attractive NAV returns (in relative or absolute terms) as well.
Why buy on a discount?
The combination of investing in high return assets, gearing up and buying on a deep discount is the holy grail of closed-ended fund investing. Buying a trust on a substantial discount can add significantly to long-term returns if that discount closes. On a very basic level, assuming one can buy a trust on a discount of 10% and this closes over ten years, the investor would have earned an extra 20.4%, or 1.26% a year on average, assuming the discount closed at a constant rate. If we assume the trust's NAV rises by 7% a year (the long-term average on the S&P 500) an investment of £10,000 would become £18,385 from par to par, but £10,000 invested on a 10% discount would become £20,427.
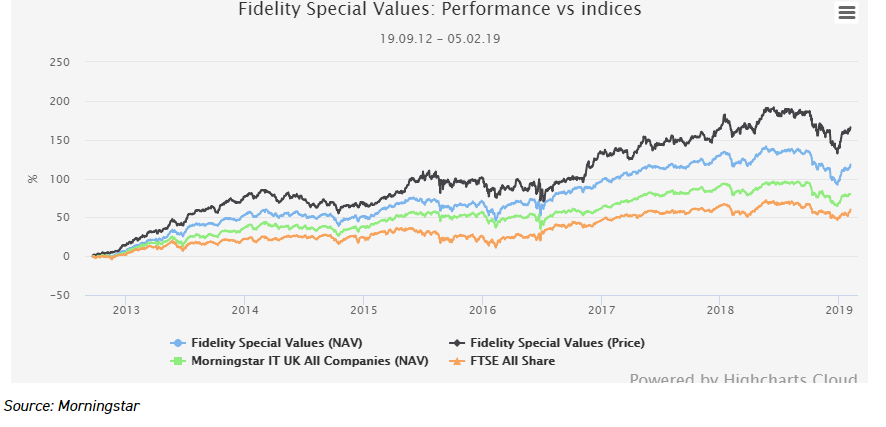
A good example of a wide discount coming good for investors is the history of Fidelity Special Values (LSE:FSV). This trust traded on a discount in excess of 10% for much of 2011 and 2012. Following the appointment of Alex Wright in September 2012, the gap started to close, and the trust has traded on a small premium for much of the past year – particularly remarkable when you consider that UK equities, especially the small and mid cap areas this trust concentrates on, are deeply out of favour at the moment.
The discount peaked at 16.7% on 20th September 2012. Since then NAV is up 118%, on its own impressive outperformance of the FTSE All Share (60%) and the average Morningstar IT UK All Companies trust (80%). However, shareholders have enjoyed returns of 166% thanks to the closing of the discount. This approximates to an extra 4.2% per annum, which compounded makes a huge difference.
PERFORMANCE
For income seekers, buying shares on a discount can also imply a big difference in how much they receive as a payout over the lifetime of the investment. Using the same assumptions – a trust bought on a 10% discount, total returns of 7% a year – the trust bought on a discount would return 51% of the initial investment if the portfolio yield remained at 4% over 10 years. This compares to just 46% for the trust bought at par, for an extra 5% of the initial investment returned as income. For an investor buying at a 15% discount, the investment would return 65% of the initial money, for an extra 8% income, and on a 20% discount there would be 11.5% extra income return on the initial investment over ten years. Taking the example of our initial £10,000 investment, this is an extra £800 on a 10% discount and £1,150 on a 20% discount.
To return to the example of Fidelity Special Values, we can see how buying on a discount can help an investment which isn't explicitly aimed at generating an income to provide a decent payout. Alex Wright took over on 20 September 2012, when the NAV was 130p and the price 108p. The first dividend received was 3.25p on August 2013, a yield of just 2.5% on the NAV but 3% on the purchase price thanks to the discount. The trust has generated dividend growth of 9% a year since then, and has returned 21.5% of the initial investment in dividends. On NAV the return would have been just 17.9%. On an investment of £10,000 the difference is £360 (£2,150 less £1,790).
Another way of looking at discounts is as an extra potential safety net on the original investment. An investor buying a trust at 80p will receive 100p of assets and 46p in income over ten years. Assuming he or she picks a trust which is able to grow its dividend in line with the market, which may include utilising revenue reserves in poor years for the market, this means that the NAV would have to fall to 34p for the initial investment to be under water (assuming the investor could exit at NAV, which in such an extreme scenario may be achieved by the board deciding to wind up and investors receiving NAV).
Where is the opportunity market-wide?
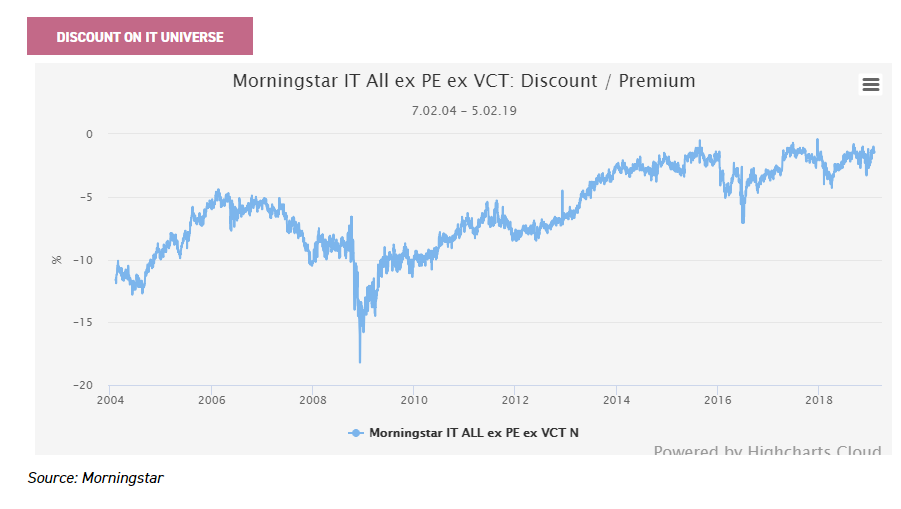
Generally speaking, this isn't the best time to be searching for discount opportunities. Typically discounts widen in recessions or periods of market turmoil, and then as economies and stock markets recover, they tighten as risk appetite returns and investors sentiment returns. The graph below shows that the average discount in the investment trust universe has narrowed significantly since the financial crisis, and in fact has come in to levels that it didn't reach in the previous cycle. The current average on the universe is 1.4% compared to a narrow point of 4.4% in the pre-crisis cycle (achieved in February 2006).
DISCOUNT ON IT UNIVERSE
However, we believe there are still a number of idiosyncratic situations which offer interesting opportunities for the long-term investor. The eight trusts discussed here have the potential to do well on an NAV basis, and could see their discounts narrow. The minimum discount we are interested in is 10%. Discounts quoted below are as of 9 Feb 2019, sourced from JPMorgan Cazenove. We have saved the widest discounts until last.
Baring Emerging Europe (LSE:BEE) – 10.6%
One to lock away for the long term could be Baring Emerging Europe (BEE). We have seen some trusts successfully close wide discounts by committing to paying capital out as a dividend, either regularly or ad hoc, to maintain or enhance a natural income. In 2017, as part of a series of measures intended to close the discount, the board of BEE was given the ability to pay out capital as income and committed to paying an uncovered dividend when it thought it prudent. The expectation was for around 1% of NAV to be paid out as income per annum to supplement the revenue return, and investors received a substantial increase in payouts.
The trust is currently yielding 4.5%. This means that an investor will receive 52% of their initial investment back in ten years on the conservative assumption that dividends are grown by 3% each year. In fact, there are good prospects for this dividend to continue to rise, as the managers are finding a greater focus on shareholder rights in the region and a greater consciousness of the importance of minority shareholders to a company's long-term prospects – although currency volatility could mean the path is not smooth.
The discount has only narrowed slightly following the change. We think this is due to the ongoing political confrontation between Russia and the West (Russia makes up 50% of the index). While it is hard to foresee a time when relations thaw, we think it likely that this happens eventually, or that these markets go through a period of being in favour, perhaps during the next bull market. At this point the fact the trust is the only closed-ended option in this space could see it gain interest. The board has committed to holding a tender offer in 2020 should the average discount over that period be over 12%, returning capital at NAV less 2.5%. This should give a lower bound to the discount as we move closer to that date.
Aberdeen Standard Asia Focus (LSE:AAS) – 11.7%
This trust was formerly known as Aberdeen Asian Smaller Companies before being renamed last year. When its quality style was last in favour it traded on a premium which reached over 8% in 2012. Along with Aberdeen's whole stable of emerging markets and Asia funds, it suffered between 2015 and 2017. During this period some major stock picks hurt the trust, as did the focus on strong corporate governance which led to a structural underweight to mainland China in a period when China outperformed much of the region. Higher growth and more momentum-focused strategies did well during this period, as well as a number of tech companies which saw rapid growth - the trust was underexposed to these areas because of limited track records or concerns about management.
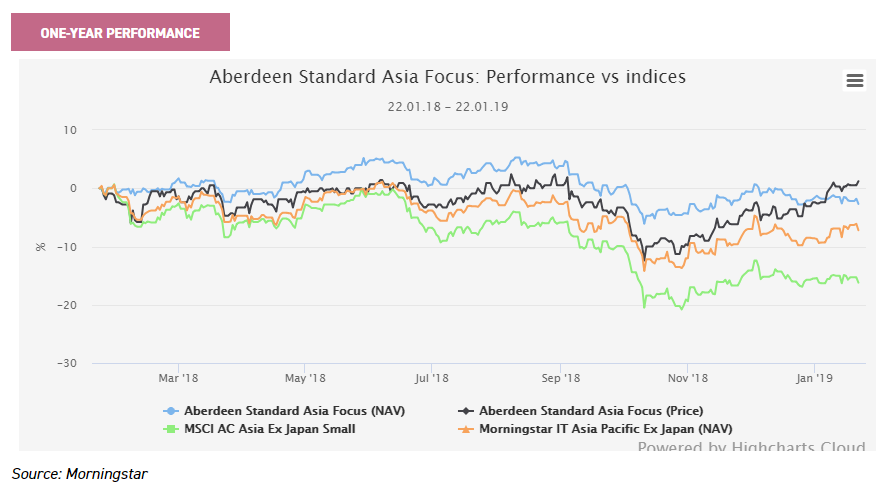
However, in 2018 the stylistic trends tilted back in the trust's favour as value and quality outperformed momentum and growth (albeit in a falling market). NAV fell just 2.8% on a total return basis as the MSCI AC Asia ex Japan Smaller Companies index fell 15.2%.
ONE-YEAR PERFORMANCE
We think the 2016 and 2017 momentum-led market was a late cycle phenomenon, and with the global risk-free rate rising, investors have had to become more sensible about valuations and more attentive to quality. This is the first reason we think the trust could rerate. We also think that the outperformance of large caps over small caps in the region of recent years will likely revert to the more normal inverse relationship as the impetus behind the tech giants' rapid growth subsides.
The trust was overhauled at the same time as being renamed, with the massively experienced Hugh Young taking more personal control and the portfolio becoming more concentrated with higher conviction. As such, the discount of 11.7% compares well relative to the average for peers of 5.9%.
Aberdeen Smaller Companies Income (LSE:ASCI) 12.7%
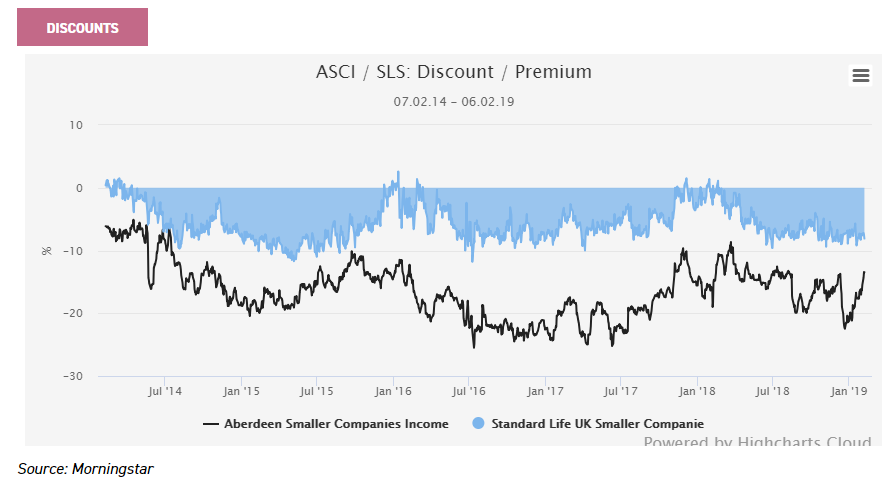
Aberdeen Smaller Companies Income (ASCI) was run by Aberdeen's smaller companies team prior to the merger with Standard Life and has since been taken over by the Standard Life team headed by Harry Nimmo. The discount was as wide as 20% in September when Abby Glennie was appointed manager and responsibility passed to the Standard Life team. It has traded as narrow as 14% since then, although in the choppy markets has moed around and is currently at 13%. This compares to just 8% for Standard Life UK Smaller Companies (SLS), which has traded on a premium on a number of occasions when its style and market have been in favour.
DISCOUNTS
Abby will be using the same approach used on SLS, with a process centred around the quantitative screening system called "the Matrix", which helps her to identify the most attractive stocks on the quality growth characteristics she and Harry favour. For ASCI, Abby is adding a yield requirement in line with the objectives of the trust. However, fundamentally, the process will be the same and the research and stock-picking will be carried out within the same framework.
The dividend yield is currently 2.8%, with dividend growth over the past five years having been 3.3%. On SLS, dividend growth has been 9%. Should the latter figure be achieved over the next ten years, investors would receive 42.5% of their initial investment in income (compared to 36.8% had the investment been bought at par).
River and Mercantile UK Micro Cap (LSE:RMMC) – 13.1%
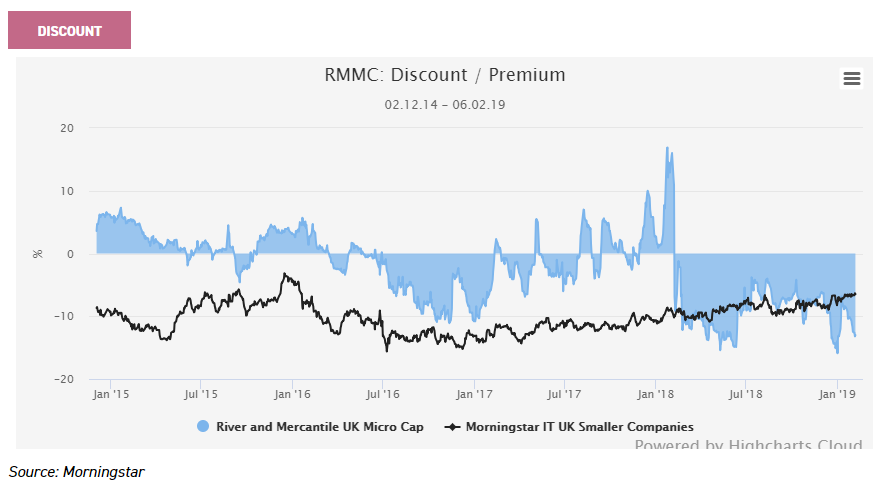
River & Mercantile Micro Cap is trading on the widest discount of the three micro cap trusts; it's 13.1% compares to just 3.1% for Miton UK Microcap (LSE:MINI) and 1.4% for Downing Strategic Micro-Cap (LSE:DSM). However, it has outperformed both peers over the past year, with NAV total return positive at 0.5% compared to negative returns for the two other trusts.
The reason for this goes back to the dismissal of Philip Rodrigs in December 2017. Following his departure, the trust moved from a premium of almost 17% to a discount wider than 10%. This looked anomalous at the time, particularly given that Geogre Ensor, who took over management, had worked on the trust as an analyst since it had been launched. The market caught up with this in the middle of last year and the discount closed in to 4.2% in October 2018. However, the vicious sell-off which hit UK small caps in the final quarter of the year saw the discount widen once again.
DISCOUNT
Henderson Opportunities (LSE:HOT) – 15.2%
At 15.2% HOT is trading on a discount wider than all but one UK All Companies trust. The sector average is 7.4% and even the UK Smaller Companies sector is trading on an average of just 8.4%, with only two trusts wider than HOT.
HOT is a volatile investment. It is consistently significantly geared, and the managers James Henderson and Laura Foll typically run high weightings to the cyclically exposed industrial sector, and also have a liking for picking high growth technology stocks. It has a structural bias to small and mid caps, and the managers say that their large-cap exposure
The trust traded on a premium for much of 2014 when the UK economy was perceived as being strong and the small and mid-caps were outperforming. In our view, the current discount reflects poor sentiment to the UK, to small and mid-caps, which are seen as domestically-focused, and to value.
On the current discount, it is yielding 2.1%, with the dividend growth over the past five years being 10.4% per annum. Over the next ten years should that growth be replicated the trust would return 34.1% of the original investment in income, compared to 28.5% should it have been trading at par.
Menhaden (LSE:MHN) - 26.6%
Menhaden launched in 2015 as a vehicle focused on renewable energy and energy efficiency. Unfortunately, the oil price slumped that year, undermining the case for such a strategy. The trust also suffered from some poor stock picks, and NAV had fallen by 25% by the end of 2016. However, an overhaul of the management team that year meant the portfolio was refashioned by the end of Q1 2017, and since then NAV returns have been improving. As we highlighted in our recent update, the trust has outperformed global equity markets as well as its closed and open-ended peer groups over the past year.
PERFORMANCE
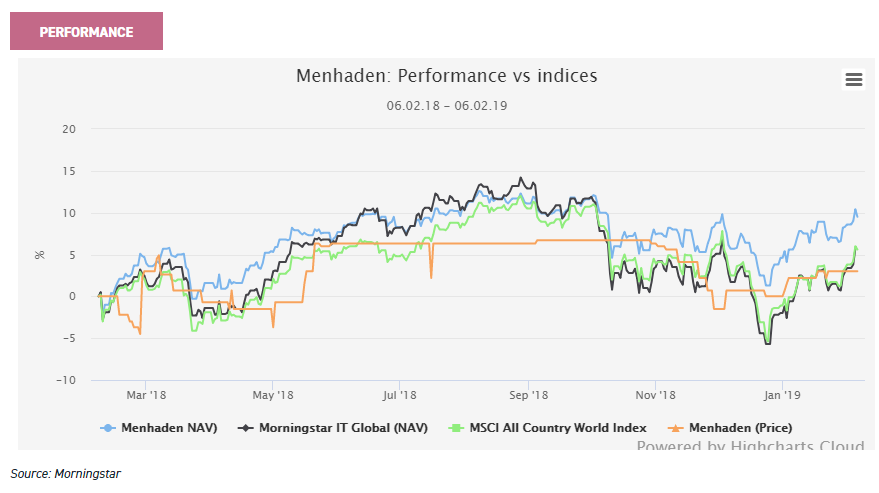
Should the good performance be continued, it could be one reason the discount could close. With the new management team clarifying the strategy of the fund and emphasising traditional metrics over the environmental focus, we think investors are likely to be more open to the strategy. We believe the philosophy can be better described as using a "value" focus to identify durable companies, with strong pricing power and very high barriers to entry, aiming to remain invested for the very long term. Environmental concerns are important within this context as the managers believe that environmental considerations - and more specifically resource efficiency - will become increasingly relevant for businesses of all types. Those that provide their products or services in the most resource efficient way will be more successful - both in terms of having lower costs / taxes, and their products will appeal more to an increasingly aware consumers.
However, the real kicker for discount seekers is that the trust faces a continuation vote at the AGM in May 2020. The current share register is dominated by the initial shareholders such as the Mittal and Goldsmith families. Although it remains uncertain how they will vote in the AGM, if the recent improvement in performance is not sustained, we think it would be hard for the board to ignore independent shareholders over those with more entrenched interests. We think that either the trust sees its improved performance continue and the discount narrows that way, or it is wound up and capital returned at NAV.
Oakley Capital Investments (LSE:OCI) - 30% (to Numis estimated NAV)
OCI is an AIM-listed direct private equity trust, focusing on the consumer, education and TMT sectors. The team typically invest at a very early stage and back proven entrepreneurs in niche businesses, help them professionalise their companies and achieve the next leg of growth. This process has seen them become the third-best performing listed PE fund over ten years in NAV terms, returning 150% for a peer group average (excluding Electra) of 105%.
Despite this solid long-term record, the discount widened in 2016 to 40%. One reason was dilutive share issuance, and having seen the market's reaction the board has committee to not do this again. They also responded by committing to a dividend (4.5p a year ongoing) and ramping up investor relations activities. There has been some success, with the discount coming in to 25%.
Click here to be alerted when we publish our full note on the trust.
Tetragon Financial (LSE:TFG) - 47.4%
Tetragon Financial Group has net assets of $2.1 billion and trades on a discount to NAV of around 47% (Numis estimate). There are US$ and £ denominated shares, but both give exposure to the same underlying investments and dollar exposure. A discount this wide clearly raises eyebrows, but we believe TFG passes the sniff test.
The company is certainly complex – it comprises investments in a number of "alternative" funds – as broad as convertible bonds, event driven equity strategies, bank loans and real estate which shouldn't exhibit much volatility. However, it also has stakes in a number of asset management companies (held within TFG Asset Management, representing 30% of NAV), many of which manage the company's capital, and the valuations of which could be quite volatile over the medium term. However, TFG has largely achieved steady positive returns since launch, and certainly since the current strategy has been adopted. Indeed, over the past five years, the NAV total returns have been 10.3% pa. Given the underlying asset classes, we hazard that the NAV should be relatively uncorrelated with equity markets going forward.
The company's objective is to provide stable returns across cycles, and generate distributable income and capital appreciation. TFG's shares currently offer a dividend yield of 6.1%. The principals and employees at TFG own around 26% of the shares, which certainly aligns them with shareholders, however it is worth noting that the shares are "non-voting", which puts shareholders at the mercy of Tetragon's principals: Reade Griffith and Paddy Dear, who also control the investment manager.
Historically there has been a certain about of discord between some non-voting shareholders and Tetragon evidenced by the recent buyback tender for 4.5% of the shares, which according to Numis was executed at a c. 49% discount to the prevailing NAV estimate, and a 6% discount to the share price which certainly reflects some dissatisfaction. One other wrinkle for potential investors might be the fees which are charged at 1.5% of NAV and a 25% performance fee (also on NAV) above a hurdle of Libor +2.65%. The stated OCF of TFG is 1.74% (as at 31stDecember 2017) and the KID RIY cost is 5.66%. In our view, there is a price for everything, and so corporate governance issues aside, the discount of 47% on a portfolio of uncorrelated assets which have delivered solid returns in the past is worth a closer look for those who aren't too fainthearted.
Kepler Partners is a third-party supplier and not part of interactive investor. Neither Kepler Partners or interactive investor will be responsible for any losses that may be incurred as a result of a trading idea.
Full performance can be found on the company or index summary page on the interactive investor website. Simply click on the company's or index name highlighted in the article.
Important Information
Kepler Partners is not authorised to make recommendations to Retail Clients. This report is based on factual information only, and is solely for information purposes only and any views contained in it must not be construed as investment or tax advice or a recommendation to buy, sell or take any action in relation to any investment.
This report has been issued by Kepler Partners LLP solely for information purposes only and the views contained in it must not be construed as investment or tax advice or a recommendation to buy, sell or take any action in relation to any investment. If you are unclear about any of the information on this website or its suitability for you, please contact your financial or tax adviser, or an independent financial or tax adviser before making any investment or financial decisions.
The information provided on this website is not intended for distribution to, or use by, any person or entity in any jurisdiction or country where such distribution or use would be contrary to law or regulation or which would subject Kepler Partners LLP to any registration requirement within such jurisdiction or country. Persons who access this information are required to inform themselves and to comply with any such restrictions. In particular, this website is exclusively for non-US Persons.
The information in this website is not for distribution to and does not constitute an offer to sell or the solicitation of any offer to buy any securities in the United States of America to or for the benefit of US Persons.
This is a marketing document, should be considered non-independent research and is subject to the rules in COBS 12.3 relating to such research. It has not been prepared in accordance with legal requirements designed to promote the independence of investment research.
No representation or warranty, express or implied, is given by any person as to the accuracy or completeness of the information and no responsibility or liability is accepted for the accuracy or sufficiency of any of the information, for any errors, omissions or misstatements, negligent or otherwise. Any views and opinions, whilst given in good faith, are subject to change without notice.
This is not an official confirmation of terms and is not to be taken as advice to take any action in relation to any investment mentioned herein. Any prices or quotations contained herein are indicative only.
Kepler Partners LLP (including its partners, employees and representatives) or a connected person may have positions in or options on the securities detailed in this report, and may buy, sell or offer to purchase or sell such securities from time to time, but will at all times be subject to restrictions imposed by the firm's internal rules. A copy of the firm's conflict of interest policy is available on request.
Past performance is not necessarily a guide to the future. The value of investments can fall as well as rise and you may get back less than you invested when you decide to sell your investments. It is strongly recommended that Independent financial advice should be taken before entering into any financial transaction.
PLEASE SEE ALSO OUR TERMS AND CONDITIONS
Kepler Partners LLP is a limited liability partnership registered in England and Wales at 9/10 Savile Row, London W1S 3PF with registered number OC334771.
Kepler Partners LLP is authorised and regulated by the Financial Conduct Authority.
These articles are provided for information purposes only. Occasionally, an opinion about whether to buy or sell a specific investment may be provided by third parties. The content is not intended to be a personal recommendation to buy or sell any financial instrument or product, or to adopt any investment strategy as it is not provided based on an assessment of your investing knowledge and experience, your financial situation or your investment objectives. The value of your investments, and the income derived from them, may go down as well as up. You may not get back all the money that you invest. The investments referred to in this article may not be suitable for all investors, and if in doubt, an investor should seek advice from a qualified investment adviser.
Full performance can be found on the company or index summary page on the interactive investor website. Simply click on the company's or index name highlighted in the article.