Four of America’s most famous companies: buy, hold or sell?
28th January 2022 11:00
by Rodney Hobson from interactive investor
Recent weakness has created a new buying opportunity at one of these iconic businesses, but our overseas investing expert thinks one is a sell. Here’s his rationale.

Rodney Hobson is an experienced financial writer and commentator who has held senior editorial positions on publications and websites in the UK and Asia, including Business News Editor on The Times and Editor of Shares magazine. He speaks at investment shows, including the London Investor Show, and on cruise ships. His investment books include Shares Made Simple, the best-selling beginner's guide to the stock market. He is qualified as a representative under the Financial Services Act.
Fourth-quarter figures from American stocks have shown widely contrasting fortunes. Time to sort the wheat from the chaff.
Johnson & Johnson (NYSE:JNJ) is not just for pandemics, although there have been several pieces of good news concerning its Covid-19 vaccine. It saw a strong performance in 2021 across all parts of its healthcare business, which includes medical devices, pharmaceuticals and consumer goods, and it enters 2022 in a spirit of optimism.
- No trading fees on US shares until 11 February. Click here for details
- Watch our share, fund and trust tips, plus outlook videos for 2022
Total sales were up 14% to $93.8 billion and, although there was a slight slowdown in growth in the final quarter, the rise of 10% to $24.5 billion was still very strong. Net earnings leapt from $1.74 billion to $4.74 billion in the quarter, taking the full-year total up 42% to $14.7 billion, a great performance.
- Invest with ii: Top US Stocks | Super 60 Investment Ideas | Share Tips & Ideas
In pharmaceuticals, the largest division, successes included treatments for myeloma, inflammatory disease, psoriasis and schizophrenia, a remarkably wide range that augurs well for continued progress.

Past performance is not a guide to future performance.
It is still early days, but there are encouraging signs that J&J’s Janssen Covid-19 vaccine offers long lasting protection even with a single shot.
J&J continues to make progress in settling historical claims over prescription opioid medication, the latest being a $63 million settlement in Nevada, removing the company from pending litigation by the state.
The shares recovered well from $120 at the bottom of the pandemic market crash to $180 last August but are now a little off their best at $170. Recent weakness has created a new buying opportunity.
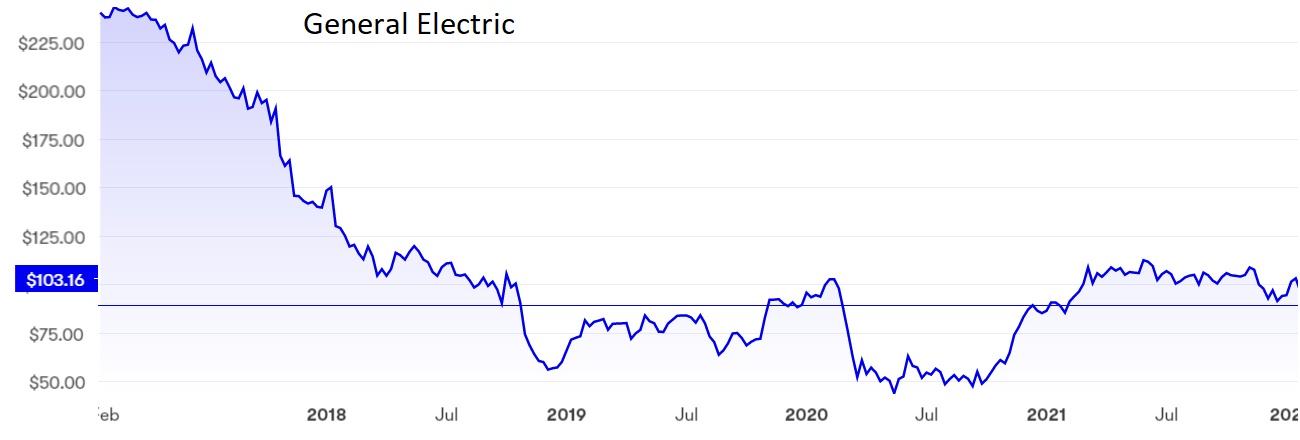
Multinational conglomerate General Electric (NYSE:GE) has a decidedly uncertain future, as reflected in the fact that the share price is back to where was 12 months ago. Shareholders await the proposed splitting of the company into three parts: healthcare, aviation and power/renewables.
- US stock market outlook 2022: more record highs for Wall Street?
- Baillie Gifford gives its opinion on the US tech crash
Healthcare, arguably the best performer, will be spun off early next year while power and renewables, currently two separate poorly performing units, will be merged in 2023. That represents a lot of distraction for management already grappling with a 3.5% drop in revenue in the fourth quarter. Reducing debt, a sensible priority, has gone well but has perhaps been at the expense of improving the business.
While investors may choose to ignore a $3.9 billion loss as a technicality caused by the repayment of debt, they can hardly turn a blind eye to a 3% fall in revenue to $20.3 billion in the quarter as supply chain problems took their toll. Management expects a bounce-back this year, especially in aviation, but investors have a lot to take on trust.
The shares were $240 at the start of 2017; they are now around $90. There is a strong possibility that the $50 level they plumbed last summer will be revisited.

Past performance is not a guide to future performance.
As if the pandemic’s effect on commercial aviation had not hit Boeing (NYSE:BA) badly enough, the aircraft manufacturer blamed its defence, space and security arm for a 9.3% drop in revenue to $14.8 billion in the fourth quarter of 2021.
Commercial jet sales were flat despite higher deliveries of 737 aircraft as orders recovered from the grounding of existing planes after two fatal crashes.
- Why Bill Ackman just took a massive punt on Netflix
- Friends & Family: ii customers can give up to 5 people a free subscription to ii, for just £5 a month extra. Learn more
At least there was a return to positive cashflow and the net loss halved from $8.44 billion to $4.16 billion, but that was still a hefty deficit after two profitable quarters, and it meant that Boeing has now recorded an annual loss for three consecutive years.
Nor is it any consolation that the latest loss was mainly – though not entirely – due to a $3.5 billion charge against its new 787 Dreamliner aircraft. Aircraft are being checked for cracks in carbon composite structures. The material is a vital component in making the planes lighter and therefore cheaper to fly.

Past performance is not a guide to future performance.
Abnormal production costs for the Dreamliner are now expected to reach $2 billion, double the previous estimate, while deliveries have been halted and production reduced. The timing on when this will be reversed is down to the US Federal Aviation Administration and is therefore out of Boeing’s hands.
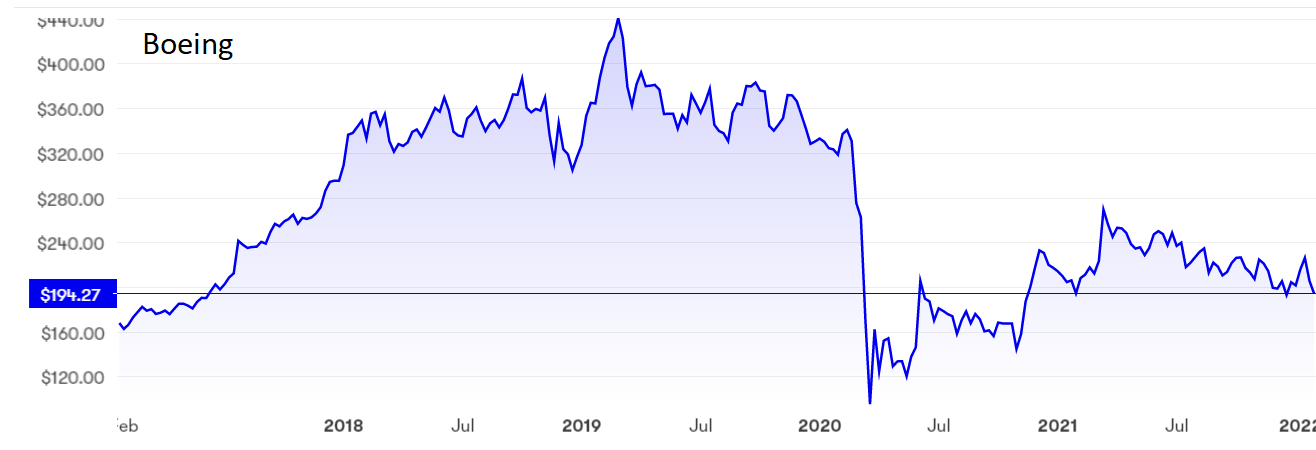
The shares are down by more than half since hitting $440 in March 2019 and the recovery since the pandemic lows at $95 a year later has petered out. If the shares do not find support at the current $190, then the next potential floor could be as low as $145.
- Subscribe for free to the ii YouTube channel for our latest share tips and fund manager interviews
- Take control of your retirement planning with our award-winning, low-cost Self-Invested Personal Pension (SIPP)
One of the strongest tech stocks at the moment is International Business Machines (NYSE:IBM), which sells software, IT services, consulting, and hardware. Revenue rose 6.5% to $16.7 billion in the fourth quarter of 2021, beating analysts’ expectations. Pre-tax profits nearly trebled to $2.87 billion as cloud computing drove growth for the software and consulting arms.
That rounded off a great year on a high note. Over 12 months, revenue rose just 3.9% but pre-tax profits soared 88% to $4.84 billion. The company’s own projections for 2022 suggest mid-single digit revenue growth with strong free cash flow.
The infrastructure services unit Kyndryl, the poorest performing part of the business, was de-merged in November, thus removing a distraction from the group’s strategy and a brake on its performance.

Past performance is not a guide to future performance.
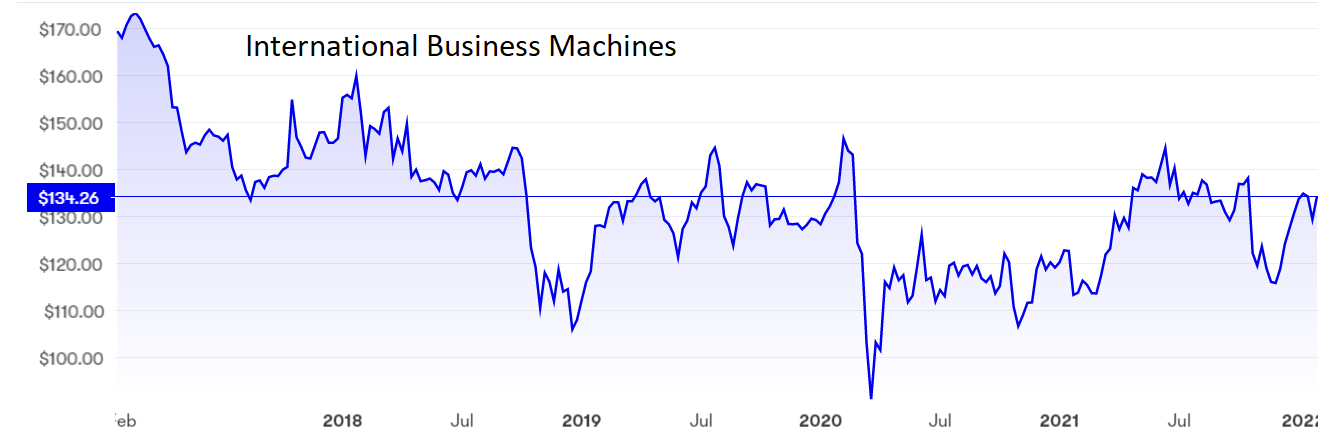
The shares have swung between $115 and $145 over the past 12 months and are currently in the middle of that range, having enjoyed a boost from the latest results. The yield of 4.88% is attractive.
Hobson’s choice: I first recommended buying IBM in November 2019, when I erroneously believed that the share price was underpinned at $130, and suggested that the case for buying was more compelling at $120 last March, now. At the current $134 the stock remains a buy.
I have recommended Johnson & Johnson three times, first at $134, then $144, and more recently at $160 last October, when I forecast solid if unspectacular progress. The stock is still a buy at $170, where the yield is 2.5%.
General Electric is a sell given all the uncertainty. While existing shareholders may decide to grit their teeth and hope it all turns out right in the end, the stock is best avoided if you are not already in.
At least General Electric’s aircraft engines business is looking up a little; that suggests the problems at Boeing are specific to the company, making Boeing shares a sell.
Rodney Hobson is a freelance contributor and not a direct employee of interactive investor.
These articles are provided for information purposes only. Occasionally, an opinion about whether to buy or sell a specific investment may be provided by third parties. The content is not intended to be a personal recommendation to buy or sell any financial instrument or product, or to adopt any investment strategy as it is not provided based on an assessment of your investing knowledge and experience, your financial situation or your investment objectives. The value of your investments, and the income derived from them, may go down as well as up. You may not get back all the money that you invest. The investments referred to in this article may not be suitable for all investors, and if in doubt, an investor should seek advice from a qualified investment adviser.
Full performance can be found on the company or index summary page on the interactive investor website. Simply click on the company's or index name highlighted in the article.
Disclosure
We use a combination of fundamental and technical analysis in forming our view as to the valuation and prospects of an investment. Where relevant we have set out those particular matters we think are important in the above article, but further detail can be found here.
Please note that our article on this investment should not be considered to be a regular publication.
Details of all recommendations issued by ii during the previous 12-month period can be found here.
ii adheres to a strict code of conduct. Contributors may hold shares or have other interests in companies included in these portfolios, which could create a conflict of interests. Contributors intending to write about any financial instruments in which they have an interest are required to disclose such interest to ii and in the article itself. ii will at all times consider whether such interest impairs the objectivity of the recommendation.
In addition, individuals involved in the production of investment articles are subject to a personal account dealing restriction, which prevents them from placing a transaction in the specified instrument(s) for a period before and for five working days after such publication. This is to avoid personal interests conflicting with the interests of the recipients of those investment articles.