Getting active could trigger boom at these three trusts
We look at the continued rise of passive funds and how investment trust managers are countering it.
7th February 2020 15:26
This content is provided by Kepler Trust Intelligence, an investment trust focused website for private and professional investors. Kepler Trust Intelligence is a third-party supplier and not part of interactive investor. It is provided for information only and does not constitute a personal recommendation.
Material produced by Kepler Trust Intelligence should be considered a marketing communication, and is not independent research.
We look at the continued rise of passive funds and how investment trust managers are countering it.

William Sobczak is an analyst at Kepler Trust Intelligence.
The best form of defence
Last year we published a number of studies showing that investment trust managers were counteracting the rise of passive vehicles by further concentrating their portfolios and using the advantages of the closed-end structure such as gearing and the ability to pay income from capital more aggressively.
New analysis from the team at Kepler shows that that over the past five years, trusts which have seen the greatest reduction in number of stocks in portfolios have generated the highest levels of alpha. Similarly those trusts which reduced their turnover the most have generated a higher alpha compared with those which haven’t. This corroborates the academic literature on the subject. In our view this finding is a strong indicator of the future direction for investment trusts in combating the threat from passives.
In this article we dive into the data, which shows that having more active portfolios has delivered strong benefits for shareholders. We also consider the reasons why the investment trust universe remains a place that active managers can outperform. Finally, we highlight three trusts that have most recently taken decisive steps to become significantly more active.
"Don't look for the needle in the haystack. Just buy the haystack."
Jack Bogle, founder of Vanguard
The strategy of tracking an index at low cost is now so commonplace it is almost difficult to imagine it being innovative. It has only been in the last two decades, however, that we have truly seen investors choose passive funds over active funds. The chart below demonstrates how passives have dramatically increased their market share over the past 20 years, in comparison to active strategies.
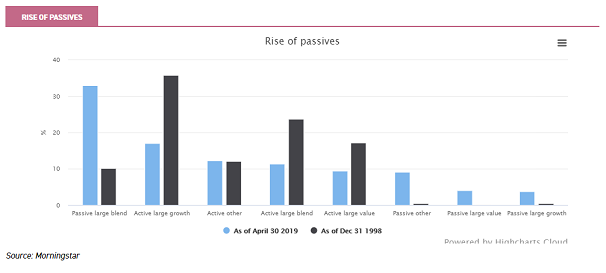
According to Morningstar, there are now 163 index funds available in the UK investment universe, offering exposure to a wide range of different indices. These funds had net inflows of £19.4 billion in 2019, an 11% increase from £17.4 billion in 2018. Total assets under management in these funds climbed from £191 billion at the end of 2018 to £247bn by the end of 2019 (Morningstar). Rising stock markets also contributed to a significant proportion of the increase in assets.
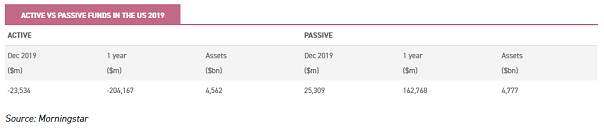
For the first time, passive funds in the US finished 2019 with a larger market share than actively managed strategies (51.2%), having seen inflows of $162.8 billion in 2019. Active US equity funds saw outflows of $204.2 billion in 2019, despite the S&P 500 rising by 31.5% (Morningstar).
The key reason for the shift from active to passive funds has been the underperformance of active managers and their relatively high charges. The most common source of data on this topic comes from the semi-annual SPIVA scorecard, which compares actively managed funds against their appropriate benchmarks.
SPIVA is principally US-focussed, with considerably more data available than for European equity managers or the rest of the world. In the most recent US report (ending in June 2019) 71% of domestic equity funds underperformed the S&P Composite 1500, slightly more than the previous figure of 69%. Additionally the majority of large-cap (70%) and multi-cap (72%) funds lagged their benchmarks. In contrast, mid-cap and small-cap active funds performed relatively better; approximately 64% of active managers in both categories beat their benchmarks for the one-year period.
US mutual funds do not reflect the whole investment universe
While these statistics present disappointing numbers for the active management industry as a whole, we think it is important to recognise that the mutual funds in the US are not necessarily reflective of the rest of the world.
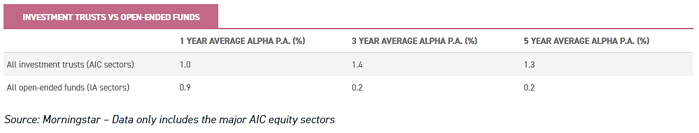
Most commentators on the active vs passive debate conclude that active managers cannot outperform their benchmarks on a risk-adjusted basis. Our analysis, however, shows this assertion to be untrue, certainly over the last five years. Instead it is just a select few areas where managers struggle, and researchers (such as SPIVA) tend to focus on those areas.
As can be seen in the table below, on average investment trusts and UK-domiciled open-ended funds consistently offer greater levels of alpha vs their best fit benchmarks (Morningstar MPT benchmark).
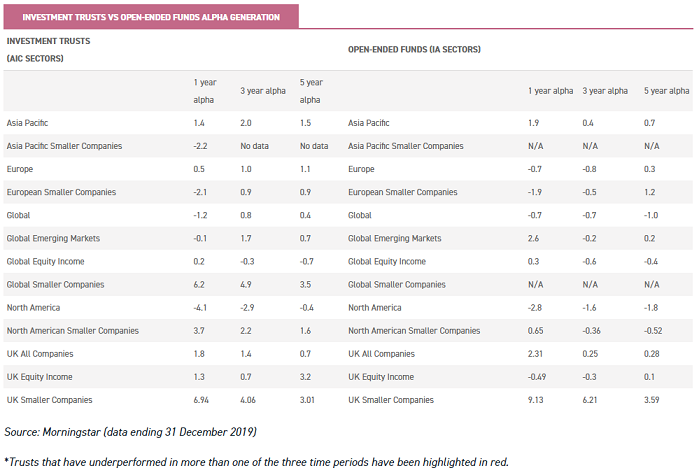
When the data is broken down, there are a few specific geographic sectors where managers have struggled to outperform. As can be seen below, North American investment trust managers have dramatically underperformed their benchmarks over all time periods; while Global Equity Income managers have also struggled.
The two are perhaps related, especially given the US market represents a significant percentage of global benchmarks (63.3% of MSCI World Index). Nonetheless managers who focus on the Asia Pacific, Europe, Global Smaller Companies, North American Smaller Companies and All UK sectors have consistently outperformed their benchmarks over the past five years.
The data is less flattering for open-ended funds than for investment trusts, with considerably more sectors underperforming their benchmarks on average.
Once again North American focussed funds are an area of underperformance, although this analysis also includes the Smaller Companies sector. Furthermore, the sectors that have underperformed have done so over multiple periods, suggesting that there is some consistency in their struggle to generate alpha.
It is worth remembering that survivorship bias will have had an impact on this data. Trusts and funds that have been wound down, or have changed their mandates thanks to poor performance, mean that the statistics below likely overestimate the average historical performance of the sectors.
The investment trust advantage
As discussed in our previous research, Go big or go home, the overwhelming evidence is that fund managers who are willing to back their convictions with punchy bets are the ones that tend to outperform by the highest margin.
Academic work by Antti Petajisto (2013), who has taught at Yale and NYU, showed that the most active stock pickers outperformed their benchmarks by 1.26% a year (after fees) on average. On the other hand closet indexers, on average, performed in line with their benchmark before fees, which caused consistent underperformance after fees.
Following this research, in 2015 Martijn Cremers looked at high ‘active share’ portfolios while varying the investment time frame. Only the investment managers who took a patient perspective, with holding durations of over two years, outperformed (over 2% per annum). In comparison the funds which traded frequently generally underperformed, regardless of having a high active share.
These findings are particularly pertinent for investment trusts, where the closed-end structure allows managers to hold more concentrated portfolios and take a longer-term view on them.
Furthermore the capacity for managers to build up revenue reserves allows investment trust managers to invest for the long term; and deliver a specific level of income by not trading the portfolio.
Another related point is that because investment trusts are overseen by independent boards on behalf of shareholders, managers need not overly concern themselves about short-term swings in sentiment, unlike open-ended managers. Instead they can focus on achieving the long-term goals of investors.
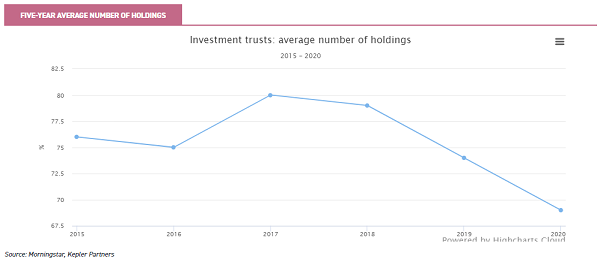
Theory seems to be filtering down into practice. Our analysis shows that the average number of holdings has been steadily reducing over the past five years. The average trust (in the major equity indices) has 69 holdings in its portfolio, in comparison with an average of 76 in 2015. This represents a decrease of almost 10%, which we think is significant.
Henderson EuroTrust (LSE:HNE) for example has seen the new manager (as of 2018), Jamie Ross, make the decision to significantly increase the concentration of the portfolio. The manager's view is that having fewer high-conviction stocks will help him deliver greater returns for shareholders.
When we met with Jamie in December 2019, this was clearly a point that he felt strongly about. The portfolio is now made up of just 45 holdings, down from the 55-60 range typically held by his predecessor. Mercantile (LSE:MRC) is another trust to have had the manager increase the portfolio’s concentration, although remaining more diversified than others in the sector.
The past five years have seen the managers decrease their portfolio from 136 holdings in 2015 to 87 at the end of 2019. They believe this more concentrated – but still highly diversified – approach helps them to focus on quality businesses with compelling valuations, and where they believe that prospects for growth is not reflected in the share price.
Concentration is not the only game in town, however. Monks (LSE:MNKS) has seen the number of holdings in the portfolio increase over the past five years, yet performance has dramatically improved. Baillie Gifford partner Charles Plowden’s Global Alpha team took over the portfolio in 2015, taking the number of positions from 99 under the previous manager to 127 at the end of 2019.
For Charles diversification is a key attribute of the portfolio, rather than a hindrance to returns, which offers exposure to growth companies without the associated specific risk.
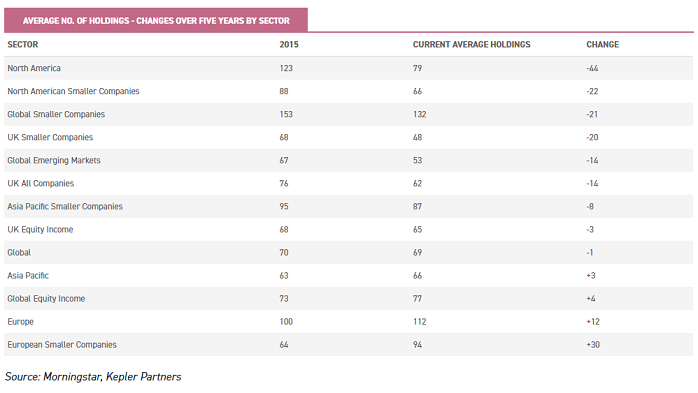
This disparity in opinions on activeness vs diversification is seen across the sectors. For example, in the UK and North America sectors we have seen significant reductions in the number of holdings.
Trusts in the AIC North America, North American Smaller Companies and UK Smaller Companies sectors have seen a reduction of over 20 holdings on average over five years. In the AIC Asia Pacific, Europe and European Smaller Companies and Global Equity Income sectors, however, we have seen the number of holdings increase.
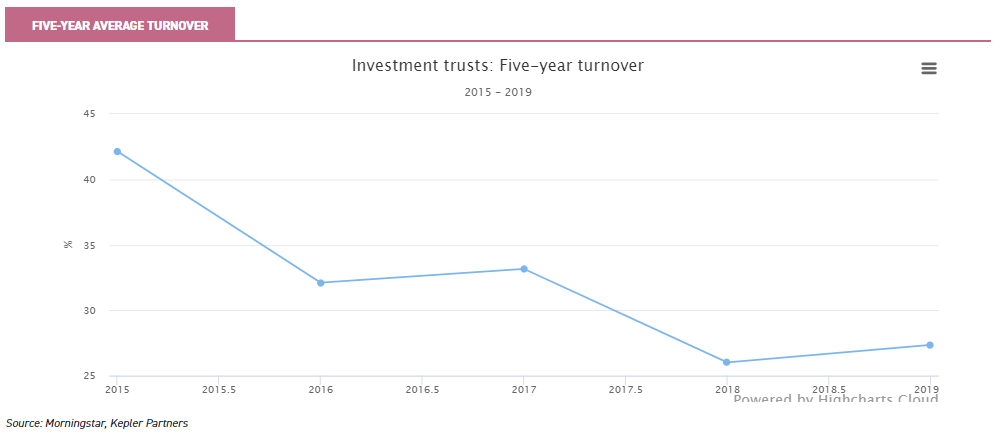
Alongside the increase in concentration, our analysis shows that the investment trust sector has seen a shift towards more patient investment strategies; with the mean turnover in portfolios reducing by c. 15% over a five-year period.
Jupiter US Smaller Companies (LSE:JUS) is an example of a trust that has reduced its turnover over the past five years. This was a deliberate instruction from the board, who (having consulted externally) believed the manager was not benefitting enough from his correct stock decisions. As a result long-term manager Robert Siddles further concentrated the portfolio in 2017 and has made a conscious effort to run winners for longer.
Conclusion
When we combine the statistics on concentration and annual turnover, we find similar results to that of the academic literature. In general the sectors which had seen the largest average reductions to their number of holdings generated higher levels of alpha.
The sectors which reduced their turnover by more than the average generated an alpha of 1.80 over five years, in comparison to 0.78 from those below the average.
Similarly the sectors with above-average decreases in their concentration over five years saw an average alpha of 1.51%, in comparison to 1.07 from those below the average.
Three trusts which are becoming more concentrated...
We believe the trend toward increased ‘activeness’ will continue, with closet trackers in the investment trust falling by the wayside or, alternatively, mandates or managers replaced in the face of competition from passives.
Recent anecdotal evidence would suggest that the pace of change is hotting up. We highlight three trusts below where the manager or board has made a conscious effort to increase the portfolio’s concentration over the past year; which we believe will help the managers generate superior levels of alpha going forward.
JPMorgan American
2019 saw JPMorgan American (LSE:JAM) replace its lead fund manager Garrett Fish, and move to a hybrid growth-and-value strategy under two fund managers within the same broad team. Jonathan Simon and Timothy Parton now each control a portfolio, with one focusing on value and the other focusing on growth.
Together they have increased the concentration of the overall portfolio, and are each expected to hold between ten and 20 stocks. As a result the overall portfolio is expected to have a maximum of 40 holdings.
It is too early to judge the impact to performance from this change but the trust offers a highly active core exposure to the US at very low cost (OCF projected to be 0.33% in the 2020 financial year). The trust continues to trade on a discount of 4.8% compared with the one year average of 4.9%.
Martin Currie Global Portfolio
Zehrid Osmani took over the portfolio of Martin Currie Global Portfolio (LSE:MNP) in June 2018. Since then he has incorporated a higher conviction approach, while moving the portfolio towards more ‘growthy’ companies.
The start of 2015 saw the trust with 63 holdings, and this has since narrowed to just 34 companies. These companies are considered to be the highest quality, and ones that he believes will continue to deliver high returns on capital and compound growth in their earnings throughout the cycle.
Since taking over the portfolio Zehrid’s performance has been strong. Over the 18 month period the trust has NAV total returns of 24.8%, compared with 16.5% from the MSCI World Index. This has caused the discount to narrow significantly and the trust currently trades at a premium of 1.5%.
Fidelity Special Values
Fidelity Special Values (LSE:FSV) is run by Alex Wright, who aims to identify undervalued companies from across the UK market cap spectrum and hold onto them until the price properly reflects their value.
The trust has been known for having a more diversified approach than many UK Equity funds, and although this remains true, the manager has reduced the number of holdings in the portfolio by more than 20% over the past five years. Interestingly the manager uses a high turnover approach, typically between 50% to 80% p.a. This reflects the fact that he is looking to hold stocks through defined periods of change and then move on.
Over the past five years the trust has performed reasonably well, delivering NAV total returns of 58.0%. In comparison the FTSE All Share has returned 43.8%. We believe, however, that the increase in concentration is now giving the trust a greater opportunity to diverge returns compared with the benchmark.
Kepler Partners is a third-party supplier and not part of interactive investor. Neither Kepler Partners or interactive investor will be responsible for any losses that may be incurred as a result of a trading idea.
Full performance can be found on the company or index summary page on the interactive investor website. Simply click on the company's or index name highlighted in the article.
Important Information
Kepler Partners is not authorised to make recommendations to Retail Clients. This report is based on factual information only, and is solely for information purposes only and any views contained in it must not be construed as investment or tax advice or a recommendation to buy, sell or take any action in relation to any investment.
This report has been issued by Kepler Partners LLP solely for information purposes only and the views contained in it must not be construed as investment or tax advice or a recommendation to buy, sell or take any action in relation to any investment. If you are unclear about any of the information on this website or its suitability for you, please contact your financial or tax adviser, or an independent financial or tax adviser before making any investment or financial decisions.
The information provided on this website is not intended for distribution to, or use by, any person or entity in any jurisdiction or country where such distribution or use would be contrary to law or regulation or which would subject Kepler Partners LLP to any registration requirement within such jurisdiction or country. Persons who access this information are required to inform themselves and to comply with any such restrictions. In particular, this website is exclusively for non-US Persons. The information in this website is not for distribution to and does not constitute an offer to sell or the solicitation of any offer to buy any securities in the United States of America to or for the benefit of US Persons.
This is a marketing document, should be considered non-independent research and is subject to the rules in COBS 12.3 relating to such research. It has not been prepared in accordance with legal requirements designed to promote the independence of investment research.
No representation or warranty, express or implied, is given by any person as to the accuracy or completeness of the information and no responsibility or liability is accepted for the accuracy or sufficiency of any of the information, for any errors, omissions or misstatements, negligent or otherwise. Any views and opinions, whilst given in good faith, are subject to change without notice.
This is not an official confirmation of terms and is not to be taken as advice to take any action in relation to any investment mentioned herein. Any prices or quotations contained herein are indicative only.
Kepler Partners LLP (including its partners, employees and representatives) or a connected person may have positions in or options on the securities detailed in this report, and may buy, sell or offer to purchase or sell such securities from time to time, but will at all times be subject to restrictions imposed by the firm's internal rules. A copy of the firm's conflict of interest policy is available on request.
Past performance is not necessarily a guide to the future. The value of investments can fall as well as rise and you may get back less than you invested when you decide to sell your investments. It is strongly recommended that Independent financial advice should be taken before entering into any financial transaction.
PLEASE SEE ALSO OUR TERMS AND CONDITIONS
Kepler Partners LLP is a limited liability partnership registered in England and Wales at 9/10 Savile Row, London W1S 3PF with registered number OC334771.
Kepler Partners LLP is authorised and regulated by the Financial Conduct Authority.
Kepler Partners is a third-party supplier and not part of interactive investor. Neither Kepler Partners or interactive investor will be responsible for any losses that may be incurred as a result of a trading idea.
These articles are provided for information purposes only. Occasionally, an opinion about whether to buy or sell a specific investment may be provided by third parties. The content is not intended to be a personal recommendation to buy or sell any financial instrument or product, or to adopt any investment strategy as it is not provided based on an assessment of your investing knowledge and experience, your financial situation or your investment objectives. The value of your investments, and the income derived from them, may go down as well as up. You may not get back all the money that you invest. The investments referred to in this article may not be suitable for all investors, and if in doubt, an investor should seek advice from a qualified investment adviser.
Full performance can be found on the company or index summary page on the interactive investor website. Simply click on the company's or index name highlighted in the article.
Important Information
Kepler Partners is not authorised to make recommendations to Retail Clients. This report is based on factual information only, and is solely for information purposes only and any views contained in it must not be construed as investment or tax advice or a recommendation to buy, sell or take any action in relation to any investment.
This report has been issued by Kepler Partners LLP solely for information purposes only and the views contained in it must not be construed as investment or tax advice or a recommendation to buy, sell or take any action in relation to any investment. If you are unclear about any of the information on this website or its suitability for you, please contact your financial or tax adviser, or an independent financial or tax adviser before making any investment or financial decisions.
The information provided on this website is not intended for distribution to, or use by, any person or entity in any jurisdiction or country where such distribution or use would be contrary to law or regulation or which would subject Kepler Partners LLP to any registration requirement within such jurisdiction or country. Persons who access this information are required to inform themselves and to comply with any such restrictions. In particular, this website is exclusively for non-US Persons. The information in this website is not for distribution to and does not constitute an offer to sell or the solicitation of any offer to buy any securities in the United States of America to or for the benefit of US Persons.
This is a marketing document, should be considered non-independent research and is subject to the rules in COBS 12.3 relating to such research. It has not been prepared in accordance with legal requirements designed to promote the independence of investment research.
No representation or warranty, express or implied, is given by any person as to the accuracy or completeness of the information and no responsibility or liability is accepted for the accuracy or sufficiency of any of the information, for any errors, omissions or misstatements, negligent or otherwise. Any views and opinions, whilst given in good faith, are subject to change without notice.
This is not an official confirmation of terms and is not to be taken as advice to take any action in relation to any investment mentioned herein. Any prices or quotations contained herein are indicative only.
Kepler Partners LLP (including its partners, employees and representatives) or a connected person may have positions in or options on the securities detailed in this report, and may buy, sell or offer to purchase or sell such securities from time to time, but will at all times be subject to restrictions imposed by the firm's internal rules. A copy of the firm's conflict of interest policy is available on request.
Past performance is not necessarily a guide to the future. The value of investments can fall as well as rise and you may get back less than you invested when you decide to sell your investments. It is strongly recommended that Independent financial advice should be taken before entering into any financial transaction.
PLEASE SEE ALSO OUR TERMS AND CONDITIONS
Kepler Partners LLP is a limited liability partnership registered in England and Wales at 9/10 Savile Row, London W1S 3PF with registered number OC334771.
Kepler Partners LLP is authorised and regulated by the Financial Conduct Authority.
These articles are provided for information purposes only. Occasionally, an opinion about whether to buy or sell a specific investment may be provided by third parties. The content is not intended to be a personal recommendation to buy or sell any financial instrument or product, or to adopt any investment strategy as it is not provided based on an assessment of your investing knowledge and experience, your financial situation or your investment objectives. The value of your investments, and the income derived from them, may go down as well as up. You may not get back all the money that you invest. The investments referred to in this article may not be suitable for all investors, and if in doubt, an investor should seek advice from a qualified investment adviser.
Full performance can be found on the company or index summary page on the interactive investor website. Simply click on the company's or index name highlighted in the article.