How to massively reduce risk to your ISA portfolio
Reinvesting the income generated by these assets could also turbocharge long-term portfolio performance.
8th March 2019 16:02
This content is provided by Kepler Trust Intelligence, an investment trust focused website for private and professional investors. Kepler Trust Intelligence is a third-party supplier and not part of interactive investor. It is provided for information only and does not constitute a personal recommendation.
Material produced by Kepler Trust Intelligence should be considered a marketing communication, and is not independent research.
Our research shows that reinvesting the income generated by these assets could also turbocharge long-term portfolio performance.

Stairway to heaven
Many investors think ISA investing is all about sticking equities away for the long term and forgetting about them. However, we think there are good reasons for allocating to alternative income-generating assets in your ISA, even for those concerned with long-term capital growth.
We think that many investors don't fully appreciate the benefit of reducing the volatility on a portfolio. When thinking about long-term returns, the tendency is to think of the average return in the long run as what you will get, and to think of volatility as a measure of the mark to market "discomfort" along the way.
However, this ignores the devastating effect of sequencing risk, and the fact that a particular average annual return can be consistent with negative eventual outcomes. Adding uncorrelated assets, such as alternative income funds, to your portfolio can massively reduce the risk of a terrible investment outcome, and, as we shall see, without necessarily reducing the expected return.
This is certainly true when you consider how favourably the returns of these alternative income funds compare to those from equities in recent years, another fact we think is under-appreciated, and which sets them apart from traditional diversifiers such as high-quality bonds.
There is no guarantee that future return patterns represent the past, of course. With respect to the alternative income funds we consider below, there are specific risks to capital which have to be considered.
However, we think that there is a way to use these trusts taking these risks into consideration. The re-investment of the income from these trusts, reliable in the short term, gives the investor the opportunity to "pound-cost-average" their investment in equities when they look cheap, or reinvest in the same high yielding alternative assets. We consider how this might work below, and look at a range of alternative income funds that might be suitable.
Reducing the volatility of returns reduces the chance of the worst outcomes
Diversification is a key benefit of investing in lower-volatility, income-generating assets. Assets with different sources of risk should have a correlation to each other of below 1 and therefore combining them in a portfolio improves risk-adjusted returns.
Specifically, alternative income investments with high and predictable return streams have so far proved to be less volatile and less correlated to equity returns, given the income component of total returns is delivered whatever the economic environment.
Furthermore, the capital elements of the alternative trusts we consider below are more stable than public equities, even if bearing their own specific risks which have to be taken into consideration. One of the great advantages of investment trusts is they can invest in more illiquid areas than open-ended funds, and these areas can be significantly uncorrelated to equities.
However, it may not be immediately apparent why long-term investors should worry about diversification. Why should someone with a 20-year investment horizon or more worry about the volatility of a portfolio along the way?
The key reason is sequencing risk: the risk that suffering a run of poor results, either at the beginning or the end of the investment period, will provide a poor investment return overall. It is easy to be sucked into thinking that bad years will be "averaged out" of your returns, but this is not necessarily the case.
We believe that sequencing risk is underappreciated by many investors and is a strong reason to avoid going "all-out" into equities in a long-term investment plan.
We created a simple Monte Carlo simulation in Excel to illustrate how this works. A Monte Carlo simulation generates many iterations of possible return paths with the same average return and volatility, allowing us to look at the range of different outcomes consistent with those numbers.
Over the past 20 years, the FTSE All Share has returned 5% a year with a volatility of 17% - surprisingly low returns maybe? We model a 20 year scenario with a £50,000 lump sum being invested today, and with £5,000 invested at the end of each year thereafter.
If we assume the FTSE's average return and volatility are the same over the next 20 years, then the mean return of 1000 simulations would be £300,000. However, in 5% of possible outcomes our ending portfolio value would be just £105,000, considerably less even in nominal terms than the £150,000 invested. In the bottom 1% of cases, i.e. if we had begun investing at the worst possible times, our portfolio would be worth just £70,000.
To illustrate how reducing the volatility of returns improves the situation, we created a portfolio based on our analysis of several alternative income funds (overview of each below), and overlay some simplifying assumptions. A portfolio equally weighted among Greencoat UK Wind (LSE:UKW), Renewables Infrastructure Group (LSE:TRIG), HICL Infrastructure Company (LSE:HICL), SQN Secured Income (LSE:SSIF), M&G Credit Income Investment (LSE:MGCI) and NB Global Floating Rate Income (LSE:NBLS) we assume has a blended dividend yield of 5%. We assume, based on historical values, a volatility of the portfolio of 7% and correlation to equities of 0.25.
By allocating 20% of assets to this sub-portfolio, and with the remaining 80% invested in UK equities, the overall volatility would be just over 10%. Based on the current yields and target returns discussed below, we conservatively assume 5% as a return for our portfolio of diversifiers.
Let's assume (for the time being) we can reinvest back into these same funds in the future at the same rate of return, and the NAVs remain steady in nominal terms over the long-term.
In the graph below, we compare the "pure equity" portfolio and our "alternative income and equity" portfolio. The mean return of both portfolios is the same, but the graph demonstrates that from the Monte Carlo analysis, the worst outcomes of the diversified portfolio are significantly better, and more tightly bunched around the average return.
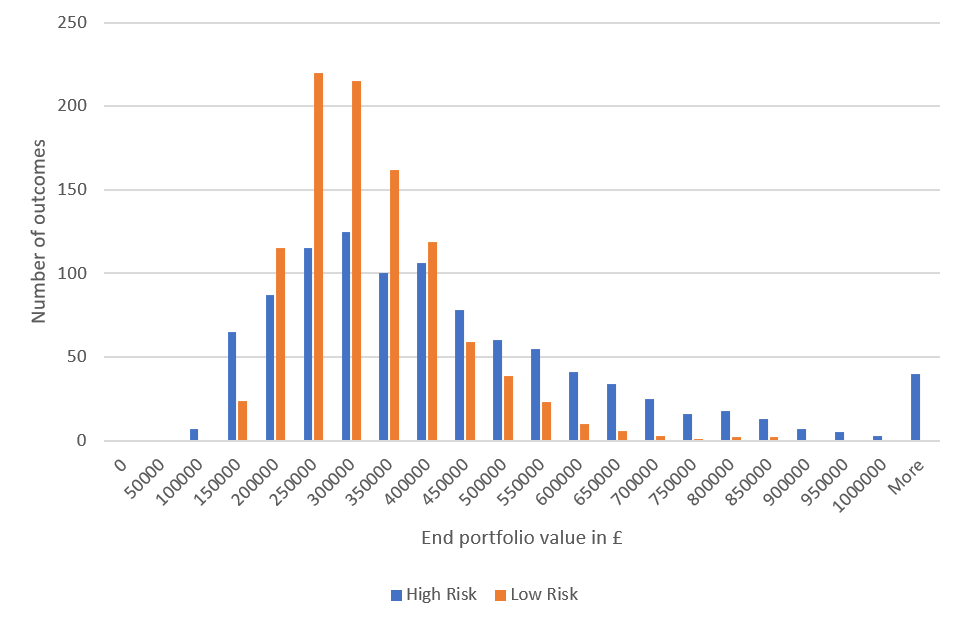
Source: Kepler calculations
The key point to take away from this analysis is that the sequencing (or order) of achieved returns can make a huge difference to the eventual outcome.
Investment careers with the same average return and volatility can end in delight or disaster depending on when the worst years of returns occur. Decreasing the volatility of the portfolio decreases the likelihood of the extreme outcomes, ceteris paribus.
One note of caution is that our model has assumed that the income from our infrastructure funds could be reinvested back into the shares at the same yield, which may not be the case (as we consider below, there is reinvestment risk within these portfolios themselves.)
One way of dealing with this would be to use the income as ammunition to opportunistically invest in the most attractive opportunities at the time.
In years in which the yield on the alternative income funds was lower than the 5% historic return of equities, the investor could invest more into equities.
However, when the yield on the alternative income funds was higher than the long run expected return from equities, the investor could reinvest back into them.
It is worth noting that whilst we assume the same average returns from equities and from alternative income funds, even if the returns from the alternatives reduced slightly, the diminished chances of a disastrous outcome would still be worth including them in our view.
By flexibly and dynamically reinvesting the income as described above, any lower returns from the alternative income funds might be more than made up by higher-than-average equity returns.
This could be a particularly useful strategy to employ in the current economic environment. After 10 years of economic expansion, and with inflation in the US creeping higher and employment full, the suspicion is that we are closer to the end of the cycle than the beginning.
In the UK we have our own potential catalyst for a market retrenchment in Brexit too, meaning the immediate risks to the equity side of the portfolio are potentially higher than average.
The returns on alternatives are surprisingly high
Many listed alternative income funds are generating yields, which are close to the 5% average total return on UK equities over the past two decades. One example is those trusts investing in various infrastructure assets.
These companies buy assets in order to receive long-term contractual cashflows, which are generally not correlated to the economic cycle.
Through judicious use of gearing, they can lock in long-term returns with varying degrees of certainty – more certainty than the returns in equities for the most part, although clearly subject to other idiosyncratic risks.
For example, Greencoat UK Wind (UKW) invests in operating wind farms, receiving the income from the power generated and from subsidies. It targets an IRR of 8% to 9% per year on the assets it owns, net of expenses, which is attractive compared to the long term returns from the UK equity market. The current dividend yield on the share price is 5%, reflecting the 13.7% premium to NAV.
Should the trust do no more than generate a stable 5% dividend each year in the coming years, and capital values remain flat, this would in fact be in line with the return from the FTSE All Share over the past 20 years (as cited above).
In fact, UKW aims to deliver a dividend that rises in line with RPI, as well as maintaining the real value of the NAV over time - achieved by re-investing surplus cash-flows after dividends have been paid.
The current heady premium gives some cause for concern, but the underlying discount rate used to value its assets of 8.1% illustrates the strong returns it expects from it’s portfolio. As UKW has demonstrated, and we examine in detail in the recently updated profile, the strong and steady returns from its underlying assets has meant that it has outperformed the FTSE All Share since inception, with significantly less volatility.
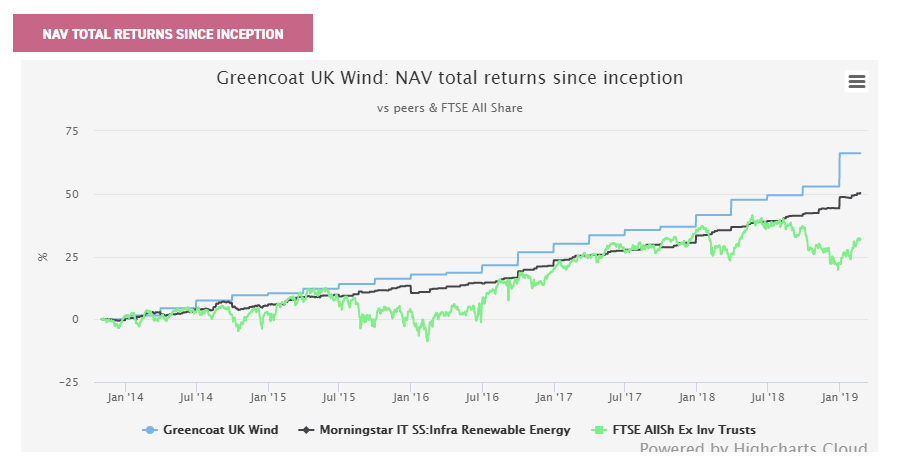
Source: Morningstar
The Renewable Infrastructure Group (TRIG) is another option in the renewables infrastructure space. It has a broader remit than UKW. Although its largest exposure is to wind power (83% of the portfolio), the trust can also invest in solar assets (17%) and battery storage (1%).
It also has a different financing structure, which means that its cash flow profile is slightly different.
UKW has all debt at the portfolio level, with roughly five years' average maturity. This means it has much higher free-cash flow and dividend cover, but means that it will need to roll the debt over at an uncertain future interest rate (refinancing risk), which will determine the cash available to pay dividends over the long term.
TRIG, by contrast, runs on a project finance basis, with debt amortised over the life of underlying projects, meaning there is no refinancing risk.
It has produced a strong and steady stream of dividends, and values its assets based on a discount rate of 7.6%, illustrating that similar to UKW, it expects to generate strong returns on its underlying assets.
TRIG has significantly more diversification – being exposed to four different electricity regimes / markets and two different generation technologies. The current dividend yield is 5.5% and the managers remain committed to growing the payout from its current level of 6.5p per share.
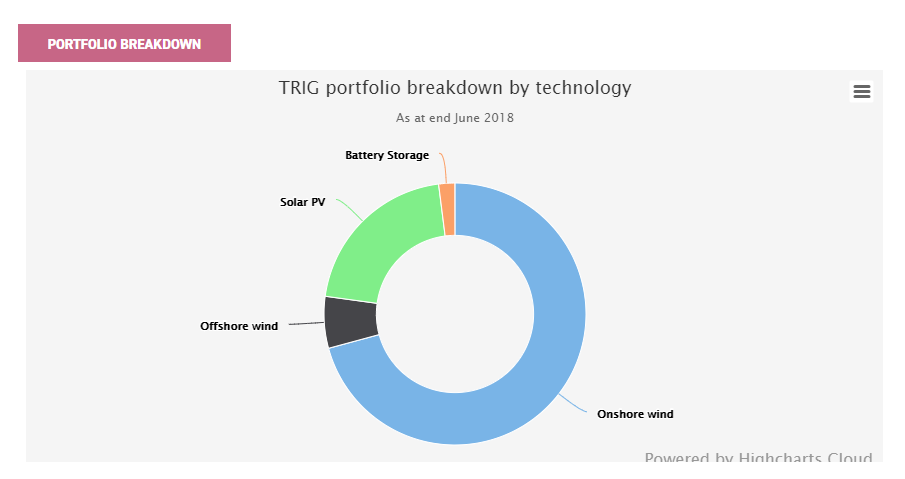
Source: InfraRed
HICL Infrastructure (HICL) offers exposure to more traditional infrastructure assets. It owns a portfolio split among PFI / PPP contracts, regulated assets, such as utilities, and demand-based assets such as toll roads.
The majority of the assets owned are schools, hospitals and roads, as well as HS1. These assets resemble annuities, as at the end of each contract's life there is a zero terminal value.
Therefore, the longevity of the assets owned by HICL is important. In our recent note on the trust we estimated the likely IRR of the trust if held to maturity to be 5.7%.
Again, this is attractive relative to equities and the returns should be more stable and less volatile. As UKW and TRIG do, HICL faces reinvestment risk.
When it comes to estimating expected future returns this has to be borne in mind: the companies own depreciating assets and have to reinvest in order to maintain their dividends.
Although renewables seem to have the wind behind them politically, over 20 years there are lots of unknowns, and the halt to future PFI contracts will limit future opportunities for HICL.
It is also true that long-term income yielding assets have seen their yields driven in since the GFC, significantly enhancing total returns, and should we see a shift to a rising interest rate regime in the UK, we might expect to see the opposite effect.
For long duration assets, we might see a headwind for capital values in the alternative income space, as we would in the mainstream fixed income markets.
Whether we see this shift or not, we think the chance of similar total returns to the past five years is fairly low, and the dividend yield is therefore perhaps a more conservative guide to where total returns will be in the short term.
However, the possibility of a de-rating is certainly a danger that should be borne in mind in the medium term, and as such, lower duration alternative income generating assets could be worth considering.
One alternative income fund with high return potential, but relatively low duration is SQN Secured Income (SSIF).
This trust has had a strategy overhaul under a new manager, Dawn Kendall, after SQN won the mandate in 2017. SQN Secured Income lends to small and mid-sized enterprises (SMEs), targeting a total return of 8% net of costs per annum with a dividend of 7%.
The loans generate 9-12% on a portfolio level, giving a decent cushion between the underlying returns and the targeted return to shareholders.
There is more credit risk in this portfolio and more exposure to the economic cycle than with the infrastructure funds, but its potential source of investments is wider, so it doesn’t share the same sort of reinvestment risk as infrastructure.
The trust lends at fixed rates, but for an average maturity length of 2.5 years, so the interest rate sensitivity is low, and a rising yield environment shouldn't affect capital values much. A 7% dividend yield would itself compare favourably to the track record of UK equities, even if the extra 1% of capital gains prove elusive.
One interesting trust to launch recently, which offers the potential for a lower volatility of returns and lower correlation to public equity markets with a decent return potential is M&G Credit Income (MGCI).
When fully invested, this trust targets a LIBOR plus 4% yield from investing in the private debt markets, which would put it close to the average equity return of 5% over the past 20 years (3 month sterling LIBOR is currently 0.86%).
The private debt market is an area usually reserved for the institutional investor; it includes direct loans to companies, such as those made by SSIF, but also project financing, private placements by large companies, leveraged loans, leasing and commercial mortgages amongst other sub-sectors.
Values should be less correlated to public markets, and investments made with a long-term investment horizon. As such, it is an interesting long-term diversifier to equities.
Although MGCI is not fully invested in the target assets yet, it could be one to tuck away for the long run. Like SSIF it should not be affected by a rising interest rate environment as much as the infrastructure funds thanks to the floating rate nature of much of the investments. In fact a rising rate environment would be good news for this trust in the long run as it should be able to lock in higher rates in long-term investments.
NB Global Floating Rate Income (LSE:NBLS) also generates a dividend which rises with interest rates and is currently yielding 4.5%. The floating rate loans in which it invests display low volatility in their capital values due to the fact that borrowers can refinance their loans, so if the value of the loan in the market rises above 100 they can pay it off (the amount they originally borrowed) and refinance at a lower rate.
It is therefore another whose capital value should be reasonably insulated from a rising interest rate environment, although in a serious blowout of yields there should likely be some impact on NAV from rising defaults.
The strategy involves taking on credit risk, so there is some limited correlation to equity markets, although it should still operate as a diversifier given the duration of just 0.37 years.
We believe the low volatility and low correlation of equities mean it could help improve risk-adjusted returns on a long-term portfolio. The volatility over the past five years has been just 4.8% according to Morningstar.
Conclusion
We believe that alternative income funds have a lot to offer the investor looking for long-term capital growth. For a start, the prospective returns on a number of sub-sectors are potentially quite favourable relative to the long-term returns generated by UK equities.
Equally as importantly, the trusts we have considered tend to display lower volatility than equities and combined with stocks tend to produce portfolios with more attractive risk-adjusted returns. Partly this low volatility of returns is linked to the steady solid income generated - even during bad years for equities.
As part of a total return / reinvestment strategy, this income could be reinvested into income assets or back into the equity market depending on the relative valuations. And we hope to have shown that by allocating to less volatile, alternative income assets, sequencing risk is greatly reduced, and therefore the possibility of a highly disappointing investment outcome over the long term is much diminished.
Kepler Partners is a third-party supplier and not part of interactive investor. Neither Kepler Partners or interactive investor will be responsible for any losses that may be incurred as a result of a trading idea.
Full performance can be found on the company or index summary page on the interactive investor website. Simply click on the company's or index name highlighted in the article.
Important Information
Kepler Partners is not authorised to make recommendations to Retail Clients. This report is based on factual information only, and is solely for information purposes only and any views contained in it must not be construed as investment or tax advice or a recommendation to buy, sell or take any action in relation to any investment.
This report has been issued by Kepler Partners LLP solely for information purposes only and the views contained in it must not be construed as investment or tax advice or a recommendation to buy, sell or take any action in relation to any investment. If you are unclear about any of the information on this website or its suitability for you, please contact your financial or tax adviser, or an independent financial or tax adviser before making any investment or financial decisions.
The information provided on this website is not intended for distribution to, or use by, any person or entity in any jurisdiction or country where such distribution or use would be contrary to law or regulation or which would subject Kepler Partners LLP to any registration requirement within such jurisdiction or country. Persons who access this information are required to inform themselves and to comply with any such restrictions. In particular, this website is exclusively for non-US Persons.
The information in this website is not for distribution to and does not constitute an offer to sell or the solicitation of any offer to buy any securities in the United States of America to or for the benefit of US Persons.
This is a marketing document, should be considered non-independent research and is subject to the rules in COBS 12.3 relating to such research. It has not been prepared in accordance with legal requirements designed to promote the independence of investment research.
No representation or warranty, express or implied, is given by any person as to the accuracy or completeness of the information and no responsibility or liability is accepted for the accuracy or sufficiency of any of the information, for any errors, omissions or misstatements, negligent or otherwise. Any views and opinions, whilst given in good faith, are subject to change without notice.
This is not an official confirmation of terms and is not to be taken as advice to take any action in relation to any investment mentioned herein. Any prices or quotations contained herein are indicative only.
Kepler Partners LLP (including its partners, employees and representatives) or a connected person may have positions in or options on the securities detailed in this report, and may buy, sell or offer to purchase or sell such securities from time to time, but will at all times be subject to restrictions imposed by the firm's internal rules. A copy of the firm's conflict of interest policy is available on request.
Past performance is not necessarily a guide to the future. The value of investments can fall as well as rise and you may get back less than you invested when you decide to sell your investments. It is strongly recommended that Independent financial advice should be taken before entering into any financial transaction.
PLEASE SEE ALSO OUR TERMS AND CONDITIONS
Kepler Partners LLP is a limited liability partnership registered in England and Wales at 9/10 Savile Row, London W1S 3PF with registered number OC334771.
Kepler Partners LLP is authorised and regulated by the Financial Conduct Authority.
Kepler Partners is a third-party supplier and not part of interactive investor. Neither Kepler Partners or interactive investor will be responsible for any losses that may be incurred as a result of a trading idea.
These articles are provided for information purposes only. Occasionally, an opinion about whether to buy or sell a specific investment may be provided by third parties. The content is not intended to be a personal recommendation to buy or sell any financial instrument or product, or to adopt any investment strategy as it is not provided based on an assessment of your investing knowledge and experience, your financial situation or your investment objectives. The value of your investments, and the income derived from them, may go down as well as up. You may not get back all the money that you invest. The investments referred to in this article may not be suitable for all investors, and if in doubt, an investor should seek advice from a qualified investment adviser.
Full performance can be found on the company or index summary page on the interactive investor website. Simply click on the company's or index name highlighted in the article.
Important Information
Kepler Partners is not authorised to make recommendations to Retail Clients. This report is based on factual information only, and is solely for information purposes only and any views contained in it must not be construed as investment or tax advice or a recommendation to buy, sell or take any action in relation to any investment.
This report has been issued by Kepler Partners LLP solely for information purposes only and the views contained in it must not be construed as investment or tax advice or a recommendation to buy, sell or take any action in relation to any investment. If you are unclear about any of the information on this website or its suitability for you, please contact your financial or tax adviser, or an independent financial or tax adviser before making any investment or financial decisions.
The information provided on this website is not intended for distribution to, or use by, any person or entity in any jurisdiction or country where such distribution or use would be contrary to law or regulation or which would subject Kepler Partners LLP to any registration requirement within such jurisdiction or country. Persons who access this information are required to inform themselves and to comply with any such restrictions. In particular, this website is exclusively for non-US Persons. The information in this website is not for distribution to and does not constitute an offer to sell or the solicitation of any offer to buy any securities in the United States of America to or for the benefit of US Persons.
This is a marketing document, should be considered non-independent research and is subject to the rules in COBS 12.3 relating to such research. It has not been prepared in accordance with legal requirements designed to promote the independence of investment research.
No representation or warranty, express or implied, is given by any person as to the accuracy or completeness of the information and no responsibility or liability is accepted for the accuracy or sufficiency of any of the information, for any errors, omissions or misstatements, negligent or otherwise. Any views and opinions, whilst given in good faith, are subject to change without notice.
This is not an official confirmation of terms and is not to be taken as advice to take any action in relation to any investment mentioned herein. Any prices or quotations contained herein are indicative only.
Kepler Partners LLP (including its partners, employees and representatives) or a connected person may have positions in or options on the securities detailed in this report, and may buy, sell or offer to purchase or sell such securities from time to time, but will at all times be subject to restrictions imposed by the firm's internal rules. A copy of the firm's conflict of interest policy is available on request.
Past performance is not necessarily a guide to the future. The value of investments can fall as well as rise and you may get back less than you invested when you decide to sell your investments. It is strongly recommended that Independent financial advice should be taken before entering into any financial transaction.
PLEASE SEE ALSO OUR TERMS AND CONDITIONS
Kepler Partners LLP is a limited liability partnership registered in England and Wales at 9/10 Savile Row, London W1S 3PF with registered number OC334771.
Kepler Partners LLP is authorised and regulated by the Financial Conduct Authority.
These articles are provided for information purposes only. Occasionally, an opinion about whether to buy or sell a specific investment may be provided by third parties. The content is not intended to be a personal recommendation to buy or sell any financial instrument or product, or to adopt any investment strategy as it is not provided based on an assessment of your investing knowledge and experience, your financial situation or your investment objectives. The value of your investments, and the income derived from them, may go down as well as up. You may not get back all the money that you invest. The investments referred to in this article may not be suitable for all investors, and if in doubt, an investor should seek advice from a qualified investment adviser.
Full performance can be found on the company or index summary page on the interactive investor website. Simply click on the company's or index name highlighted in the article.