ii Private Investor Performance Index: Q3 2022
17th October 2022 09:43
by Jemma Jackson from interactive investor
Nowhere to hide: tumultuous year to date sets the clock back, but two-year data remains positive.

- ii customer performance data now goes back almost three years (to January 2020), with the average customer up 0.38% in median terms and the average IA Mixed Investment 40-85% Shares sector up 0.85% to end September 2022
- Two-year returns remain strong: ii customers up 9.31% and IA Mixed Investment 40-85% Shares sector up 2.38%, as volatility in the bonds sector erodes gains for multi-asset managers
- Older generations performing best over two years, boosted by more FTSE 100 blue chips
- Wealthiest customer portfolios see strongest growth since ii started tracking performance from 1 January 2020
- Youngest customers hold on to their winning streak over ii’s longest time frame
Today, interactive investor, the UK’s second-largest investment platform for private investors, publishes its Q3 Private Investor Performance Index to 30 September 2022.
With data now going back almost three years (1 January 2020 – 30 September 2022), the latest figures underscore the extraordinary headwinds facing both private and professional investors through this period in time.
Richard Wilson, CEO, interactive investor, says: “This performance index is a barometer of how private investors are faring, and it won’t always make comfortable reading. It certainly isn’t easy to report, and it comes at a time when many people are struggling. It is, though, a timely illustration of the periods of volatility that have punctuated the stock market's underlying long-term growth.
“While some periods of market turbulence have been longer than others, history has shown that they are temporary. Investing needs to be a long-term habit but that doesn’t make navigating the short-term storm any easier. Our expert insights are there to help you, but either way trying to time the market is a mug’s game. That is why we have been providing free regular investing for all UK products since January 2020. For those who want to remove at least some of the risk of market timing, this is a really valuable service at a time of unprecedented uncertainty.”
Back to square one?
Looking back to 1 January 2020 (when ii started collating performance data), the market falls over the year to date have eroded hard-won gains. These are the gains made by those who held firm through the dark days of the pandemic, and the subsequent rally that followed ‘Pfizer day’ on 9 November 2020.
Indeed, during this two- and three-quarter year period to end September 2022, the average ii customer is up just 0.38%, in line with the FTSE 100 (up 0.34%) and not far behind the IA Mixed Investment 40-85% shares sector (up 0.85%). The IA Mixed Investment 40-85% shares sector is a useful comparison because it reflects a mix of equities and bond fund exposure, not to mention cash, that ii customers will have, on average, in their portfolio.
With nowhere to hide, the IA Global Mixed Bond sector was no place of relative refuge over the period, down -2.5%, reflecting the chaos in money markets.
During this period, it is ii’s youngest customers who have produced the best returns, with the 18-24 year old and 25-34 year old cohorts each up 4%. It’s The 18-24 year old cohort have a bias to investment trusts (average portfolio exposure is 29% versus an overall average of 21%), but the 25-34 year old cohort have lower than average investment trust exposure (18%).
ii’s wealthiest customers, with portfolios of £1million-plus, fared even better, and were up an average of 5.78% between 1 January 2020-30 September 2022. Over the past two years, they have also made the most gains, and are up 10.7% - more than 1 percentage point higher than the average ii customer. They are also down the least over the past year, six months and the past quarter 3, although only marginally.
The very wealthiest customers seem to have a higher exposure to exchange-traded products (10%, versus an overall average of 7%).
Not all doom and gloom
Over the past two years, private investors are still managing to sit on healthy gains in median terms, with the average ii customer up 9.31%, generally in line with the FTSE World (up 9.67%), and behind the FTSE 100 (up 12.47%).
With the FTSE 100 up so strongly, it is perhaps not surprising to see that it was ii’s older, 65+ cohort who produced the strongest gains over the past two years, up 10.85%. These customers have by far the highest exposure to direct equities (42% compared to an overall average of 37%), with a greater emphasis on FTSE 100 blue chips. The FTSE 100 has outperformed world markets over the past two years, although over the longer term, the reverse is true.
The IA Mixed Investments 40-85% Shares sector is up 2.38% over the past two years, and is likely lagging the other indices due to the significant falls in the bonds market.
Customer performance in detail compared to indices to end September 2022
Jan 2020 to September 2022 | 2 Years | 1 Year | 9 Months | 6 Months | 3 Months | |
Index Name | 01/01/2020 - 30/09/2022 | 01/10/2020 - 30/09/2022 | 01/10/2021 - 30/09/2022 | 01/01/2022 - 30/09/2022 | 01/04/2022 - 30/09/2022 | 01/07/2022 - 30/09/2022 |
IA Mixed Investment 40-85% Shares | 0.85 | 2.38 | -10.23 | -12.76 | -9.39 | -2.02 |
FTSE 100 | 0.34 | 12.47 | 0.90 | -3.66 | -6.36 | -2.72 |
FTSE World | 8.40 | 9.67 | -3.01 | -9.28 | -7.42 | 1.82 |
S&P 500 | 12.33 | 12.81 | 2.10 | -7.63 | -5.87 | 3.48 |
FTSE All Share | -0.62 | 10.81 | -4.00 | -7.87 | -8.31 | -3.45 |
NASDAQ Composite | 13.86 | 5.48 | -10.93 | -17.49 | -11.92 | 4.54 |
IA Global Mixed Bond | -2.5 | -5.5 | -10.5 | -9.8 | -5.7 | -1.2 |
Average ii customer | 0.38 | 9.31 | -10.24 | -12.95 | -9.86 | -1.77 |
Average female ii customer | 0.80% | 9.46% | -9.41% | -12.36% | -9.51% | -1.75% |
Average male ii customer | -0.01% | 9.31% | -10.68% | -13.25% | -10.08% | -1.83% |
Average ii customer 18 - 24 | 4.00% | 6.48% | -11.56% | -14.59% | -9.38% | 0.00% |
Average ii customer 25 - 34 | 4.08% | 7.19% | -10.89% | -13.54% | -9.60% | -0.39% |
Average ii customer 35 - 44 | 3.51% | 7.60% | -10.01% | -12.76% | -9.43% | -0.49% |
Average ii customer 45 - 54 | 1.70% | 8.25% | -10.75% | -13.22% | -9.79% | -1.12% |
Average ii customer 55 - 64 | 0.01% | 8.56% | -10.76% | -13.26% | -9.95% | -1.85% |
Average ii customer 65+ | -0.65% | 10.85% | -9.66% | -12.61% | -10.02% | -2.56% |
Average very wealthy customer £1m+ | 5.78% | 10.70% | -10.00% | -12.95% | -9.71% | -1.01% |
Source: Morningstar Total Returns (GBP) to 30/09/2022, expect for ii customer data, which is Source: ii (also total return to end September 2022). Past performance is no guide to future performance. | ||||||
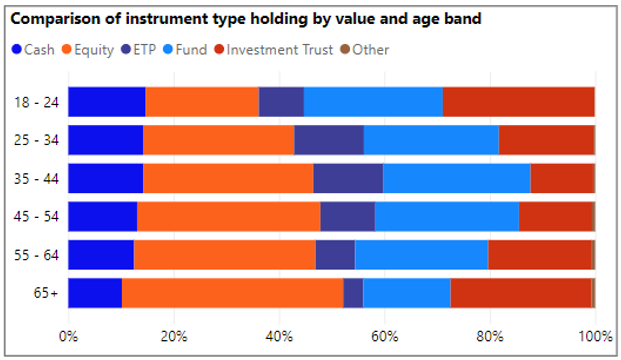
Average asset split by age
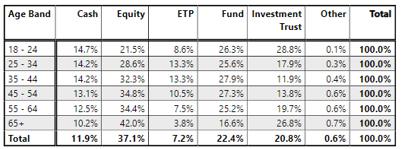
Portfolio values under £20,000 were stripped out to keep the sample representative of ii’s core customer base. To view full methodology, see notes to editors.
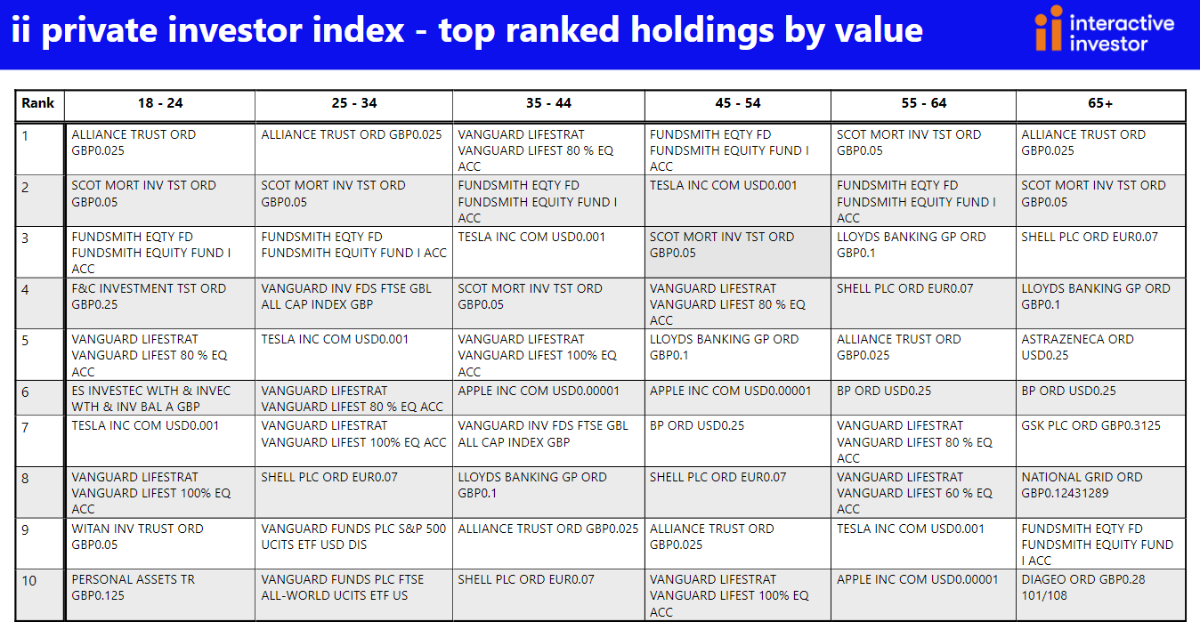
To have and to hold
What is perhaps striking is the relative absence of so-called FAANG stocks in the top holdings in Q3, across the age ranges. Tesla Inc (NASDAQ:TSLA) is the only such holding in the 18-24 and 25-34 age cohorts, with investment trust stalwarts such as Personal Assets Ord (LSE:PNL), Witan Ord (LSE:WTAN), F&C Investment Trust Ord (LSE:FCIT), Scottish Mortgage Ord (LSE:SMT) and (at the top of the Table) Alliance Trust Ord (LSE:ATST) dominating. That’s along with the usual fund suspects - Fundsmith Equity and various Vanguard Lifestrategy ranges.
Vanguard funds make up half of the most-held stocks in the 25-34 age range, again with the household names such as Fundsmith Equity, Scottish Mortgage and Alliance Trust.
Along with popular trust and fund names, Apple Inc (NASDAQ:AAPL) peppers the portfolios of investors in the 35-44, 45-54 and 55-64 age ranges, together with several higher yielding FTSE 100 blue chips, which become more dominant in customer portfolios with age.
The only age cohort who don’t have Vanguard among the top 10 average holdings is the 65+ category.
Kyle Caldwell, Collectives Editor, interactive investor, says: “Time and again, it tends to be the investment trusts and funds with the clearest strategies that continue to dominate portfolios, even down to our youngest customers. Often, these are investments that are passed down through generations – and possibly also passed down in the form of shared knowledge – and they continue to power portfolios. This is a true case of survival of the fittest.”
Richard Hunter, Head of Markets, interactive investor, says: “Many of the most-held FTSE 100 stocks are particularly held dear by some of our older customers, and at a time when share prices have been feeling the heat, those yields can give at least some comfort.
“This year has thrown out some stocks which have provided both capital growth and income amid a fairly tumultuous investment environment. For example, Shell (LSE:SHEL) is currently yielding 3.8%, and in addition the share price has risen by 43% in the year to date at time of writing (14 October). There are other similar success stories within the FTSE 100, such as BP (LSE:BP.) (yield 4.3%, share price up 40% year to date at time of writing, although past performance is no guide to the future).
“There will be instances for individuals where a change of strategy will be required, such as in retirement where there may be more of a need for (dividend) income to boost the individual’s overall earnings.
“While no dividend is ever guaranteed (exemplified by the reduction or non-payment of many dividends temporarily during the pandemic, for example), in normal circumstances the benefits of reinvesting dividends over time continues to shine through. And as the old adage goes: time in the market beats timing in the market.”
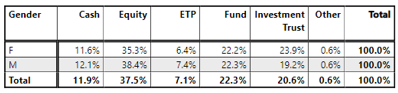
Average asset split by asset band
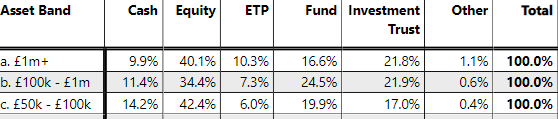
Portfolio values under £20,000 were stripped out to keep the sample representative of ii’s core customer base. To view full methodology, see notes to editors.
Performance remains close between the genders
ii’s quarterly performance data has consistently demonstrated little difference between male and female private investor performance. Women have outperformed men by almost 1 percentage point between 1 January 2020 – 30 September 2022 (up 0.8% compared to -0.01% for men). Men are down by more than 1 percentage point compared to women over the past year (-10.68 versus -9.41% for women). Men are also down by more than half a percentage point than women over the past 6 months.
Female customers have a greater preference for investment trusts, and men a slightly higher preference for direct equities, but portfolios are broadly similar.
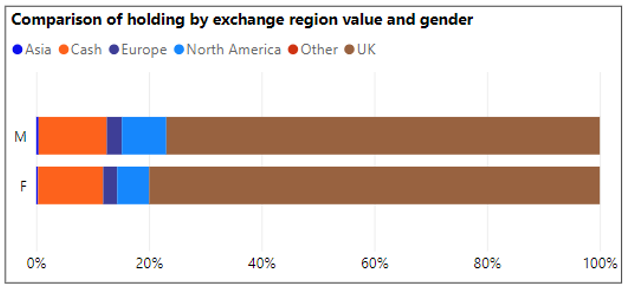
Interestingly, when it comes to direct equity exposure, men have slightly higher exposure to North America than women (8% versus 6%).
Average asset split by gender
These articles are provided for information purposes only. Occasionally, an opinion about whether to buy or sell a specific investment may be provided by third parties. The content is not intended to be a personal recommendation to buy or sell any financial instrument or product, or to adopt any investment strategy as it is not provided based on an assessment of your investing knowledge and experience, your financial situation or your investment objectives. The value of your investments, and the income derived from them, may go down as well as up. You may not get back all the money that you invest. The investments referred to in this article may not be suitable for all investors, and if in doubt, an investor should seek advice from a qualified investment adviser.
Full performance can be found on the company or index summary page on the interactive investor website. Simply click on the company's or index name highlighted in the article.