ii Investment Outlook: Q1 2019
We look at performance of the major asset classes and discuss the outlook for the months ahead.
30th April 2019 09:30
by Lee Wild from interactive investor
Each quarter, interactive investor analyses performance of the major asset classes and discusses the outlook for the months ahead.

Market round-up
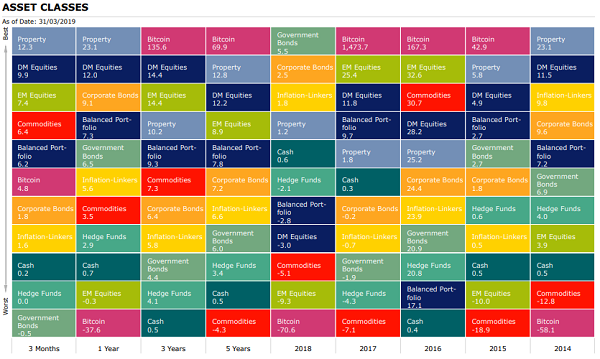
After one of the worst fourth-quarters in living memory, global equities, corporate bonds and commodities have had an astonishing start to 2019, ranking as one of the best on record.
Asset buying began straight after the Christmas break and has continued into the second-quarter, driven largely by accommodating central banks, easing of monetary policy and less disruptive trade policies. UK stocks also became more attractive once the threat of a hard Brexit was removed, helping the FTSE 100 rise 9% during the period.
While there were casualties during the results reporting season, including well-known names like Thomas Cook (LSE:TCG), easyJet (LSE:EZJ), Saga (LSE:SAGA), Sainsbury (J) (LSE:SBRY) and Metro Bank (LSE:MTRO), the overriding tone was positive. Investors have also brushed off some weaker economic data out of the US and Europe especially. A trend capable of triggering an end to this economic cycle is yet to be established.
The scale of recovery during the first-quarter is all the more remarkable given the number of headwinds facing financial markets, any one of which had the potential to drive them much lower; think the US-China trade war, US government shutdown and so-called 'yield curve inversion' in the bond market, which has traditionally been a precursor to recession.
Source: Morningstar Total returns in sterling
Shares
US equities generated their highest first-quarter return since 1998 amid easing global trade tensions and accommodative central bank policies. European equities also rose as the European Central Bank (ECB) said they would restart the bank's stimulus program in response to weakening economic data.
UK equities performed well despite Brexit uncertainty, as the 29 March deadline for Britain's departure from the European Union passed and a no-deal Brexit, regarded by many as hugely detrimental to the country's economic well-being, was avoided.
Emerging markets rallied, led by China following the easing of the US–China trade dispute, support from the local government in the form of tax cuts, and the announcement that index compiler MSCI would begin including China A-shares within relevant indices.
| Performance | ||||
|---|---|---|---|---|
| Index | Q1 (%) | 1 Year | 3 Years | 5 Years |
| China* | 15.03 | 0.95 | 19.81 | 14.95 |
| S&P 500 | 11.08 | 17.88 | 17.28 | 16.51 |
| Russia* | 9.98 | 9.98 | 20.15 | 8.79 |
| FTSE 250 | 9.75 | 0.97 | 7.03 | 6.11 |
| FTSE 100 | 9.49 | 7.69 | 10 | 6.05 |
| FTSE All Share | 9.41 | 6.36 | 9.51 | 6.1 |
| Asia Pac Ex-Japan* | 8.94 | 3.89 | 14.95 | 10.62 |
| Europe Ex-UK* | 7.95 | 2.17 | 10.2 | 6.29 |
| Emerging Market* | 7.43 | -0.32 | 14.36 | 8.92 |
| FTSE Small Cap | 6.24 | 1 | 9.6 | 7.12 |
| Brazil* | 5.70 | 3.1 | 23.99 | 6.85 |
| India* | 4.74 | 14.93 | 15.4 | 13.32 |
| TOPIX Japan | 4.38 | -1.77 | 12.23 | 11.85 |
Source: Morningstar *MSCI Total returns in sterling
Sectors
Growth stocks delivered strongest returns during the first quarter, led by the information technology sector. Healthcare and financials sectors were laggards.
| Performance | ||||
|---|---|---|---|---|
| Q1 (%) | 1 Year | 3 Years | 5 Years | |
| Information Technology | 16.87 | 21.25 | 25.16 | 22.35 |
| Real Estate | 13.4 | 21.59 | 10.47 | 12.95 |
| Energy | 11.86 | 9.62 | 10.32 | 1.89 |
| Industrials | 11.80 | 6.98 | 13.79 | 11.74 |
| Consumer Discretionary | 9.64 | 12.09 | 14.54 | 14.16 |
| Materials | 9.51 | 4.96 | 15.78 | 8.24 |
| Consumer Staples | 9.46 | 14.43 | 8.1 | 11.7 |
| Comm Services | 9.01 | 14.75 | 5.02 | 7.85 |
| Utilities | 7.53 | 22.88 | 11.14 | 11.4 |
| Financials | 5.96 | -1.18 | 13.51 | 9.5 |
| Health Care | 5.69 | 20.83 | 13.57 | 13.51 |
Source: Morningstar Total returns in sterling
Bonds
Government and corporate bonds advanced as the US Federal Reserve and the ECB signalled that interest rates will likely remain low for longer, given disappointing economic data and low inflation in several key regions.
Corporate bonds outperformed government bonds during the period. High-yield corporate bonds, in particular, have had their strongest quarter for a number of years.
| Performance | ||||
|---|---|---|---|---|
| Q1 (%) | 1 Year | 3 Years | 5 Years | |
| UK Corporate | 4.18 | 3.74 | 4.73 | 5.5 |
| Global High Yield | 4.10 | 11.07 | 11.38 | 9.17 |
| UK Gilts | 3.38 | 3.71 | 3.57 | 5.49 |
| Global Corporate | 1.77 | 9.06 | 6.45 | 7.21 |
| Global Inflation Linked | 1.55 | 5.57 | 5.82 | 6.59 |
| Global Aggregate | -0.11 | 7.25 | 4.86 | 6.14 |
| Global Government | -0.52 | 6.48 | 4.38 | 6.01 |
| European Corporate | -0.89 | 0.56 | 5.05 | 3.65 |
Source: Morningstar Total returns in sterling
Commodities and Alternative investments
The price of oil surged more than 30% in dollar terms over the three months, the largest quarterly advance since 2009. US sanctions against Iran and Venezuela, as well as OPEC-led supply cuts, boosted prices.
A barrel of Brent crude increased from less than $54 at the end of 2018 to almost $69 at the end of the first quarter.
On the metals exchanges, the prices of iron ore, nickel and zinc were all up over 20% during the quarter to multi-year highs. Vale (NYSE:VALE), the world's largest iron ore miner, shut down production at a number of sites following a mining-waste dam disaster in which hundreds died.
| Performance | ||||
|---|---|---|---|---|
| Q1 (%) | 1 Year | 3 Years | 5 Years | |
| Brent Crude Oil | 24.25 | 4.77 | 23.96 | -3.88 |
| Global REITs | 12.26 | 23.09 | 10.22 | 12.79 |
| Global Infrastructure | 11.48 | 17.61 | 12.27 | 10.77 |
| UK REITs | 11.29 | 0.61 | 2.35 | 4.92 |
| Global Natural Resources | 9.85 | 7.56 | 17.19 | 6.97 |
| Commodities | 6.39 | 3.49 | 7.27 | -4.3 |
| Cash | 0.18 | 0.65 | 0.45 | 0.48 |
| Hedge Funds | -0.55 | 8.58 | 7.79 | 9.15 |
| Gold | -1.54 | 4.99 | 4.9 | 5.01 |
| CBOE Market Volatility (VIX) | -47.29 | -26.09 | 2.73 | 4.79 |
Source: Morningstar Total returns in sterling
ii Super 60 fund selections
Super 60 funds continue to perform in line with expectations both in absolute and relative terms. Performance over longer time periods is very strong. All funds delivered a positive return year-to-date apart from the iShares Physical Gold exchange-traded commodity (ETC) (LSE:SGLN).
In Q1, Fidelity China Special Situations (LSE:FCSS) was the best-performing fund, up 21%, with good performance also coming from Fundsmith Equity, Baillie Gifford Shin Nippon (LSE:BGS) andiShares Core MSCI World ETF (LSE:IWDG). iShares Physical Gold ETC was the lowest returning fund over the quarter.
The top performer over five years is Baillie Gifford Shin Nippon, which returned 24.5% annualised. Other funds which posted strong performance over the same period include Legg Mason IF Japan Equity, Fundsmith Equity, Scottish Mortgage (LSE:SMT) and Fidelity China Special (LSE:FCSS).
It should be noted that looking at performance numbers from just one quarter is really just a snapshot. It is essential to consider these figures in the context of investing with long-term goals in mind.
Top five ii Super 60 funds in Q1
| Return: Q1 (%) | Return: 1 Year | Return: 3 Years | Return: 5 Years | |
|---|---|---|---|---|
| Fidelity China Special Situations | 21.00 | -5.06 | 17.15 | 18.49 |
| Fundsmith Equity | 14.94 | 23.34 | 19.91 | 21.11 |
| Baillie Gifford Shin Nippon | 12.43 | -2.11 | 20.97 | 24.53 |
| Artemis US Smaller Companies | 12.21 | 22.09 | 21.69 | — |
| Scottish Mortgage | 11.76 | 14.1 | 25.07 | 20.05 |
Bottom five ii Super 60 funds in Q1
| Return: Q1 (%) | Return: 1 Year | Return: 3 Years | Return: 5 Years | |
|---|---|---|---|---|
| Vanguard Global Bond Index | 2.77 | 3.23 | 1.61 | 3.01 |
| Marlborough Global Bond | 1.49 | 4.41 | 5.75 | 6.34 |
| F&C Commercial Property | 1.07 | 3.50 | 6.08 | 10.30 |
| M&G Global Macro Bond | 0.61 | 7.32 | 5.66 | 6.15 |
| iShares Physical Gold ETC | -1.27 | 5.08 | 4.66 | 4.85 |
Source: Morningstar Total returns in sterling
Most-traded funds on the ii platform in Q1
| Most-bought | Most-sold | |
|---|---|---|
| Fundsmith Equity | Fundsmith Equity | |
| Vanguard LifeStrategy 80% Equity | Woodford Equity Income | |
| Lindsell Train UK Equity | Jupiter India | |
| Vanguard LifeStrategy 60% | Legg Mason IF Japan Equity | |
| Baillie Gifford Global Discovery | Artemis Global Income |
Source: interactive investor
Changes to the ii Super 60 list (under review/developments)
No changes were made to the interactive investor Super 60 list of investments during the first quarter of 2019.
These articles are provided for information purposes only. Occasionally, an opinion about whether to buy or sell a specific investment may be provided by third parties. The content is not intended to be a personal recommendation to buy or sell any financial instrument or product, or to adopt any investment strategy as it is not provided based on an assessment of your investing knowledge and experience, your financial situation or your investment objectives. The value of your investments, and the income derived from them, may go down as well as up. You may not get back all the money that you invest. The investments referred to in this article may not be suitable for all investors, and if in doubt, an investor should seek advice from a qualified investment adviser.
Full performance can be found on the company or index summary page on the interactive investor website. Simply click on the company's or index name highlighted in the article.