An investment trust sector that promises healthy returns
14th April 2022 14:01
Biotechnology has been suffering amid a style rotation but, given ageing populations and rising wealth, Kepler analysts are optimistic about long-term growth prospects.

This content is provided by Kepler Trust Intelligence, an investment trust focused website for private and professional investors. Kepler Trust Intelligence is a third-party supplier and not part of interactive investor. It is provided for information only and does not constitute a personal recommendation.
Material produced by Kepler Trust Intelligence should be considered a marketing communication, and is not independent research.
Thematic investing is an alluring concept to many long-term investors. Investors need only to be sure of a theme and then pick their moment (or average in) and let compounding do its thing. The best themes for long term investors should have a degree of permanence and ubiquity, offering a strong, sustained tailwind to returns.
Of course, investing in a theme through single stocks exposes investors to specific risks that an individual company may or may not be able to capture the benefits of the theme or that management score an own goal despite the secular growth opportunity. That said, it is also rare for a single company to be able to retain its competitive advantage over many years, with innovation and disruption from competitors potentially eroding the investment case for any particular stock. Therefore, in investing in single stocks to express a theme, one has to be very lucky or chop and change over time as the competitive environment changes.
As the 18th-century actor Christopher Bullock has been quoted, “’Tis impossible to be sure of any thing but Death and Taxes” (The Cobbler of Preston, 1716). Selling shares to recycle capital within a theme potentially exposes investors to one of life’s inevitabilities – tax. Investing in a fund or investment trust exposed to a theme gives the best of both worlds – an actively managed and diversified exposure to the theme, as well as deferment of capital gains tax until the share or unit is sold. Between then, changes within the fund or trust’s portfolio are free of tax. In this way, investment trusts help with the deferral of capital gains taxes, but it would be a bold claim that they can help with the deferral of the other of life’s inevitabilities. That said, several trusts do seek to benefit from humanity’s propensity to spend in an attempt to defer death (and other, more minor ailments) and from our ingenuity and innovation in developing solutions to health issues.
The US is the largest healthcare market in the world, which is part of the reason that many of the most innovative companies are listed on US equity markets. However, looking back over the past sixty years or so, the absolute level of spending on healthcare has been increasing at a staggering annual rate, which we show in the graph below. Compounding the growth shows US healthcare spending has risen by a phenomenal 137x over six decades. Of course, this is in absolute terms and not in real (inflation-adjusted terms), but it does illustrate what a strong and consistent pattern has been established.
US EXPENDITURE ON HEALTHCARE
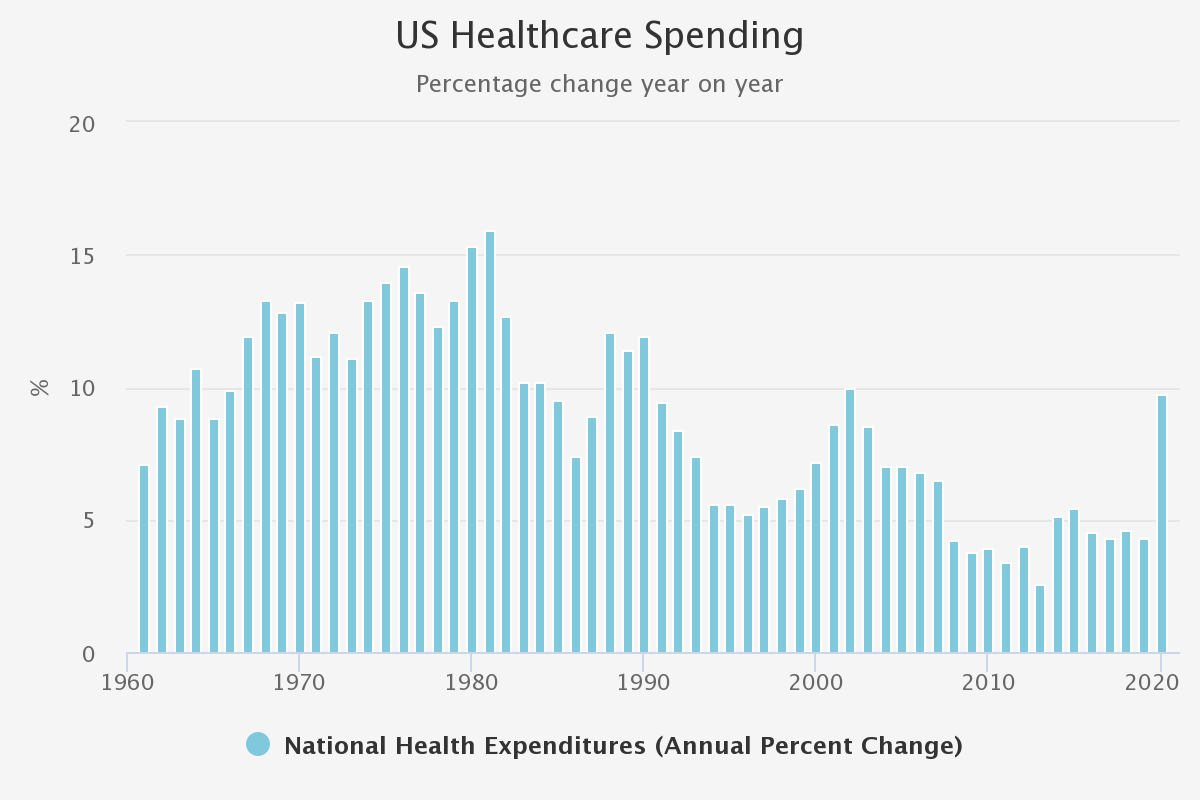
Source: Centers for Medicare & Medicaid Services. Past performance is not a reliable indicator of future results
It is not just the US that has seen significant growth, but most developed economies find that they are spending an increasing amount on healthcare each year in real terms, but also as a proportion of their economies (as measured by GDP). According to the World Health Organisation (WHO), “Global spending on health more than doubled in real terms over the past two decades, reaching $ 8.5 trillion in 2019, or 9.8% of global GDP”. High-income countries account for approximately 80% of spending. Among the 29 countries that the WHO classifies as “high income” since 2000, health spending per capita averaged $ 4,491 and accounted for 9% of GDP in 2019, up from $ 2,923 in real terms and 7% in 2000.
The WHO report (Global Expenditure on Health - Public Spending on the Rise (2021)) found that there is a strong correlation between income level and health spending. This means that high-income countries spend the most (proportionately to their GDP) on health. In our view, this has two implications for investors. Firstly, to access the best opportunities today, healthcare companies do not have to risk the political and operational issues they might face in emerging markets. Secondly, as emerging markets become richer (assuming they follow developed market patterns), there will be a significant accelerator effect from EM GDP growth, and over the long term, an increasing proportion of that GDP will likely be spent on healthcare. In our view, this should give investors’ confidence that the healthcare investment runway remains long.
HEALTH SPENDING AS A PERCENTAGE OF GDP
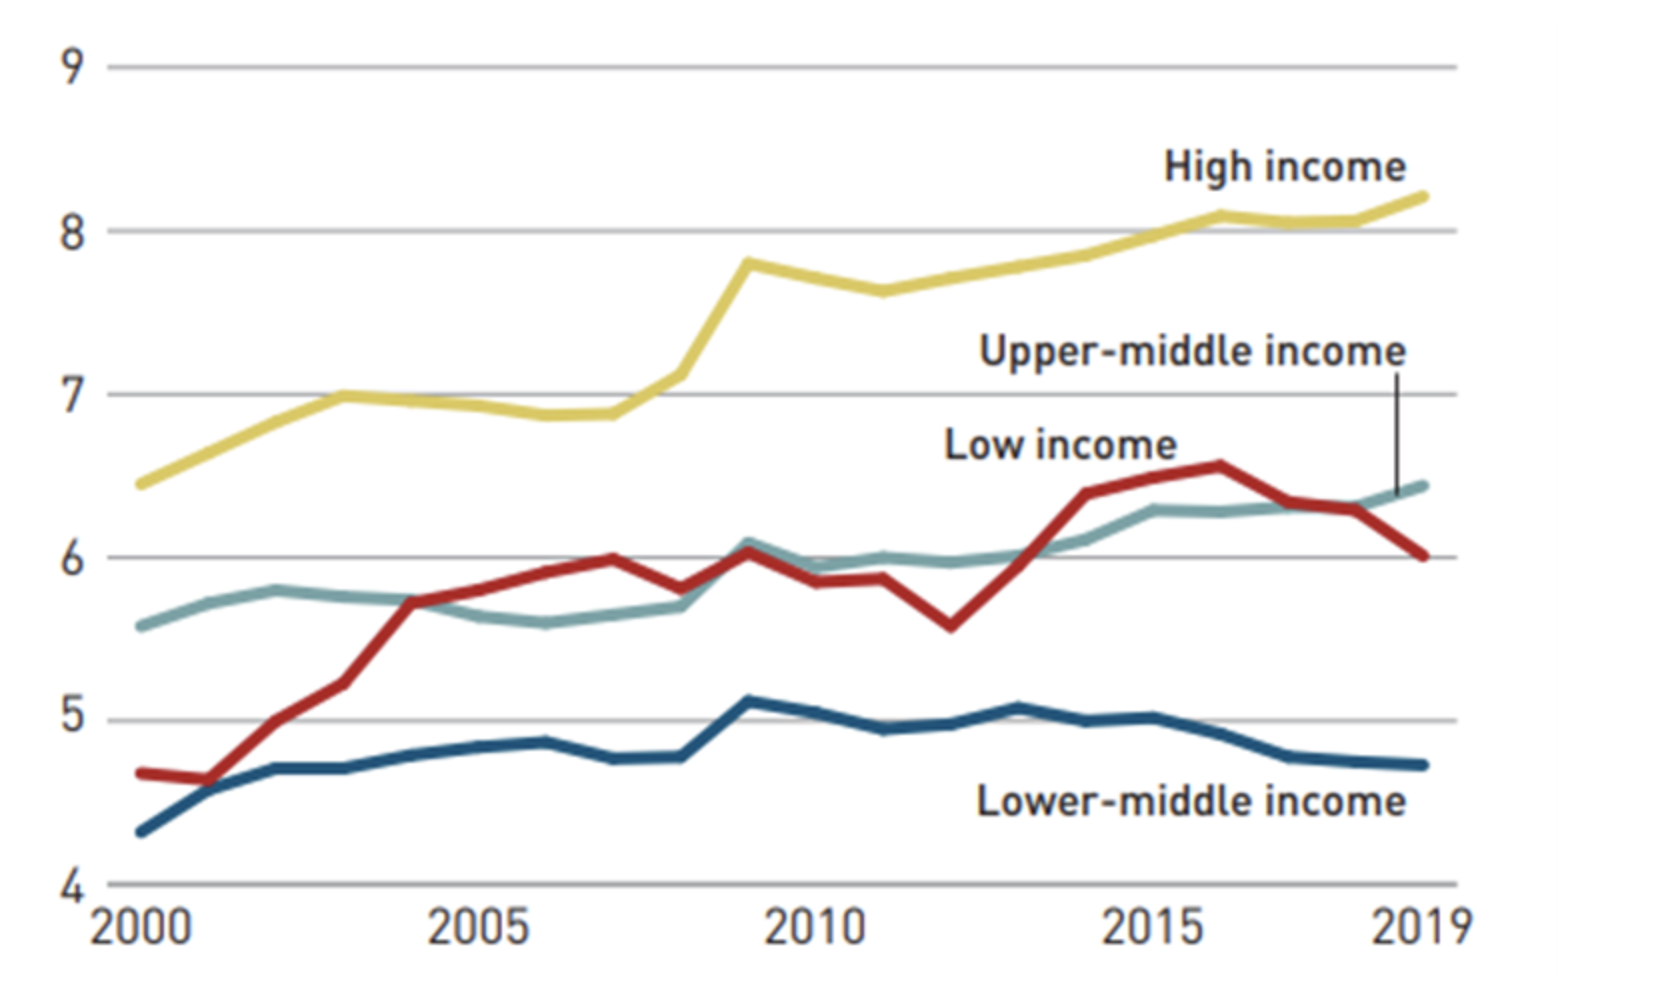
Source: WHO Global Health Expenditure Database, 2021. Past performance is not a reliable indicator of future results.
Healthcare spending also appears to be relatively defensive. The WHO report found that between 2000 and 2019, average health spending per capita in the 29 high-income countries rose 57%, much faster than the 21% average GDP growth in these countries. Average health spending as a share of GDP trended upwards, from 7.1% to 9.0%. A particularly sharp jump in health spending as a share of GDP was observed during the global financial crisis and its aftermath when the average growth rates of health spending and GDP diverged. In 13 of the 29 countries, annual growth in health spending was two to three times the growth in GDP. In 4 countries, growth in health spending was more than triple the speed of economic growth.
All of this has resulted in a hefty tailwind for those investors who have been exposed to the Healthcare and Biotechnology indices over the last fifteen years (a period that includes the 2008 global financial crisis), as we show in the graph below.
HEALTHCARE AND BIOTECHNOLOGY EQUITY INDICES VS WORLD EQUITIES
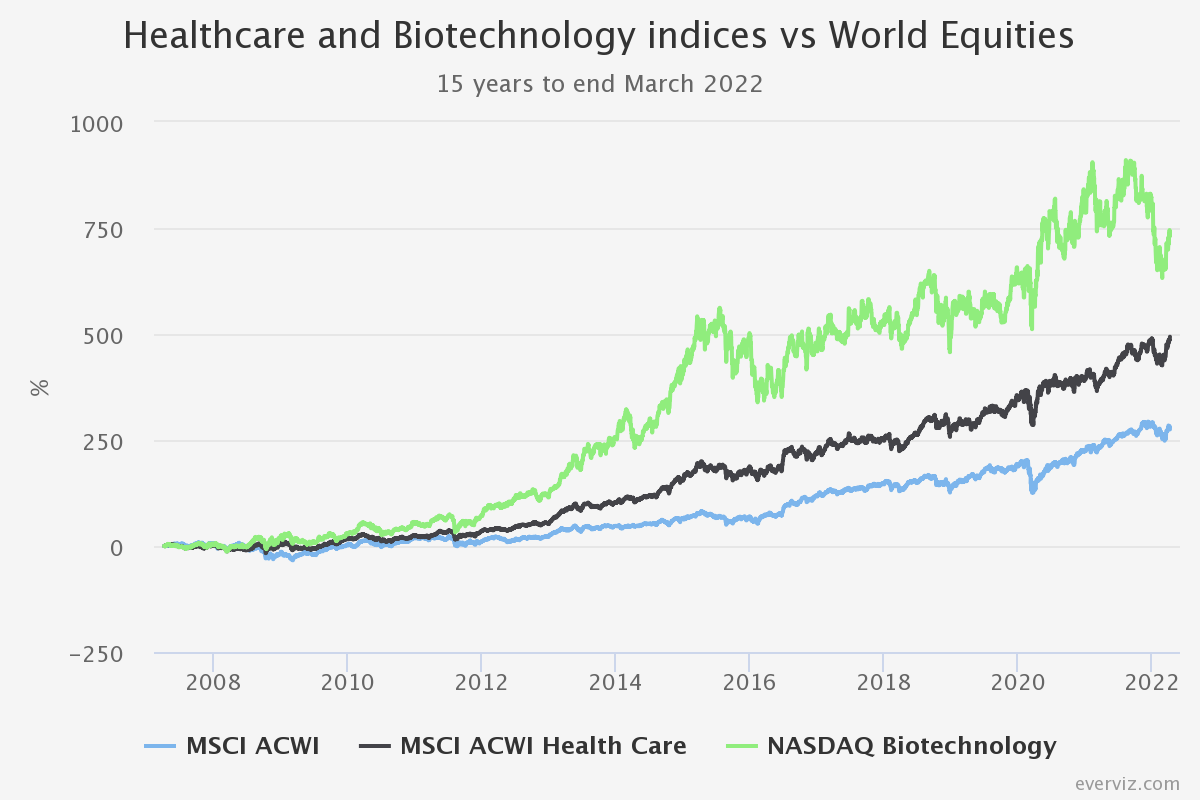
Source: Morningstar. Past performance is not a reliable indicator of future results.
Drilling down into the detail, we show below relative performance that has evolved over the same period in the graph below. A period of an upward sloping line denotes a period of outperformance and downward underperformance. Healthcare and biotechnology indices have been on a broadly upward trend of outperformance. That said, we can see that Biotechnology’s outperformance largely stalled in early 2015 following Hillary Clinton’s tweet during the presidential election promising to “take on” price gouging in the speciality drug market. At the same time, healthcare indices have been on a steadily upward trajectory of outperformance over the last decade. Both indices have little further progress on the absolute level of outperformance since the onset of the Covid-19 pandemic.
15-YEAR RELATIVE PERFORMANCE
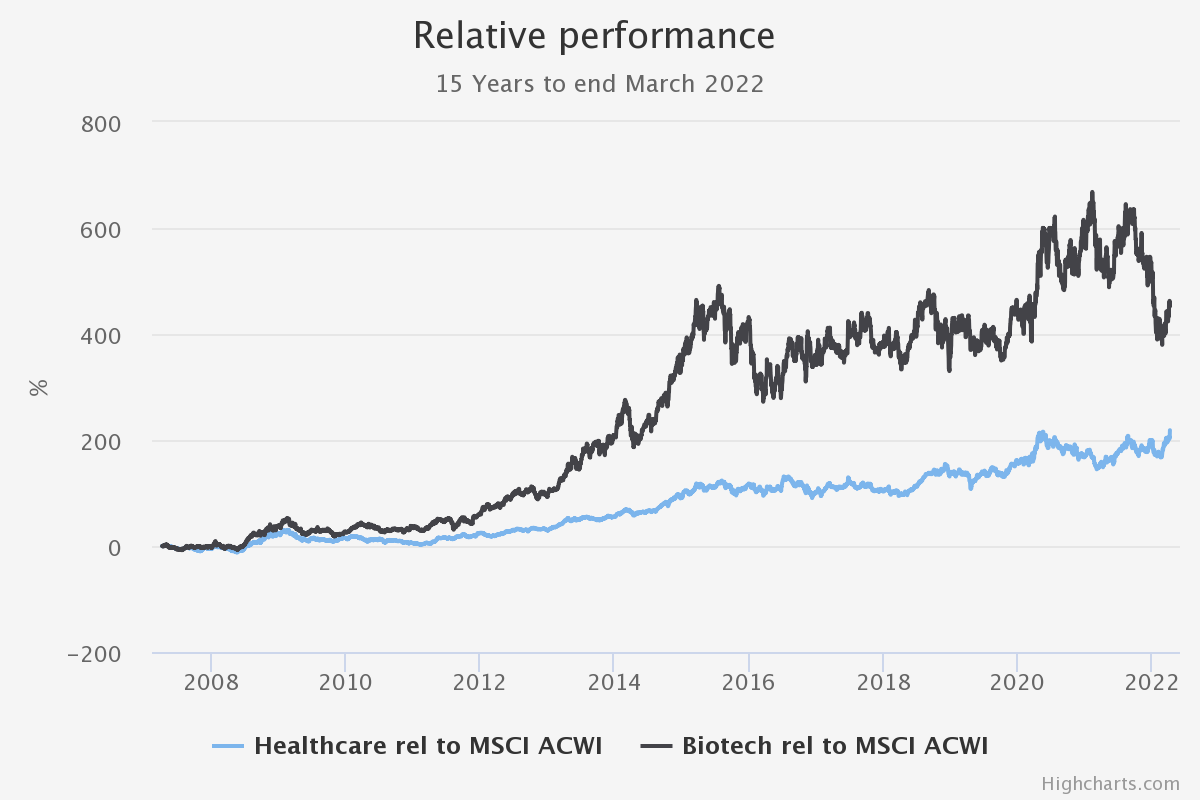
Source: Morningstar. Past performance is not a reliable indicator of future results
Performance over 2021 and subsequently has been poor, which is why (as we discuss below) managers and commentators are discussing the valuation opportunity currently. As the graph below shows, biotechnology in particular, and growth stocks within healthcare also, have been particularly badly hit by sentiment. Year to date, the Nasdaq Biotechnology Index is -6.7%, compared to the MSCI ACWI return of -3.2% and the MSCI World Healthcare Index return of +1.3%.
SHORT TERM PERFORMANCE OF INDICES VS WORLD EQUITIES
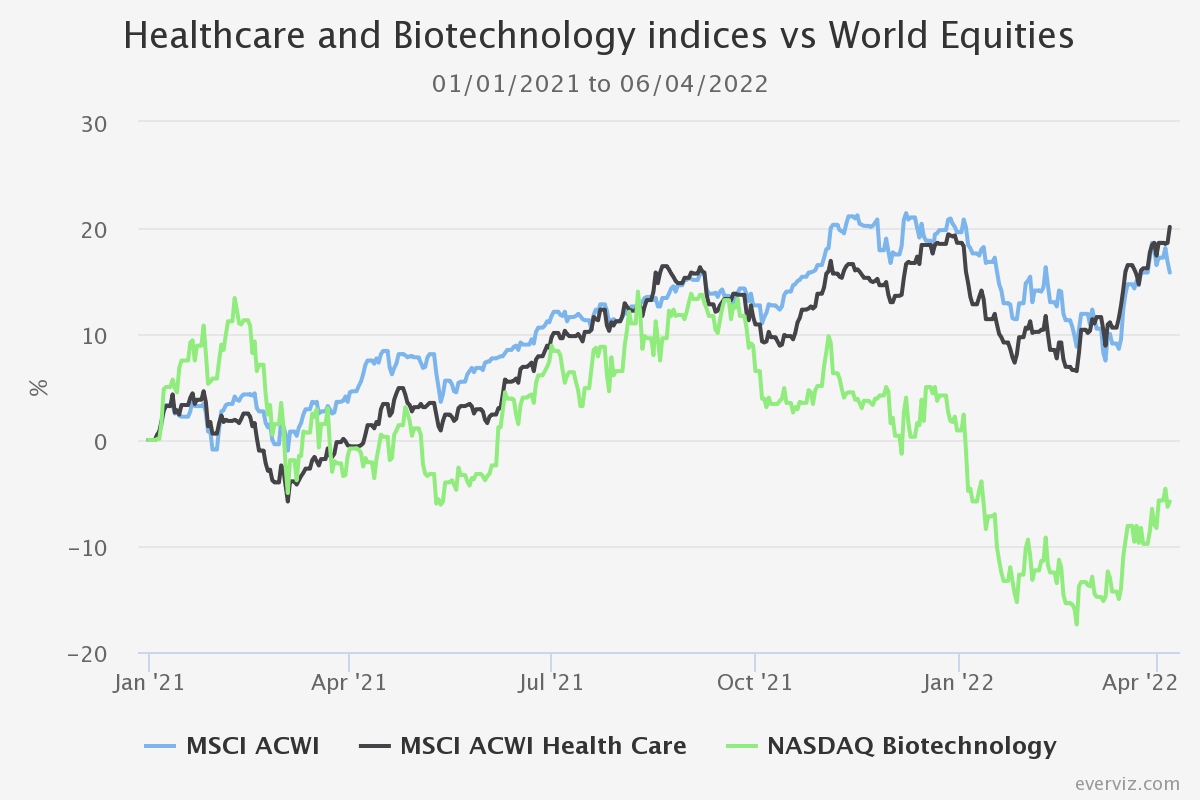
Source: Morningstar. Past performance is not a reliable indicator of future results
The underperformance in recent months has given rise to significantly lower valuations for companies, particularly for those which offer strong growth prospects. Enthusiasm for current valuations is reflected by two specialist management teams in the healthcare sector who presented at our recent virtual conference (see here to download slides and audio). Both teams are fundamental, bottom-up stockpickers and cover slightly different areas of the market. Both observe that valuations in their respective universes are very attractive by historical standards, and both have been gearing up as an illustration of their conviction on this opportunity.
The managers of Bellevue Healthcare (LSE:BBH)said they were “unremitting optimistic” about the outlook. They see valuations of their portfolio companies as highly attractive, believing that inflation, interest rates rising, or the war in Ukraine won’t have any lasting impact on demand for healthcare or the supply of innovative solutions. Their basic premise is that healthcare systems around the world are creaking and that companies that are able to increase capacity at lower cost will be long term winners. BBH typically invests in mid-caps, which offer higher growth and more nimble management. Since launch, average gearing has been 1.8%, but indicative of their view that “history will look back on this moment as a fantastic relative opportunity for long-term healthcare investors”, the team have increased gearing to around 9%, leaving room to increase it further should valuations get even more attractive.
Similarly, the managers of International Biotechnology (LSE:IBT)have reacted to valuations falling by adding to gearing. As the managers commented in a recent blog, “We firmly believe the fundamentals of the sector remain very much intact… we at IBT are buckled in and ready for the ride”. IBT offers access to a diversified portfolio of biotechnology companies, with the team making a conscious effort to deliver returns with lower volatility than the index, a result of their approach to diversifying risks but also systematically reducing active risk to stocks ahead of scheduled trial results or approval decisions by the regulator. IBT’s NAV has been less volatile and had a lower maximum drawdown than peers and the benchmark over the past five years, but IBT has also outperformed its peers over this period on a NAV basis. That gearing has increased markedly this year is, in our view, indicative of the high conviction that the managers currently have in the long-term investment opportunity presented by their portfolio. If they are right, the small and mid-cap exposure and level of gearing could set the trust up for a strong period of performance.
Investors who wish to participate in the strong growth potential of healthcare and biotechnology should, in our view, be mindful of the graph below, which (as we interpret it) shows the decreasing prevalence of growth in each of the benchmarks. This is possibly reflective of the size and dominance that large and mega-cap companies in each index and to us suggest that growth investors would be well placed to invest with an active manager who has the flexibility to invest in small and mid-cap stocks, which may have a better opportunity to deliver strong returns over the long term for shareholders. That their valuations (according to the managers we discussed above) are at historically low levels serves to illustrate that this is a highly interesting time to consider the sector. Nick Greenwood, manager of MIGO Opportunities (LSE:MIGO), echoes this enthusiasm for the Healthcare and Biotechnology sector, recently having added to exposure in his trust through Biotech Growth Trust for its exposure to the “smallest of the smalls” (in his words).
The below chart shows the Morningstar style score of the MSCI ACWI Healthcare, the MSCI ACWI, and the Nasdaq Biotech indices. A score above 200 would indicate a ‘growth’ portfolio. A score between 200 and 100 indicates ‘core’, and less than 100 indicates ‘value’, with the latter two categories indicating lesser levels of both growth and also lower valuations. Each score is based on index constituents’ characteristics relative to their region’s equities, with each index’s score an amalgamation of the underlying company’s scores. In our view, the graph shows that passive investors are likely missing out on much of the growth opportunity that exists within these sectors, but also that valuations across the sectors are now in line with broader markets. If investors believe that the historic growth significantly in excess of wider markets is likely to continue, then this could an opportune juncture to consider a trust or trusts in the AIC Healthcare and Biotechnology Sector.
GROWTH & VALUE EXPOSURE WITHIN INDICES OVER TIME
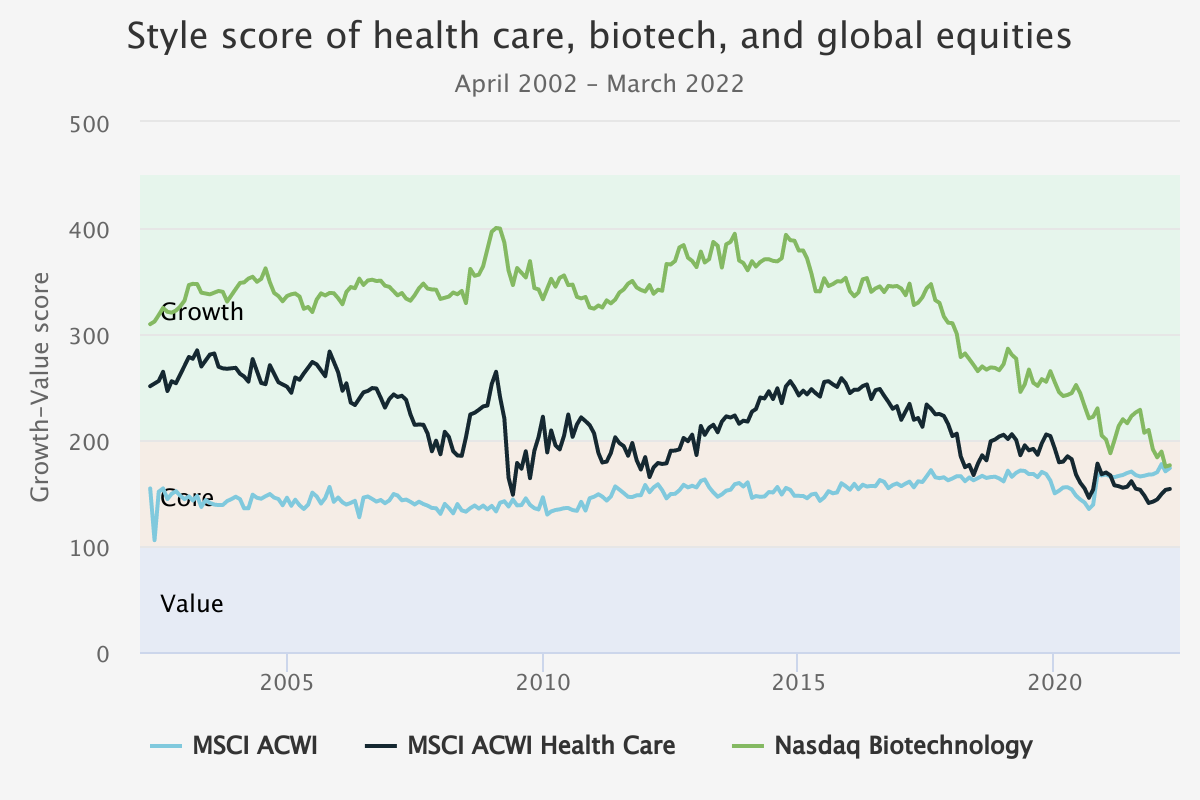
Source: Morningstar. Past performance is not a reliable indicator of future results.
One of the unique features of the healthcare sector is the presence of legal monopolies in the form of patent protection. Clearly, the upfront costs of researching and developing a new drug or healthcare tool are huge, particularly given the need to avoid side effects. Innovations have the potential to significantly improve the lives of many people directly, and so there are large societal benefits from promoting investment. Society’s quid pro quo for those coming up with successful innovations is a period of patent protection, which allows a period for innovators to capture a return on their investment. After the patent period expires (typically 20 years from the patent filing date), other companies can use the technology without paying a licence fee, and this typically results in the same drug (a generic) being widely available at a relatively low cost. Whilst 20 years may seem like a long period for protection, in reality, given the time it takes to get a drug through the approval process and to market, patent protection may be significantly shorter.
It is this feature, as well as the inevitability of the ageing process, that gives the Healthcare and Biotechnology sector its unique and potentially high return characteristics. However, it also gives rise to a sector dynamic that has become increasingly prevalent over the last few decades. As drug and healthcare companies become larger, they have tended to become less successful at innovation and prompting them to beef up M&A (mergers and acquisitions) teams which enables them to buy smaller companies with promising technology, or drugs, to protect their own revenue growth. In many cases, large healthcare companies have strong global distribution networks that would take smaller companies many years to build up. In the context of a limited window of patent protection, large companies can capitalise on new products far better than small ones, and this gives rise to a very prominent M&A cycle within the healthcare and biotechnology sector. With valuations now relatively low and following something of a hiatus during the COVID-19 lockdowns, it is possible that a new M&A cycle will restart, which should be beneficial to smaller and mid-cap company valuations in the sector.
Our summary of the AIC Healthcare and Biotechnology sector, which constitutes seven trusts, can be seen in the table below. The sector offers a variety of different exposures and approaches. All of these trusts should be long-term beneficiaries of the dynamics we describe above, but as we illustrate, several now have significant exposure to mid and small-cap opportunities.
BIOTECHNOLOGY & HEALTHCARE INVESTMENT TRUST SECTOR
| NAME | AREA | % GIANT & LARGE CAP | % MID, SMALL & MICRO CAP | DIVIDEND YIELD % | GEARING % OF NAV | PREMIUM / (DISCOUNT) TO NAV % |
| BB Biotech (SIX:BION) | Biotechnology | 16 | 84 | 5.8 | 0 | +25.4 |
| Bellevue Healthcare (LSE:BBH) | Healthcare | 23 | 77 | 3.2 | 7 | -1.7 |
| Biotech Growth (LSE:BIOG) | Biotechnology | 10 | 90 | n/a | 8 | -7.9 |
| International Biotechnology (LSE:IBT) | Biotechnology | 23 | 77 | 4.5 | 15 | -9.7 |
| Polar Capital Glb Healthcare (LSE:PCGH) | Healthcare | 48 | 52 | 0.7 | 5 | -12.5 |
| Syncona (LSE:SYNC) | Biotechnology | - | 100 | n/a | -8 | -12.1 |
| Worldwide Healthcare (LSE:WWH) | Healthcare | 63 | 37 | 0.7 | 2 | -8.9 |
Source: Kepler, Morningstar, JPMorgan Cazenove.
In the context of the equity market pull-back this year was that even before the tragic events in Ukraine started unfolding, Healthcare and Biotechnology indices had been underperforming. Healthcare is one of the places where innovation rarely takes a day off. With global populations ageing and getting richer, one of the constants in life is rising global spending on healthcare. If a new wave of M&A commences, this could start a new period of outperformance for the sector over global equities.
Kepler Partners is a third-party supplier and not part of interactive investor. Neither Kepler Partners or interactive investor will be responsible for any losses that may be incurred as a result of a trading idea.
These articles are provided for information purposes only. Occasionally, an opinion about whether to buy or sell a specific investment may be provided by third parties. The content is not intended to be a personal recommendation to buy or sell any financial instrument or product, or to adopt any investment strategy as it is not provided based on an assessment of your investing knowledge and experience, your financial situation or your investment objectives. The value of your investments, and the income derived from them, may go down as well as up. You may not get back all the money that you invest. The investments referred to in this article may not be suitable for all investors, and if in doubt, an investor should seek advice from a qualified investment adviser.
Full performance can be found on the company or index summary page on the interactive investor website. Simply click on the company's or index name highlighted in the article.
Important Information
Kepler Partners is not authorised to make recommendations to Retail Clients. This report is based on factual information only, and is solely for information purposes only and any views contained in it must not be construed as investment or tax advice or a recommendation to buy, sell or take any action in relation to any investment.
This report has been issued by Kepler Partners LLP solely for information purposes only and the views contained in it must not be construed as investment or tax advice or a recommendation to buy, sell or take any action in relation to any investment. If you are unclear about any of the information on this website or its suitability for you, please contact your financial or tax adviser, or an independent financial or tax adviser before making any investment or financial decisions.
The information provided on this website is not intended for distribution to, or use by, any person or entity in any jurisdiction or country where such distribution or use would be contrary to law or regulation or which would subject Kepler Partners LLP to any registration requirement within such jurisdiction or country. Persons who access this information are required to inform themselves and to comply with any such restrictions. In particular, this website is exclusively for non-US Persons. The information in this website is not for distribution to and does not constitute an offer to sell or the solicitation of any offer to buy any securities in the United States of America to or for the benefit of US Persons.
This is a marketing document, should be considered non-independent research and is subject to the rules in COBS 12.3 relating to such research. It has not been prepared in accordance with legal requirements designed to promote the independence of investment research.
No representation or warranty, express or implied, is given by any person as to the accuracy or completeness of the information and no responsibility or liability is accepted for the accuracy or sufficiency of any of the information, for any errors, omissions or misstatements, negligent or otherwise. Any views and opinions, whilst given in good faith, are subject to change without notice.
This is not an official confirmation of terms and is not to be taken as advice to take any action in relation to any investment mentioned herein. Any prices or quotations contained herein are indicative only.
Kepler Partners LLP (including its partners, employees and representatives) or a connected person may have positions in or options on the securities detailed in this report, and may buy, sell or offer to purchase or sell such securities from time to time, but will at all times be subject to restrictions imposed by the firm's internal rules. A copy of the firm's conflict of interest policy is available on request.
Past performance is not necessarily a guide to the future. The value of investments can fall as well as rise and you may get back less than you invested when you decide to sell your investments. It is strongly recommended that Independent financial advice should be taken before entering into any financial transaction.
PLEASE SEE ALSO OUR TERMS AND CONDITIONS
Kepler Partners LLP is a limited liability partnership registered in England and Wales at 9/10 Savile Row, London W1S 3PF with registered number OC334771.
Kepler Partners LLP is authorised and regulated by the Financial Conduct Authority.