New research: stock market volatility and Wall Street’s fear index
23rd March 2023 13:27
A key measure of volatility just surpassed average levels in 2021 and 2022, underscoring the scale of instability for markets right now. Our experts share their research, thoughts and ideas on the topic.
- Peak volatility in 2023 year to date has already surpassed average volatility for 2021 and 2022, interactive investor data today shows
- However, the average volatility year to date is lower than the average across the prior three years
- The volatility spike in March 2020 marked the greatest recorded US market volatility over the last 15 years
Volatility has been no stranger to global markets, and with stock markets never staying still – we have seen frequent periods of price changes; some more dramatic than others.
- Invest with ii: Most-traded US Stocks | Buy International Shares | Interactive investor Offers
interactive investor, the UK’s second-largest platform for private investors, looked at the Volatility Index (VIX) over the last 15 years – sometimes known as the fear index. ii outlines two major peaks in volatility, one following the Global Financial Crisis in 2008, and another more recently - following the Covid-19 pandemic in 2020.
What emerges over the past 15 years is a relatively quiet decade for the ‘fear index’ between 2010 to the start of 2020. The global financial crisis saw the most sustained period of fear as represented by volatility of the VIX, which was followed by a decade of relative calm before the pandemic storm.
But even looking at the past three years, volatility as measured by the VIX is elevated compared to the ten years prior, but has not to date resurged in the same ways we saw post global financial crisis – to date at least. And that’s after a turbulent few years politically, socially, emotionally, and economically.
The data is up to 20 March 2023, which includes the start of the US regional banking chaos that has, to a degree, seeped into European markets. There’s no telling how this could play out further, and ii will continue to monitor the VIX.
The VIX can be a powerful litmus for the volatility in the US markets, and by extension – global markets. interactive investor has looked at the VIX index and the S&P 500 to which it is linked.
VIX is a measure of the expected volatility of the S&P 500 over a 30-day period. This is derived from the pricing of call and put options on the index itself (the right but not the obligation to buy or sell the S&P index at a pre-determined price).
A quiet decade – until 2020
Alex Watts, Investment Data Analyst, interactive investor, says: “Broad declines in share prices of the S&P 500 represents volatility that increases the price of options on the index (in most scenarios), and hence the VIX – the ‘fear index’ - increases. Twelve of the past 15 years have shown a clear inverse correlation between the VIX and the S&P 500, but it’s been a relatively quiet decade for the VIX between 2010 - 2020.
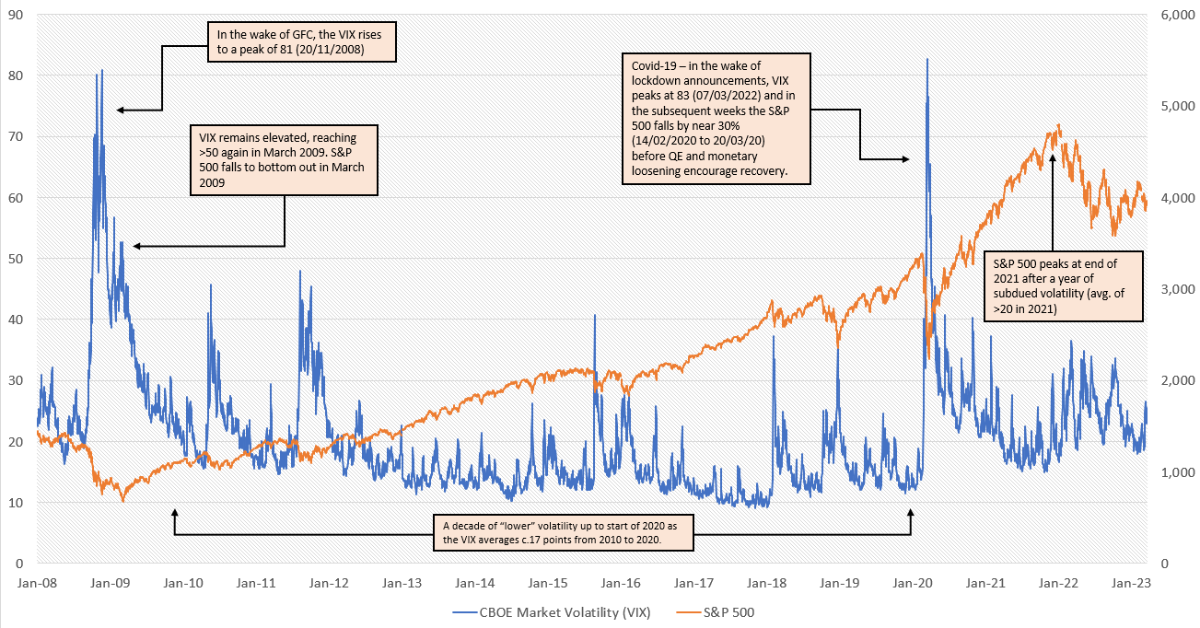
S&P 500 Price Return (data is until 20/03/2020)
Source: ii using Morningstar. Note - if the graphic does not show at first, please download image
Two major spikes in volatility for global markets as represented by VIX over the last 15 years has been the Global Financial Crisis and the first year of the Covid-19 pandemic
Assessing the data, Alex Watts, interactive investor, observes: “Over these past 15 years, the VIX index has hit two outlier peaks: firstly, in the wake of the Global Financial Crisis (GFC) in 2008 and secondly at the onset of the Covid-19 pandemic in early 2020.
“The last three calendar years (2020-2022) saw elevated levels of volatility, averaging near 25 points over that time period. For context, when we compare this with the prior decade of broadly low market volatility, the VIX was averaging under 17 over those 10 years up to 2020.
“The spike in the VIX index of March 2020 to over 82 points marked the greatest recorded US market volatility of the past 15 years. The VIX surged at the start of 2020 as the world’s economies closed following the outbreak of Covid-19, and energy prices slumped while consumer demand plummeted.
“Between 14 February 2020 and 20 March 2020, the S&P 500 fell sharply; it fell by roughly 30% (in USD terms), while the VIX index rose by over 360% over the same period.
“The VIX peaked on the 16 March 2020, around the time the Federal Reserve announced a base rate cut and large QE stimulus, with the S&P 500 bottoming out just days later on the 20th.”
The aftermath of the Global Financial Crisis versus recent market volatility
ii’s research shows that post-Global Financial Crisis, after a peak of 81, the VIX continued to ebb and surge back to peaks of nearly 50 up until late 2011.
However, we can see that during the period after the Covid-19 outbreak, this volatility more quickly dissipated as markets stabilised, aided in part by prolific central bank stimulus.
Victoria Scholar, Head of Investment, interactive investor, says: “Post-pandemic, markets began a V-shaped recovery towards the end of March. We can see that 2020’s average VIX level of 29 points fell to just under 20 in 2021, with nearer to 15 typically indicating a “calmer” market.
“The resurgence of volatility that emerged at the start of 2022 followed the war in Ukraine and the subsequent cost-push inflation delivered primarily by energy supply constraints, spurring an acute rate-hiking cycle in developed and emerging economies.
“Average volatility in December 2021 grew month-on-month to over 27 on average in March and over 28 in June 2022. Meanwhile, the S&P 500 began to decline from its all-time peak in the first trading days of 2022 and in H1 of 2022 the S&P 500 fell by 20%.”
Looking at the mood of the market in 2023 so far, Victoria Scholar, Head of Investment, interactive investor, adds: “Recent banking blues, which saw the collapse of two US banks and a rescue deal for Credit Suisse (SIX:CSGN), have unsurprisingly shaken global markets, evidenced by the VIX which spiked amid the turmoil, hitting a three-year high this month.
“The collapse of Silicon Valley Bank (NASDAQ:SIVB) sparked nervousness among investors about the threat of contagion in the banking system stateside. Liquidity concerns in the financial sector and the sharp re-rating in stock valuations have prompted significant market volatility. However, the swift response from the authorities has helped to mitigate the risk of wider instability, tempering investor nervousness, and easing market bearishness.
“The VIX topped 26 this month, surpassing the average levels in 2021 and 2022, underscoring this heightened period of instability for markets driven by the inflation overhang, monetary tightening, banking uncertainty and the war in Ukraine. However, Wall Street’s so-called fear gauge remains a far cry from the levels seen at the start of the pandemic in March 2020 when worries the global health threat catapulted the index to an all-time high above 82.”
Dzmitry Lipski, Head of Funds Research, interactive investor, adds some fund ideas. He says: “Investors feeling nervous about where markets are heading at the moment could consider investing in gold, for example via - iShares Physical Gold ETC GBP (LSE:SGLN). In the past, gold has performed well relative to equities and other risk assets during periods of extreme economic turbulence, market volatility, and high inflation.
“Investors can also consider iShares Edge MSCI World Minimum Volatility ETF (LSE:MINV)(or its regional sisters), which tracks the performance of an index composed of selected companies from developed countries, which collectively exhibit lower volatility than the broad stock market of developed countries.
Lipski adds: “Alongside asset classes such as government bonds and gold, cash or money market funds, for example - Royal London Short Term Money Market, are considered safe-haven assets. These assets tend to hold their value during periods of market volatility as they generally have a low or negative correlation with equities.”
These articles are provided for information purposes only. Occasionally, an opinion about whether to buy or sell a specific investment may be provided by third parties. The content is not intended to be a personal recommendation to buy or sell any financial instrument or product, or to adopt any investment strategy as it is not provided based on an assessment of your investing knowledge and experience, your financial situation or your investment objectives. The value of your investments, and the income derived from them, may go down as well as up. You may not get back all the money that you invest. The investments referred to in this article may not be suitable for all investors, and if in doubt, an investor should seek advice from a qualified investment adviser.
Full performance can be found on the company or index summary page on the interactive investor website. Simply click on the company's or index name highlighted in the article.