Stockwatch: does this spectacular bull run have further to go?
A share price rally has stalled but this AIM company has plenty of potential. Analyst Edmond Jackson gives his opinion on this successful tip.
23rd April 2024 12:07
by Edmond Jackson from interactive investor

Despite a wider relief rally as Middle East fears temporarily abate, and a strong first-half update yesterday from telecoms’ billing software group Cerillion (LSE:CER), its share price eased around 2% to 1,470p.
- Invest with ii: Open a Stocks & Shares ISA | ISA Investment Ideas | Transfer a Stocks & Shares ISA
It is among the best example of perturbing news of how, in the past 12 months, the number of AIM-listed companies has fallen by 70 to 738, a jump on the 25 that went the year before. In 2007, there were nearly 1,700 AIM shares but the dominant reason now for de-listing is raising money from private equity. While some investors curse AIM for flaky companies, Cerillion has more than ten-bagged from around 150p back in 2018 to a Christmas 2023 high at just over 1,600p.
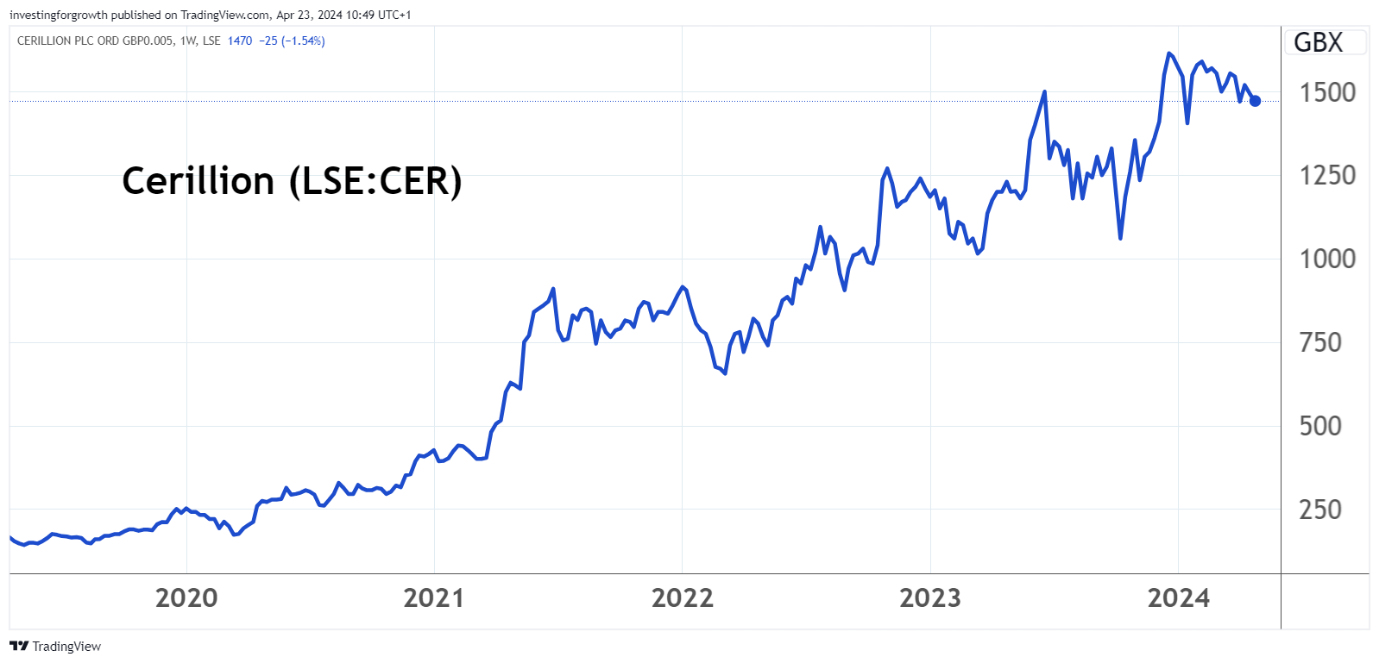
Source: TradingView. Past performance is not a guide to future performance.
The forward price/earnings (PE) multiple is 31x current financial year expectations (affirmed by the update), easing toward 27x for September 2025. This, I believe, partly reflects scarcity of growth shares despite softening in Cerillion’s growth rates.
After earnings per share (EPS) growth tested 150% in 2021 it eased to 69%, then 21% last year. Around 7% is implied for this September’s EPS outcome and 12% in 2025. With the company currently citing 10% growth rates, at least it implies scope for modest upgrading for this financial year.
Headline numbers are softening somewhat
I drew attention to Cerillion as a “buy” at 820p two years ago after a similar first-half update. Better late than never, and it was quite easy to distinguish attractions in revenue growing at mid-20% rates plus operational gearing manifest in the way EBITDA (close to operating profit) was up 48%.
- Sign up to our free newsletter for investment ideas, latest news and award-winning analysis
- Five AIM income stocks for your ISA in 2024
Compared to this, revenue in the six months to 31 March this year is up nearly 10% to £22.5 million with EBITDA up similarly to near £11 million. An impressive margin still, but this aspect of gearing is gone – as if costs have risen or the business is reaching scale where it no longer applies. Net cash is up nearly 13% towards £27 million, making the dividend look quite meagre – given nearly four times’ earnings cover – although with return on equity around 40% it makes sense to retain earnings, assuming it gets invested well.
Revenue is still at a low base arithmetically (able to benefit the growth rate) and the operating margin has soared from 5% to 39% over seven years (see table below).
Cerillion - financial summary
Year-end 30 Sep
| 2016 | 2017 | 2018 | 2019 | 2020 | 2021 | 2022 | 2023 | |
| Turnover (£ million) | 8.4 | 16.0 | 17.4 | 18.8 | 20.8 | 26.1 | 32.7 | 39.2 |
| Operating margin (%) | 5.2 | 13.1 | 10.9 | 13.4 | 13.5 | 28.9 | 32.7 | 39.0 |
| Operating profit (£m) | 0.4 | 2.1 | 1.9 | 2.5 | 2.8 | 7.5 | 10.7 | 15.3 |
| Net profit (£m) | 0.3 | 2.0 | 1.9 | 2.3 | 2.6 | 6.4 | 9.3 | 12.9 |
| EPS - reported (p) | 1.3 | 6.9 | 6.5 | 7.8 | 8.8 | 21.7 | 31.6 | 43.7 |
| EPS - normalised (p) | 3.4 | 6.9 | 6.8 | 7.8 | 8.8 | 21.7 | 36.7 | 44.3 |
| Operating cashflow/share (p) | -3.5 | 11.7 | 12.5 | 17.1 | 22.2 | 33.1 | 41.7 | 32.9 |
| Capital expenditure/share (p) | 3.2 | 3.6 | 5.6 | 4.1 | 4.8 | 4.3 | 5.4 | 4.8 |
| Free cashflow/share (p) | -6.7 | 8.1 | 6.9 | 13.0 | 17.4 | 28.8 | 36.3 | 28.1 |
| Dividends per share (p) | 3.9 | 4.2 | 4.5 | 4.9 | 5.5 | 7.1 | 9.1 | 8.0 |
| Covered by earnings (x) | 0.3 | 1.6 | 1.4 | 1.6 | 3.1 | 3.5 | 3.5 | 5.5 |
| Return on total capital (%) | 2.4 | 12.0 | 11.1 | 14.8 | 13.0 | 29.7 | 34.1 | 37.3 |
| Cash (£m) | 5.0 | 5.3 | 5.3 | 6.8 | 8.3 | 13.2 | 20.2 | 24.7 |
| Net debt (£m) | -0.4 | -1.7 | -2.5 | -5.0 | -2.1 | -8.4 | -16.2 | -21.6 |
| Net assets (£m) | 13.0 | 13.8 | 14.4 | 15.5 | 16.0 | 20.2 | 26.7 | 36.9 |
| Net assets per share (p) | 43.9 | 46.6 | 48.9 | 52.7 | 54.5 | 68.8 | 90.9 | 125 |
Source: historic company REFS and company accounts.
In a situation like this – a “growth” type rating versus underlying numbers that barely support it – the question is whether a slew of contracts could turbocharge them again. This is still a small company testing £50 million revenue and its financial dynamics can easily change.
A strong pipeline is cited with “a number of substantial potential new contracts at various stages of negotiation” as if news can be expected, with Cerillion “well-placed to meet expectations for the current financial year and beyond”.
The business is clearly doing well, amid full-fibre broadband and 5G roll-out. But it’s unclear quite whether it consolidates in due course before 6G adds a new dimension.
A tepid response to this latest update
If you respect “technical analysis”, charts which reflect the balance between buyers and sellers, you would regard guessing fundamentals as less significant than what is before your eyes.
Of concern, therefore, is the tepid response to this latest update, although a 4% slip did recover to less than 2%. True, management did not express a “beat” of expectations to justify a further rise, and the chart shows a particularly strong run from 1,080p last October to 1,600p by Christmas. But there has definitely been a consolidation-downwards trend this year, relative to sideways for the AIM 100 index.
- Five AIM growth shares for your ISA
- ‘I made £80K on an AIM share’ – how an ISA millionaire’s portfolio evolved
Mind, as regards the validity of technical analysis. Cerillion fell last October from 1,325p to 1,050p in a matter of days – a 20%+ drop that should have triggered a stop-loss for investors minded to place one. Or perhaps this simply shows a stop-loss approach is too crude, given a 24% rebound to 1,600p promptly followed.
A fair observation seems that the story on Cerillion is well known and its shares exhibit a long bull run. Investors likely to buy, already hold it. “In line” updates therefore, at best, sustain a high valuation where it is.
Can Cerillion leverage greater scale?
The company originated as a 1999 management buyout of the in-house customer care and billing product division of Logica, so it has existed a good while, if yet to achieve £50 million annual revenue. There are around 80 customer installations in 45 countries.
This is not a Microsoft Corp (NASDAQ:MSFT) leveraging massive scale via cloud applications for global businesses. Cerillion is a relatively specialist software company serving telecoms, finance, utilities and transportation. Admittedly, that should offer good scope for growth.
Nor is it akin to Sage Group (The) (LSE:SGE), which extends very broadly in enterprise resource planning software, being the world’s third-largest supplier. Sage shares have soared from 4p in 1990 to a 1,265p all-time high last March, and is an example of why not to sell down a dynamic, well-managed software group just because it looks pricey.
Sage is similarly on a 30x forward PE, albeit yielding nearer 2% than Cerillion near 1%. Sage shares are likewise undergoing something of a correction currently – 10% down from the high - yet both remain well above a 200-day moving average.
- ISA insights: guides, investment ideas and tax tips
- Insider: bosses at this small-cap pair spend over £300k
Possibly, Cerillion could make a strategic acquisition with its cash in a perceived new area for growth and back it also with organic investment. That was not entertained in the 2023 annual report. The story was “numerous factors continuing to drive software that connects their network to customers” with attempted reassurance how “in a slower growth environment for telcos, the need to exact more revenue from existing assets and improve operational efficiency are as important drivers...as investment in new 5G and fibre infrastructure.”
Management proclaimed “a huge marketplace” in which its brand is rising, and the outlook statement was bullish. First-half revenue/profit growth of around 10% is down, however, on 27% and 39% reported a year ago, hence the interim results due 13 May will need to substantiate further growth relative to the share’s high rating. Might a contract or two be declared simultaneously?
Low yields mean software shares can ‘fall between two stools’
A common dilemma for Cerillion and Sage is that if growth-driven investors (likely their majority holders) get restless with any aspect of slowdown – in the business or shares – and look to switch into something more exciting, there is no material yield prop.
Such shares would have to de-rate to attract income investors to more worthwhile yields than 1% to 2% currently. This is despite consistently strong, free cash-flow profiles.
To my mind, therefore, such risk/reward profiles are not as strong as the proclaimed narratives. Managements must deliver on what they say, otherwise if the underlying growth rate slows then shares de-rate. In terms of 12-month forward “PEG” ratios (PE ratio divided by forecast EPS growth), both Sage and Cerillion are on pricy multiples of 2.5 and 3.0 respectively.
This puts quite some pressure on Cerillion to flesh out more progress and prospects. I retain a “hold” stance (as last October at 1,150p), but further profit-taking could follow the 13 May results – so be attuned.
Edmond Jackson is a freelance contributor and not a direct employee of interactive investor.
These articles are provided for information purposes only. Occasionally, an opinion about whether to buy or sell a specific investment may be provided by third parties. The content is not intended to be a personal recommendation to buy or sell any financial instrument or product, or to adopt any investment strategy as it is not provided based on an assessment of your investing knowledge and experience, your financial situation or your investment objectives. The value of your investments, and the income derived from them, may go down as well as up. You may not get back all the money that you invest. The investments referred to in this article may not be suitable for all investors, and if in doubt, an investor should seek advice from a qualified investment adviser.
Full performance can be found on the company or index summary page on the interactive investor website. Simply click on the company's or index name highlighted in the article.
Disclosure
We use a combination of fundamental and technical analysis in forming our view as to the valuation and prospects of an investment. Where relevant we have set out those particular matters we think are important in the above article, but further detail can be found here.
Please note that our article on this investment should not be considered to be a regular publication.
Details of all recommendations issued by ii during the previous 12-month period can be found here.
ii adheres to a strict code of conduct. Contributors may hold shares or have other interests in companies included in these portfolios, which could create a conflict of interests. Contributors intending to write about any financial instruments in which they have an interest are required to disclose such interest to ii and in the article itself. ii will at all times consider whether such interest impairs the objectivity of the recommendation.
In addition, individuals involved in the production of investment articles are subject to a personal account dealing restriction, which prevents them from placing a transaction in the specified instrument(s) for a period before and for five working days after such publication. This is to avoid personal interests conflicting with the interests of the recipients of those investment articles.
AIM stocks tend to be volatile high-risk/high-reward investments and are intended for people with an appropriate degree of equity trading knowledge and experience.