Stockwatch: is this FTSE 100 share now a contrarian buy?
Now that a bounce off multi-year lows has run out of steam, analyst Edmond Jackson assesses this popular blue-chip’s investment potential.
23rd May 2025 10:48
by Edmond Jackson from interactive investor

A life-cycle of “growth” to “value” can be an enduring theme in shares. It’s during a company’s go-go years that its shares attract a big rating as numbers impress and momentum buyers pile in. This inevitably becomes volatile once the business reaches a size which makes growth more challenging, and when management resorts to acquisitions to boost earnings per share, raising risk and leading to criticism of exceptional charges.
- Invest with ii: Open an ISA | ISA Investment Ideas | ISA Offers & Cashback
A self-reinforcing bias for the shares may then apply on the downside until either price or the dividend payout policy achieves a yield large enough to attract income investors. The cycle from growth to maturity is completed when the shareholder base alters.
It is interesting to apply this simple model to JD Sports Fashion (LSE:JD.), which has fallen from over 230p in late 2021 to as low as 63p six weeks ago, amid President Donald Trump wielding draconian tariffs. Shares are currently 85p as investors digest annual results to 1 February.
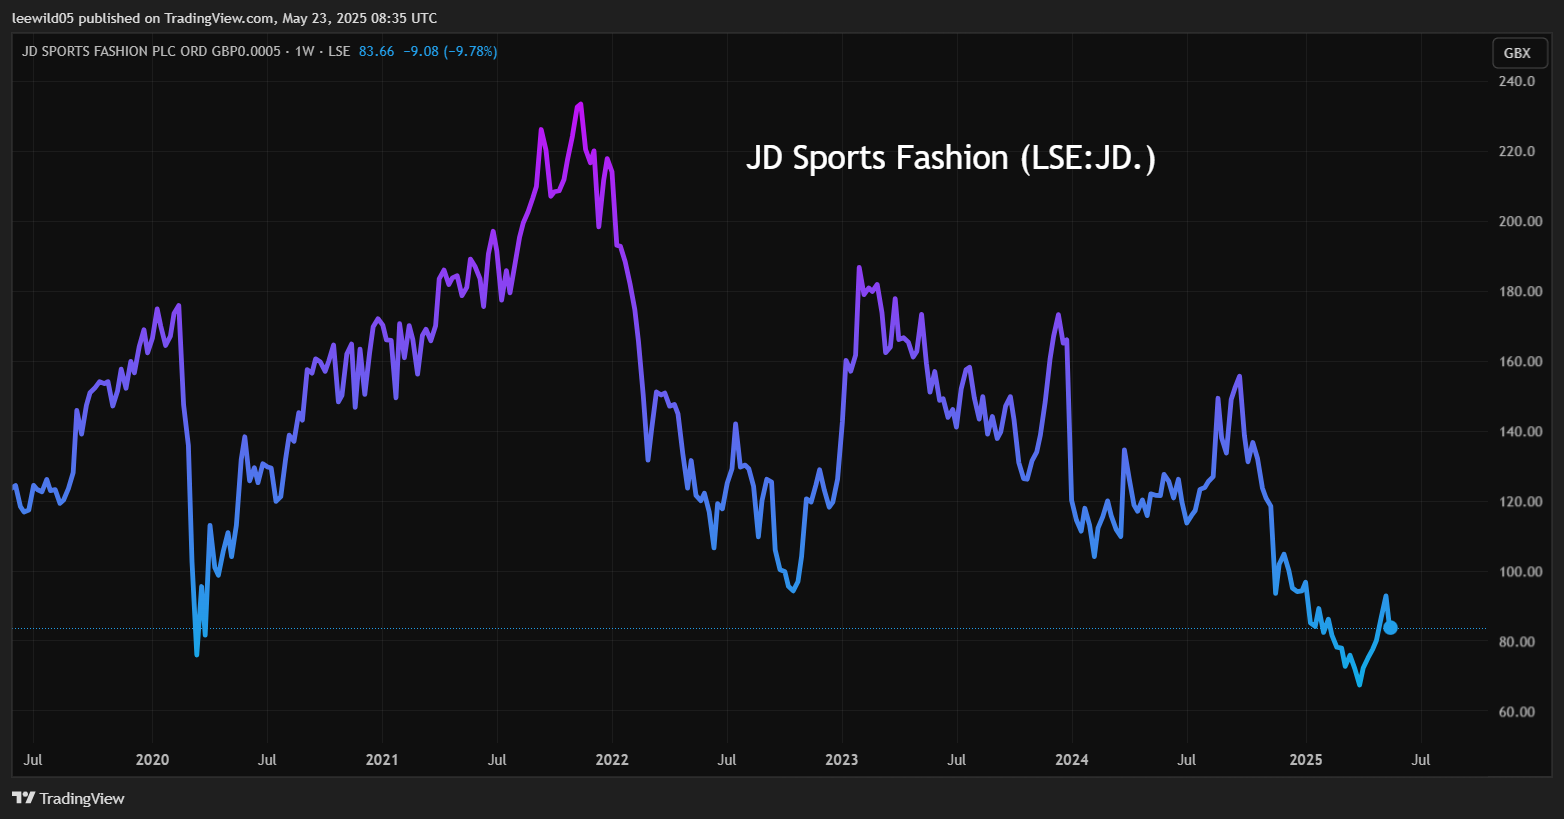
Source: TradingView. Past performance is not a guide to future performance.
At this level, the business is valued near £4.4 billion, under 0.4x sales and a 12-month forward price/earnings (PE) multiple of 7.0x as earnings per share (EPS) climbs towards 13p. But mind how there is already a gap between the reported figure of 9.5p and 14.8p as acquisitions are integrated and the store estate churns.
Despite a retailer’s cash-generative business model, “returns” remain oriented around growth investors, with the tease of a share buyback programme currently, while earnings cover for a projected 1p per share dividend this financial year will be 12x versus 1.4x for B&M European Value Retail SA (LSE:BME), a classic “value”-type share offering a 6% yield at 337p.
- This is why investors blow up – even when knowing the future
- Sector Screener: expect further capital gains from this pair
A growth agenda is shown also by JD’s latest cash-flow statement: net cash from operations is up 8% to £1,228 million albeit £1,494 million spent on investment, of which 73% constituted acquisitions. Period-end cash thus fell 37% and the £48 million paid out as dividends constituted barely 4% of net cash from operations.
So, JD’s board asks us to judge the business in growth terms, which in one sense is reasonable given return on equity has been 18% in the last year, if down on nearly 24% in the previous financial year.
Yet a scant 1% prospective yield helps explain the share’s near 11% drop to 83p in initial response to the results. Yes, management reminded us of scope for US tariffs to compromise revenue in JD’s largest global market, but when capital growth-oriented traders sold the latest rally from 68p to 90p, there were no income buyers to mitigate the drop. The shares are also at 1.5x net asset value and 7.7x tangible net assets, hence no balance sheet prop.
Where are drivers for a next stage of growth?
Due to an expected dip in EPS this financial year, JD does not strictly qualify for the price/earnings-to-growth, or PEG ratio, but even assuming a 13% recovery in the February 2027 year, normalised EPS of 13.2p would be 11% down on 2025.
JD’s situation is different to when I drew attention in August 2010 at a pre-stock split price equivalent of 36.2p. The business was smaller-scale and the PEG ratio was well below 1.0, which typically implies value. The PE multiple was also in the low teens versus Sports Direct (nowadays Frasers Group (LSE:FRAS)) on a classic growth rating above 20x.
It took until 2016 for JD to achieve a similar rating, by which time the group was in a purple patch for growth. The shares had a strong run to over 170p in early 2020 and the Covid plunge set up another bull run from 70p over 230p by late 2021.
JD’s price then de-rated despite the financial summary table showing not disrespectful progress, effectively a mean-reversion from over-inflated share price levels, with the market now groping for a fair valuation in respect of what total returns look likely.
JD Sports Fashion - financial summary
year end 1 February
| 2016 | 2017 | 2018 | 2019 | 2020 | 2021 | 2022 | 2023 | 2024 | 2025 | |
| Turnover (£ million) | 1,822 | 2,379 | 3,161 | 4,718 | 6,111 | 6,167 | 8,563 | 10,125 | 10,542 | 11,458 |
| Operating margin (%) | 7.3 | 10.1 | 9.4 | 7.3 | 7.0 | 6.2 | 8.4 | 8.0 | 8.2 | 7.9 |
| Operating profit (£m) | 133 | 240 | 296 | 346 | 427 | 385 | 721 | 806 | 868 | 903 |
| Net profit (£m) | 97.6 | 179 | 232 | 262 | 246 | 224 | 370 | 188 | 539 | 490 |
| EPS - reported (p) | 10.0 | 18.4 | 4.8 | 5.4 | 5.1 | 4.6 | 7.2 | 3.7 | 10.4 | 9.5 |
| EPS - normalised (p) | 13.0 | 19.1 | 5.1 | 5.9 | 6.8 | 6.4 | 7.8 | 8.7 | 13.4 | 14.8 |
| Return on equity (%) | 28.8 | 38.3 | 35.1 | 29.4 | 22.1 | 18.3 | 23.4 | 9.4 | 23.6 | 18.2 |
| Return on total capital (%) | 30.1 | 37.2 | 31.3 | 26.5 | 13.7 | 10.7 | 13.9 | 14.0 | 14.4 | 12.0 |
| Operating cashflow/share (p) | 23.2 | 28.7 | 7.0 | 7.8 | 17.5 | 22 | 24.6 | 21.0 | 22.1 | 23.8 |
| Capital expenditure/share (p) | 8.6 | 9.0 | 3.8 | 3.9 | 3.6 | 2.7 | 4.9 | 7.0 | 10.5 | 10.3 |
| Free cashflow/share (p) | 14.6 | 19.7 | 3.1 | 3.8 | 13.9 | 19.1 | 19.7 | 14.0 | 11.6 | 13.4 |
| Dividend/share (p) | 1.5 | 1.6 | 0.03 | 0.03 | 0.01 | 0.3 | 0.4 | 0.8 | 0.9 | 1.0 |
| Cash (£m) | 216 | 248 | 348 | 251 | 466 | 964 | 1,314 | 1,508 | 1,153 | 1.0 |
| Net debt (£m) | -209 | -214 | -310 | -125 | 1,563 | 1,134 | 1,100 | 989 | 1,461 | 3,007 |
| Net assets (£m) | 382 | 552 | 770 | 1,009 | 1,219 | 1,239 | 1,873 | 2,117 | 2,456 | 2,922 |
| Net assets per share (p) | 39.3 | 56.7 | 15.8 | 20.7 | 25.1 | 25.5 | 36.3 | 40.8 | 47.4 | 56.4 |
Source: historic company REFS and company accounts.
JD has in its last year made “strategically important” acquisitions of retailers Hibbett Inc. and Courir, extending reach in the US and Europe. But a dilemma I see is these being store-based when online specialists with lower overheads have worn down JD’s sales growth on price, often with similar high-quality brands that JD sells.
Beneath JD’s 10% sales growth last year, like-for-like rose only 0.3%, which does not even peg inflation. Yes, in the “fashion” element sense it must be advantageous when customers pay high prices for sneakers and clothing to try it on before purchasing. Yet sportspeople may have a specific idea about what kit they want, and be more willing to buy from the likes of Yorkshire-based SportsShoes.com, or indeed manufacturers’ own websites, both of which offer regular discounts.
- Fund managers’ favourite UK smaller companies
- Sign up to our free newsletter for investment ideas, latest news and award-winning analysis
JD is nowadays effectively a re-seller for big brands. Despite its “four pillars” including “JD Brand First”, customers are being pitched with a plethora of multi-national brands. Due respect to JD that it has managed to exact a circa 8% operating margin since 2022, although it could be due to relatively expensive goods. The margin has lately slipped to 7.9% as store expansion raised operating costs by 12%.
That 46 stores are set to be closed in Europe shows the business reaching a scale and maturity where such change is needed, rather than if firing on all cylinders. It also suggests the marketplace has become more crowded.
Such factors combine for a less than clean growth story, without compelling reasons to shop at JD - whether online or in-store. Acquisitions therefore become more necessary to demonstrate growth, but which mean regular exceptional charges and, as the group gets ever-larger, making true financial growth harder to achieve.
Is there a strategic alternative, where the business is run more for cash than expansion, with greater dividend returns?
Private owner could get 25% return over four years
That broker Citi’s analysts calculate that such a significant return is possible – even for a private equity buyer paying around twice JD’s current market value – hints at scope for a different approach.
But private equity is notoriously transaction-based; only a very few of the biggest operators own private businesses for many years. What therefore would be the exit strategy? How would JD be managed differently to now to make it more appealing, hence valuable for the next buyer?
Note, however, JD is 52% owned by Pentland Group (in its listed days, a 1980s growth share phenomenon) which itself may be wondering about an exit and amenable to an offer.
Another possibility is an “activist”-type hedge fund pushing for less expansion and greater returns. Yet it would take a substantial rise in the dividend to make JD appeal as an income share: a 400% rise would achieve 4.8% at the current share price, or 4% at 100p.
- Stockwatch: is this still a growth share with legs?
- Lloyds among bank shares tipped following sector upgrade
I suspect JD will sweat on, clinging to its growth model, but if its de-rating implies the market sees this as futile in the long run, is this not a recipe for ongoing share volatility?
Given the strategic bind, I’m inclined to at least see where the dust settles around Trump’s tariffs, given just over 30% of JD’s revenue is US-derived. There is also the aspect of how tariff-induced inflation could crimp US consumer spending, especially discretionary.
The shares are thus an awkward proposition of “perhaps too cheap to sell, but with a risk to holding” versus “a confused prospect to buy” if the growth strategy is less valid. With fresh money, I would wait and see how this current year pans out. For existing owners currently: Hold.
Edmond Jackson is a freelance contributor and not a direct employee of interactive investor.
These articles are provided for information purposes only. Occasionally, an opinion about whether to buy or sell a specific investment may be provided by third parties. The content is not intended to be a personal recommendation to buy or sell any financial instrument or product, or to adopt any investment strategy as it is not provided based on an assessment of your investing knowledge and experience, your financial situation or your investment objectives. The value of your investments, and the income derived from them, may go down as well as up. You may not get back all the money that you invest. The investments referred to in this article may not be suitable for all investors, and if in doubt, an investor should seek advice from a qualified investment adviser.
Full performance can be found on the company or index summary page on the interactive investor website. Simply click on the company's or index name highlighted in the article.
Disclosure
We use a combination of fundamental and technical analysis in forming our view as to the valuation and prospects of an investment. Where relevant we have set out those particular matters we think are important in the above article, but further detail can be found here.
Please note that our article on this investment should not be considered to be a regular publication.
Details of all recommendations issued by ii during the previous 12-month period can be found here.
ii adheres to a strict code of conduct. Contributors may hold shares or have other interests in companies included in these portfolios, which could create a conflict of interests. Contributors intending to write about any financial instruments in which they have an interest are required to disclose such interest to ii and in the article itself. ii will at all times consider whether such interest impairs the objectivity of the recommendation.
In addition, individuals involved in the production of investment articles are subject to a personal account dealing restriction, which prevents them from placing a transaction in the specified instrument(s) for a period before and for five working days after such publication. This is to avoid personal interests conflicting with the interests of the recipients of those investment articles.