Stockwatch: is this still a growth share with legs?
This buy tip has been hugely profitable, but analyst Edmond Jackson is reassessing prospects following latest results. Here’s what he thinks now.
20th May 2025 09:56
by Edmond Jackson from interactive investor

Telecom billings software group Cerillion (LSE:CER) is a case study in when to sell a successful long-term growth share, with plenty of relevance elsewhere. Essentially, do you avoid, take profits or sell out, chiefly because the valuation is rich? Or do you hold your bite and trust the business grows into it over years?
- Invest with ii: Top UK Shares | Share Tips & Ideas | Open a Trading Account
Considering the totality of measures, at around 1,700p these AIM-listed shares look overpriced, trading on a forward price/earnings (PE) ratio of 30 times using consensus forecasts which the company affirmed with half-year results yesterday. The dividend yield is below 1% even with the interim payout raised by 20%. A price/sales ratio near 12x and a similar multiple to tangible book value. Yes, a software company justifiably has intangible assets, but Cerillion is still over 10x net assets.
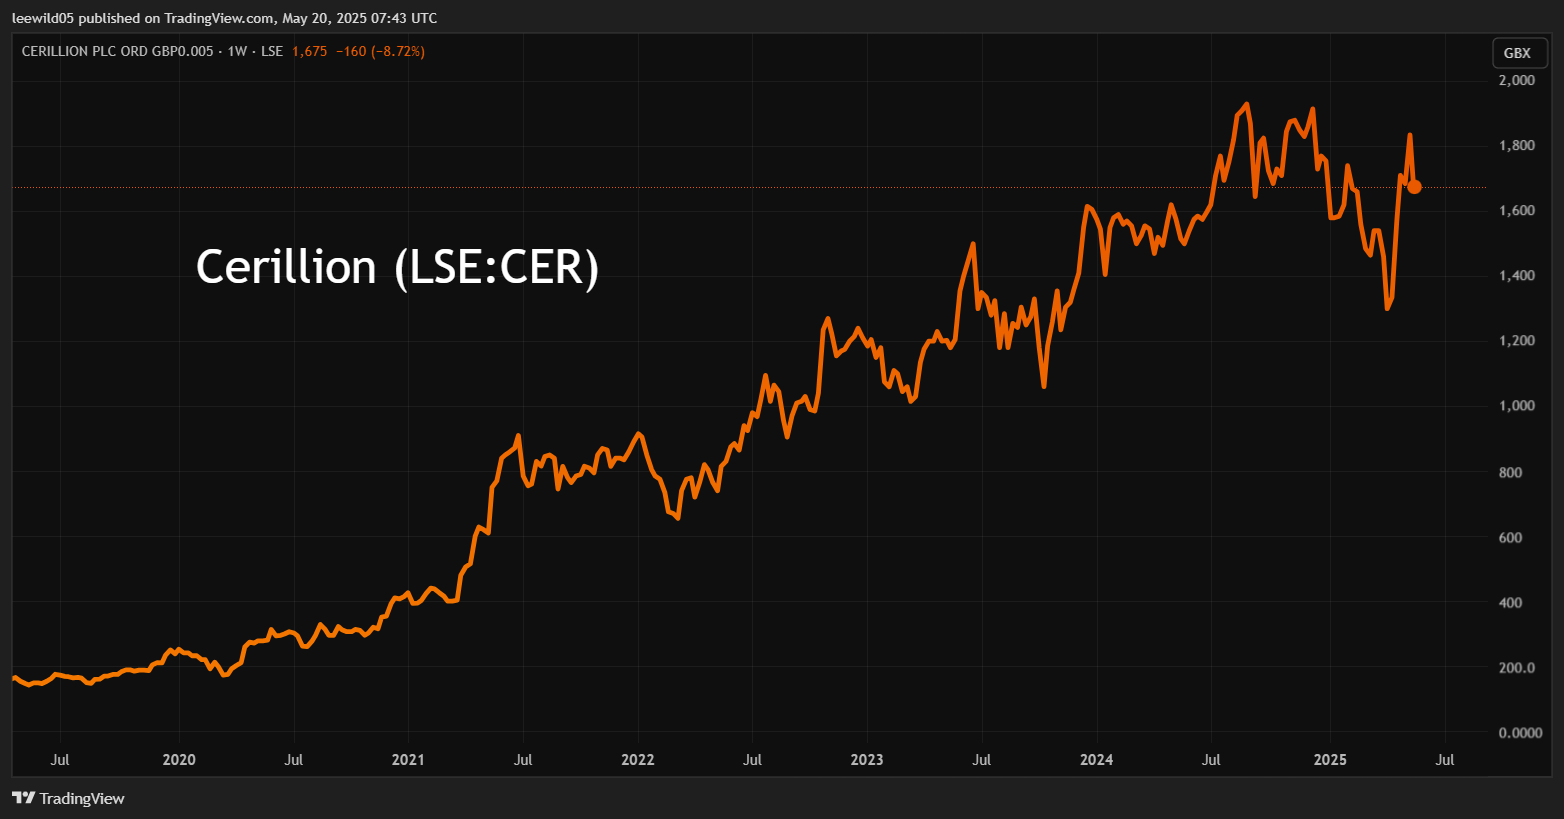
Source: TradingView. Past performance is not a guide to future performance.
So it was not wholly surprising that the shares fell over 7% yesterday in response to the results that showed a 7% revenue fall to £20.9 million, and profit/earnings measures down between 9% and 13%. Yet this had been precisely guided for in a 14 April update due to the bulk of expected licence renewals/extensions shifting to the second half to 30 September. Total new orders were 3% lower at £19.6 million, although the new customer sales pipeline is up 3% at £261 million.
That is meek given revenue is a key variable that growth-driven investors tend to prioritise. Cerillion is also interesting to unpack – as a yardstick for market sentiment – given its price soared 49% from 1,230p on 14 April to 1,835p as of 16 May, as many shares rebounded strongly on hopes the US tariff threat has receded. Despite Cerillion having no US exposure and telecoms advances being somewhat insulated from near-term economic swings.
To get an objective grasp on this share, it is therefore necessary to stand back even from yesterday’s drop – due probably to a reminder that published numbers are down in a context of wider market euphoria in the last week or so.
Yet management cites recurring revenue up 8% to £8.2 million, the back-order book by 7% to £50.2 million and the adjusted operating margin only marginally weaker at an impressive 47.7%.
Their overview asserts a “favourable” industry backdrop despite recently unsettled global trading conditions, as if the shares have defensive appeal. The company said: “We continue to see strong market demand for our product-focussed, Saas solutions...and remain confident of delivering market expectations for the financial year and beyond.”
- Shares for the future: why I’m downgrading this complex company
- Sign up to our free newsletter for investment ideas, latest news and award-winning analysis
The aspect of upside risk here would be if the company – still relatively small, despite a market value just over £500 million – succeeds in the medium-term to close a raft of attractive new contracts able to boost financial growth, and also benefits in the longer run from another watershed in telecoms evolution, such as 6G.
Yet the financial context is still a moderated growth rate. Even respecting consensus forecasts, the September 2025 year is expected to be one of consolidation – just 3% earnings per share growth, improving to 12% in 2026. This compares with very strong, double-digit rates in prior years:
| Cerillion - financial summary | |||||||||
| Year-end 30 Sep | 2016 | 2017 | 2018 | 2019 | 2020 | 2021 | 2022 | 2023 | 2024 |
| Turnover (£ million) | 8.4 | 16.0 | 17.4 | 18.8 | 20.8 | 26.1 | 32.7 | 39.2 | 43.8 |
| Operating margin (%) | 5.2 | 13.1 | 10.9 | 13.4 | 13.5 | 28.9 | 32.7 | 39.0 | 42.1 |
| Operating profit (£m) | 0.4 | 2.1 | 1.9 | 2.5 | 2.8 | 7.5 | 10.7 | 15.3 | 18.4 |
| Net profit (£m) | 0.3 | 2.0 | 1.9 | 2.3 | 2.6 | 6.4 | 9.3 | 12.9 | 15.3 |
| EPS - reported (p) | 1.3 | 6.9 | 6.5 | 7.8 | 8.8 | 21.7 | 31.6 | 43.7 | 51.5 |
| EPS - normalised (p) | 3.4 | 6.9 | 6.8 | 7.8 | 8.8 | 21.7 | 36.7 | 44.3 | 52.4 |
| Operating cashflow/share (p) | -3.5 | 11.7 | 12.5 | 17.1 | 22.2 | 33.1 | 41.7 | 32.9 | 37.8 |
| Capital expenditure/share (p) | 3.2 | 3.6 | 5.6 | 4.1 | 4.8 | 4.3 | 5.4 | 4.8 | 5.1 |
| Free cashflow/share (p) | -6.7 | 8.1 | 6.9 | 13.0 | 17.4 | 28.8 | 36.3 | 28.1 | 32.7 |
| Dividends per share (p) | 3.9 | 4.2 | 4.5 | 4.9 | 5.5 | 7.1 | 9.1 | 8.0 | 13.2 |
| Covered by earnings (x) | 0.3 | 1.6 | 1.4 | 1.6 | 3.1 | 3.5 | 3.5 | 5.5 | 3.9 |
| Return on total capital (%) | 2.4 | 12.0 | 11.1 | 14.8 | 13.0 | 29.7 | 34.1 | 37.3 | 35.7 |
| Cash (£m) | 5.0 | 5.3 | 5.3 | 6.8 | 8.3 | 13.2 | 20.2 | 24.7 | 29.9 |
| Net debt (£m) | -0.4 | -1.7 | -2.5 | -5.0 | -2.1 | -8.4 | -16.2 | -21.6 | -27.1 |
| Net assets (£m) | 13.0 | 13.8 | 14.4 | 15.5 | 16.0 | 20.2 | 26.7 | 36.9 | 48.5 |
| Net assets per share (p) | 43.9 | 46.6 | 48.9 | 52.7 | 54.5 | 68.8 | 90.9 | 125 | 164 |
Source: historic Company REFS and company accounts
And while dividend cover is expected to be nearly 4x earnings or 2.5x free cash flow in the last financial year, the dividend would need to quadruple to 60p per share to offer just a 3.5% yield, which would involve a full payout of earnings per share (EPS) expected for 2026. It shows quite simply why the shares are prone to volatility - shifting with sentiment among growth investors, while lacking steady support from income seekers.
Is there a real “moat” around this business?
To me this is the crux issue, for if “yes”, there is a moat (a competitive advantage), then investors can quite reasonably tuck the shares away in expectation of new contract wins over the long term.
Last January saw a new five-year contract with Armenia worth £8.4 million equivalent - covering fixed, mobile, broadband and TV services. Then in March came a £5.4 million contract renewal with a major European customer, and another is due to use Cerillion’s software in a circa £8 million framework agreement “with major licence extensions to follow”. Virgin Media Ireland and a Southern Africa provider are cited for new implementations.
Notionally, Cerillion appears to have at least a dozen rivals such as Ericsson and SAP, and this is quite a fast-moving industry. Yet management asserts “compelling operational advantages” to our “productised” and “as-a-service” approach “...the business remains highly differentiated against the other providers in the marketplace”.
Strictly, however, you should not pay a significant premium for said intangible benefit over what it achieves by way of financial record.
I first drew attention to Cerillion as a "buy" at 245p in April 2020, the again at 820p in April 2022 after it had already powered from around 100p in 2016. Investors were salivating over mid-20% revenue growth rates plus operational gearing – where the rate of profits growth is magnified relative to revenue.
Since an all-time high of 1,970p last August, things have got more complicated. Last October I wrestled arguments to conclude with an overall “hold” stance at around 1,800p in a nod to ongoing long-term potential, noting the shares “remain exposed to any disappointments, or simply buyer fatigue...I would at least ensure profits are taken to an extent you are comfortable with your risk appetite and portfolio balance. An outright sell-stance seems premature given Cerillion can still grow into its hefty valuation...be vigilant.”
The price broadly held to year-end, but the first quarter of 2025 showed failing rallies, as if sentiment was weakening. Yet for what support levels on a long-term chart are worth, Cerillion’s strong rally from 1,230p tested and affirmed an upward trend.
One way of resolving this dilemma is to consider whether I would invest afresh? I think not as an investment than a trade (as buyers have done well lately), and if that is shared by a majority, then it explains the weakening first-quarter chart as long-term holders get edgy and keen to preserve gains. Cerillion must show it can once again deliver earnings growth above 20%.
Britain’s renewal of EU relations could be bull factor
This may be clutching at straws given it is still hard to define why a software group should be better off in Europe, but it is the sort of thing that could help when a small company can more easily transform its finances with a few key contracts.
I thus strain to find reasons to marginally justify retaining a “hold” stance when I would be happier is this share was on a maximum 20x PE than 30x.
In these situations, it can be helpful to see how insiders are trading, which lately shows a lack of buying. Perhaps it is only understandable, various directors locked in gains late last year – in the order of 5,000 and 10,000 lots of shares – but the CEO’s selling of 27,000 at 1,910p last November is notable.
On valuation I think Cerillion rates a “sell” albeit potentially premature as to where this business could be in five to ten years’ time – also as a takeover candidate (but at what premium?).
So decide your risk preference as there is no room for upset here. I tilt towards a “sell” stance overall, but not to sell out completely. Wider market optimism in response to President Trump’s moderate climb-down on tariffs looks overdone, and I suspect Cerillion may trade volatile sideways at best – unless it can improve consensus forecasts come November’s annual results.
Edmond Jackson is a freelance contributor and not a direct employee of interactive investor.
These articles are provided for information purposes only. Occasionally, an opinion about whether to buy or sell a specific investment may be provided by third parties. The content is not intended to be a personal recommendation to buy or sell any financial instrument or product, or to adopt any investment strategy as it is not provided based on an assessment of your investing knowledge and experience, your financial situation or your investment objectives. The value of your investments, and the income derived from them, may go down as well as up. You may not get back all the money that you invest. The investments referred to in this article may not be suitable for all investors, and if in doubt, an investor should seek advice from a qualified investment adviser.
Full performance can be found on the company or index summary page on the interactive investor website. Simply click on the company's or index name highlighted in the article.
Disclosure
We use a combination of fundamental and technical analysis in forming our view as to the valuation and prospects of an investment. Where relevant we have set out those particular matters we think are important in the above article, but further detail can be found here.
Please note that our article on this investment should not be considered to be a regular publication.
Details of all recommendations issued by ii during the previous 12-month period can be found here.
ii adheres to a strict code of conduct. Contributors may hold shares or have other interests in companies included in these portfolios, which could create a conflict of interests. Contributors intending to write about any financial instruments in which they have an interest are required to disclose such interest to ii and in the article itself. ii will at all times consider whether such interest impairs the objectivity of the recommendation.
In addition, individuals involved in the production of investment articles are subject to a personal account dealing restriction, which prevents them from placing a transaction in the specified instrument(s) for a period before and for five working days after such publication. This is to avoid personal interests conflicting with the interests of the recipients of those investment articles.