Stockwatch: has market mood really shifted for these two shares?
After a difficult few years, both these companies have found a new lease of life. Analyst Edmond Jackson studies recent market developments and reassesses their potential.
30th May 2025 11:15
by Edmond Jackson from interactive investor

In recent weeks many shares have re-rated or even spiked. Sceptics say that equity markets are getting ahead of reality and the bond market has a more considered view. But this week’s ruling by a US federal court, putting Congress ahead of President Donald Trump on deciding tariffs, shows equity market rallies are justified, pricing in his more radical tariff actions being likely rolled back.
- Learn with ii: Cash ISA vs Shares ISA | Can you Transfer Shares into an ISA? | Transfer a Stocks & Shares ISA
Yes, an appeals court has already granted the White House a temporary suspension from the lower court's order. But it shows how the tussle is now on - that Trump does not have support on this from the business community, meaning opponents of the tariffs will be emboldened, which could prove a tipping point.
Two particular UK share examples are relevant to show how, in a one-year context, the latest “euphoria” is actually more like a mean-reversion (near) to where they were trading before the tariffs paranoia kicked off.
Has Jupiter reached fair value or can it go higher?
At near 92p, mid-cap Jupiter Fund Management (LSE:JUP) has regained October 2023 levels after a long fall from over 500p in 2017 which continued from 75p this year down to 67p by early April. There appeared a brief “double bottom” when Trump unveiled his tariffs. Asset outflows have been Jupiter’s chief problem, accentuated by weak markets ahead of the tariff announcements.
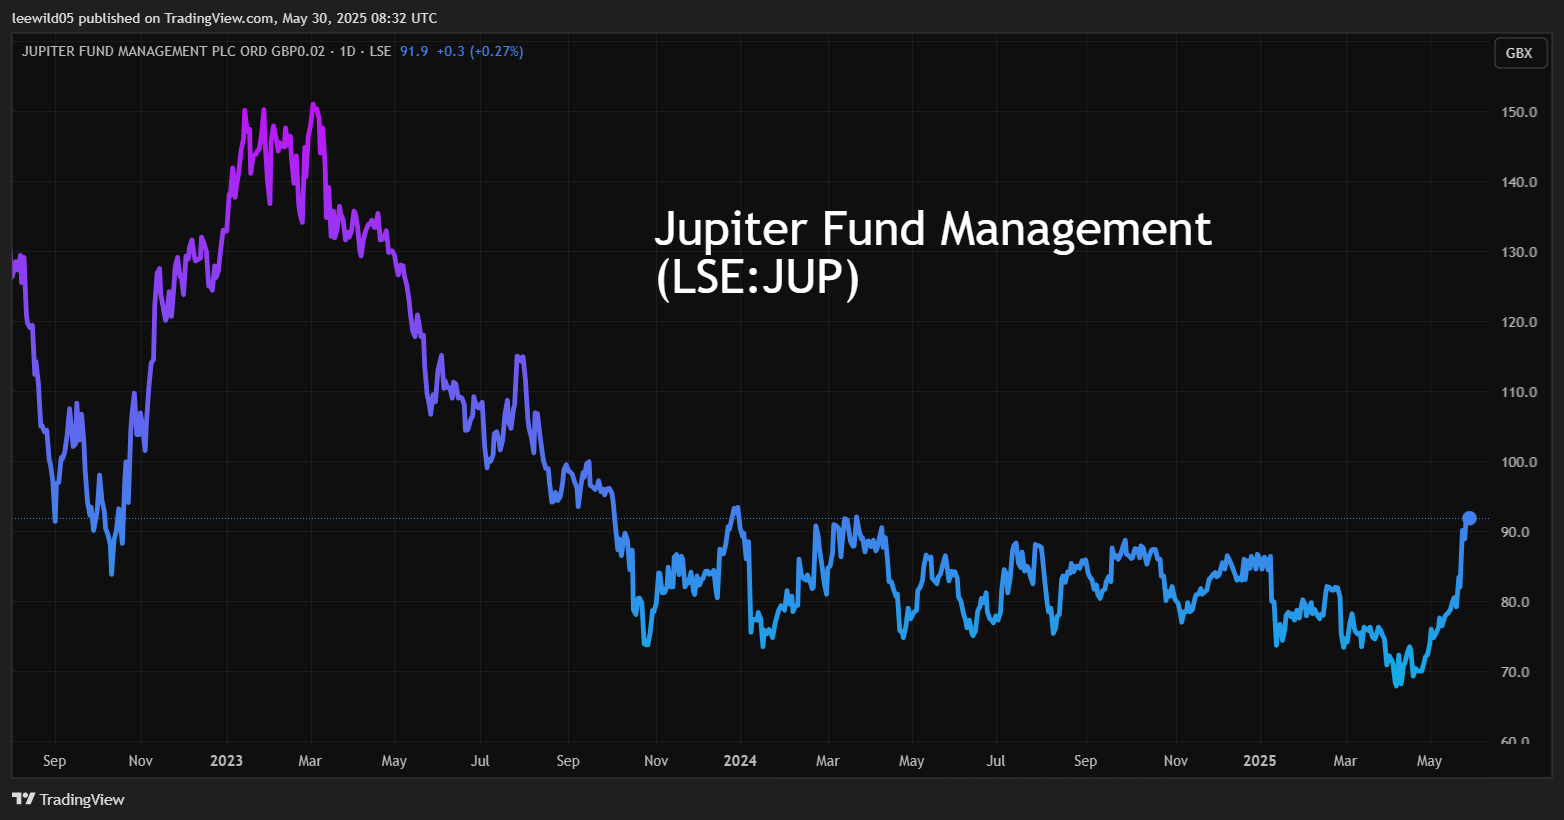
Source: TradingView. Past performance is not a guide to future performance.
The bugbear has been asset outflows, with some investors (also in these shares) questioning if active managers have much of a role nowadays versus passive and exchange-traded funds (ETFs), unless performance is consistently top tier.
A first-quarter 2025 trading update showed group assets under management (AUM) falling £1.0 billion to £44.3 billion, driven by £0.5 billion net outflows and £0.5 billion negative market movements. Obviously, April onwards showed high volatility both ways.
There was a silver lining in £1.0 billion net positive flows from institutional money, albeit £1.5 billion net outflows in retail as people became more risk averse.
Then a 22 May update cited £15 million further cost savings to be implemented no later than end-2026 and estimated AUM of £45 billion. Net inflows in the second quarter being broadly flat, with “re-building of momentum in the institutional channel” implying a loss still from individuals. A key question seems to be whether people will return to such funds or increasingly look to passives and/or make their own share decisions.
- Ask ii: what are active ETFs and why are they being launched?
- Time to be bullish or bearish? Five pros give their take
But it shows the strength of current sentiment, how Jupiter’s share price jumped 8% on Wednesday simply in response to Peel Hunt modestly upgrading from “hold” to “add” with a 90p target, which has already been exceeded. Back in February, Deutsche Bank similarly had a “hold” stance, targeting 95p.
It effectively marks a mean-reversion only to 2023 levels, yet sentiment in Jupiter has not twitched so positively since autumn 2022. Since that proved a false dawn (the company’s numbers deteriorated in 2023), it reminds us to await more evidence if you want to be reasonably sure.
As both episodes indicate, however, the market is often keen to anticipate, and asset management shares are effectively a geared play on markets (revenues rise versus relatively fixed costs apart from staff bonuses).
Given earnings per share (EPS) forecasts show a near halving to about 6.8p in respect of this year and flat for 2026, the implied price/earnings (PE) ratio is 13.5x and prospective yield 3.6%, which looks about right considering earnings are relatively uncertain.
It appears – as with US trade tariffs from later April – that the market is looking past the current scenario to reckon this may broadly represent “trough earnings”, where analysts are prone to cop out with flat forecasts.
- BP, Shell, Rolls-Royce, HSBC and L&G pay big dividends in June
- Sign up to our free newsletter for investment ideas, latest news and award-winning analysis
The bull case for asset management shares generally, is the sheer wealth power of the baby boomer generation needing to deploy it in financial assets. Every significant dip in markets seems to get keenly bought. This week, it was interesting to hear Ed Yardeni, a long-term bull of US equities who has been proven, overall, right since the 2008 crisis, and especially during the last month or so, reiterate this demographic argument in interviews.
I am among those more cautious analysts who would reckon on “hold” after this jump, given prospects for active managers may still be in question – at least among retail investors, who quite often are the main clientele. But I recognise there’s scope to take a more positive view if longer-term earnings can recover to somewhere median even - EPS levels were above 20p pre-2022 and projected to be below 7p currently.
Jupiter Fund Management - financial summary
Year-end 31 Dec
| 2016 | 2017 | 2018 | 2019 | 2020 | 2021 | 2022 | 2023 | 2024 | |
| Turnover (£ million) | 402 | 460 | 461 | 419 | 501 | 618 | 444 | 406 | 403 |
| Operating margin (%) | 42.6 | 41.9 | 38.9 | 36.5 | 27.5 | 30.8 | 14.5 | 2.4 | 21.5 |
| Operating profit (£m) | 171 | 193 | 179 | 153 | 138 | 191 | 64.3 | 9.8 | 86.3 |
| Net profit (£m) | 136 | 155 | 143 | 123 | 105 | 150 | 47.9 | -12.9 | 65 |
| Reported EPS (p) | 29.6 | 33.7 | 31.1 | 26.8 | 20.8 | 26.9 | 8.9 | -2.5 | 12.2 |
| Normalised EPS (p) | 29.7 | 33.8 | 31.5 | 28.9 | 23.5 | 29.0 | 9.5 | 7.4 | 12.7 |
| Earnings per share growth (%) | 3.9 | 14.1 | -6.9 | -8.3 | -18.7 | 23.5 | -67.2 | -22.1 | 71.3 |
| Return on capital (%) | 27.7 | 29.7 | 28.0 | 22.2 | 13.3 | 17.9 | 6.5 | 1.1 | 9.1 |
| Operating cashflow/share (p) | 32.0 | 42.3 | 37.1 | 32.7 | 20.7 | 34.0 | 30.1 | 16.9 | 13.8 |
| Capex/share (p) | 0.8 | 1.1 | 0.7 | 0.8 | 0.5 | 0.6 | 1.0 | 0.7 | 1.4 |
| Free cashflow/share (p) | 31.2 | 41.2 | 36.4 | 31.9 | 20.2 | 33.4 | 29.1 | 16.2 | 12.4 |
| Dividend per share (p) | 14.7 | 17.1 | 17.1 | 17.1 | 17.1 | 17.1 | 8.4 | 6.9 | 5.4 |
| Covered by earnings (x) | 2.0 | 2.0 | 1.8 | 1.6 | 1.2 | 1.6 | 1.1 | -0.4 | 2.3 |
| Cash (£m) | 331 | 368 | 390 | 391 | 441 | 497 | 445 | 499 | 549 |
| Net debt (£m) | -317 | -332 | -316 | -333 | -337 | -397 | -349 | -405 | -458 |
| Net assets (£m) | 610 | 640 | 624 | 612 | 886 | 901 | 843 | 790 | 834 |
| Net assets/share (p) | 133 | 140 | 136 | 134 | 160 | 163 | 154 | 145 | 153 |
Source: historic company REFS and company accounts.
Risk appetite jumps in Frontier Developments too
Besides an asset manager that has “had issues”, another classic sign of bullish sentiment is a similar jump in a video games publisher where much depends speculatively on hopes for the next big release.
Frontier Developments (LSE:FDEV) saw its share price jump 9% to 250p last Wednesday after an update for its financial year to 31 May cited a minor improvement in revenue to £90 million, albeit ahead of previous guidance for £85-89 million. This together with a (frankly exceptional) £3.5 million gain from the sale of Stranded: Alien Dawn implies better-than-expected annual profits and net cash.
That to me says little about an improvement in fundamentals despite my having rated this share as a “buy” last September at around 230p. Showing similarly how it can be sentiment-driven, the price tested 300p by November but was down to 185p mid-January before trading volatile-sideways until spiking this May:
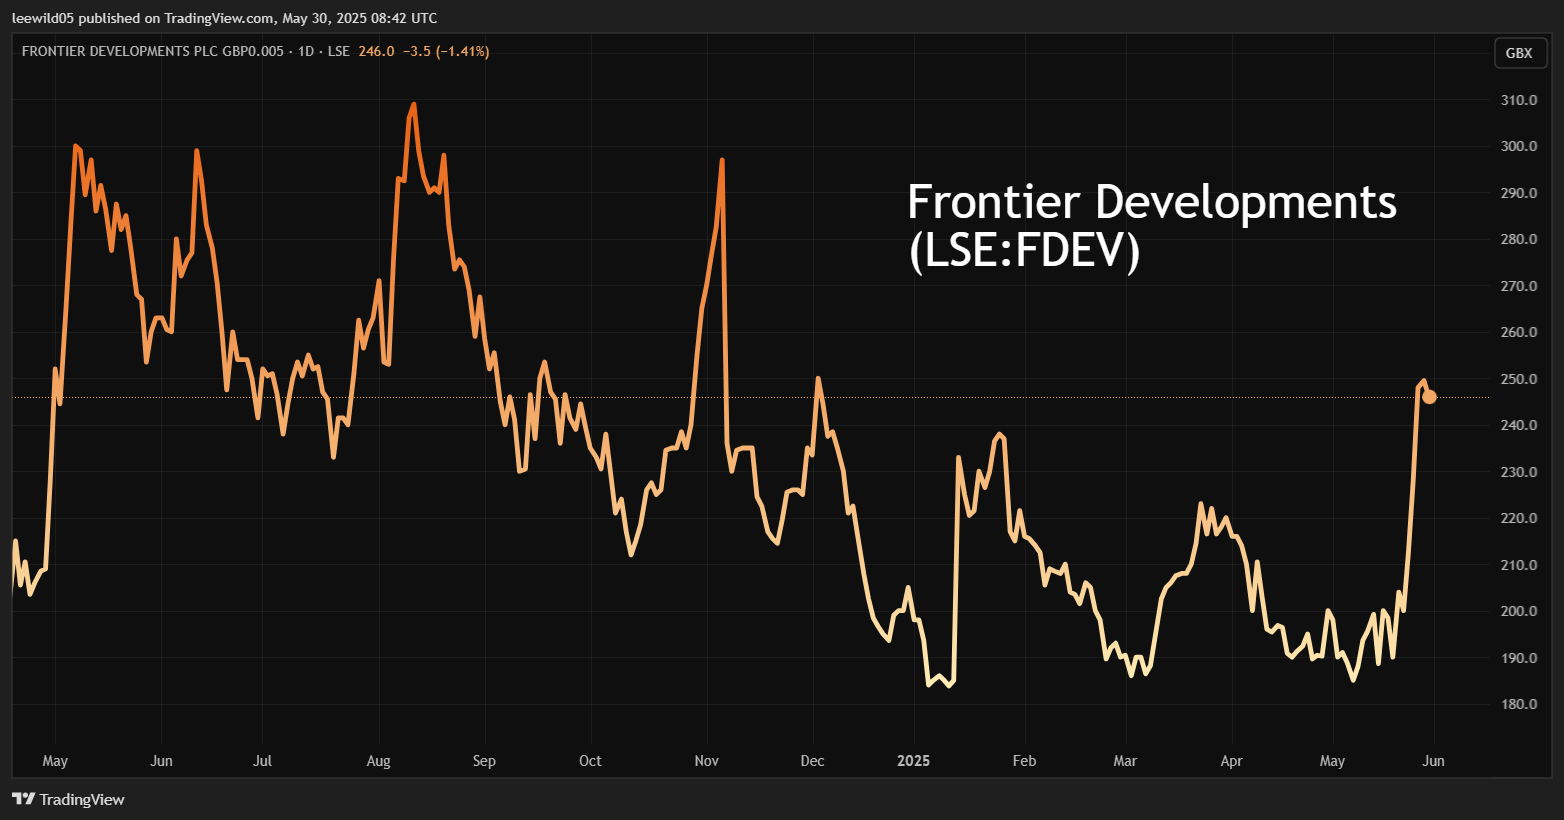
Source: TradingView. Past performance is not a guide to future performance.
Similarly, as with Jupiter, this kind of “risk-on” share is yet to properly – and sustainably - break out of its range of the past year. Frontier as a company was anyway only expected to be around break-even, with analysts copping out of much view on its May 2026 year. They predict only a 2% revenue advance to £92 million and net profit slipping below £3 million (although that would constitute genuine profitability given that it would not reflect a disposal).
It means a whopping PE well over 100x but relative to a market value below £100 million – of which 28% represented cash, as of last November – this can radically improve as shown by EPS above 50p in the May 2021 year:
Frontier Developments - financial summary
year end 31 May
| 2016 | 2017 | 2018 | 2019 | 2020 | 2021 | 2022 | 2023 | 2024 | |
| Turnover (£ million) | 21.4 | 37.4 | 34.2 | 89.7 | 76.1 | 90.7 | 114 | 105 | 89.3 |
| Operating margin (%) | 5.8 | 20.9 | 8.2 | 21.6 | 21.8 | 22.0 | 1.4 | -25.4 | -31.8 |
| Operating profit (£m) | 1.2 | 7.8 | 2.8 | 19.4 | 16.6 | 19.9 | 1.5 | -26.6 | -28.4 |
| Net profit (£m) | 1.4 | 7.7 | 3.6 | 18.0 | 15.9 | 21.6 | 9.6 | -20.9 | -21.5 |
| Reported EPS (p) | 4.1 | 22.4 | 9.1 | 44.7 | 39.4 | 53.3 | 23.7 | -53.6 | -55.6 |
| Normalised EPS (p) | 4.1 | 22.4 | 9.1 | 44.7 | 39.4 | 53.3 | 35.6 | -23.4 | -53.2 |
| Return on total capital (%) | 5.1 | 23.5 | 5.0 | 25.6 | 13.0 | 13.9 | 1.1 | -22.4 | -28.4 |
| Operating cashflow/share (p) | -3.6 | 13.5 | 25.9 | 81.5 | 80.4 | 96.3 | 101 | 123 | 81.9 |
| Capex/share (p) | 1.0 | 2.3 | 46.0 | 42.9 | 53.8 | 81.2 | 95.4 | 111 | 78.7 |
| Free cashflow/share (p) | -4.6 | 11.2 | -20.1 | 38.6 | 26.6 | 15.1 | 5.6 | 12.0 | 3.2 |
| Cash (£m) | 8.6 | 12.6 | 24.1 | 35.3 | 45.8 | 42.4 | 38.7 | 28.3 | 29.5 |
| Net debt (£m) | -8.6 | -12.6 | -24.1 | -35.3 | -22.2 | -20.3 | -18.0 | -9.0 | -8.2 |
| Net assets (£m) | 22.8 | 31.3 | 55.3 | 74.2 | 96.7 | 113 | 118 | 96.0 | 76.8 |
| Net assets/share (p) | 66.8 | 91.4 | 143 | 192 | 249 | 288 | 300 | 243 | 195 |
Source: historic company REFS and company accounts.
Again, as with Jupiter, we are not necessarily hoping for a return to past great financial years, rather we’re asking what are the odds that the company can at least “median revert” somewhere between. For a typical “growth” PE around 20x, Frontier needs EPS of 12p. Part of the intrigue is market cap currently a modest 1.1x revenue and the shares also at 1.2x net asset value. So, if with operational gearing, margins can increase anywhere to near 20% as was surpassed before 2022, then yes, the PE can fall sharply.
That goodwill/intangibles constituted 54% of last November’s £82.4 million net assets, was reasonable considering Frontier is effectively an intellectual property company.
- Trading Strategies: why stock market gains could be ahead
- Sector Screener: expect further capital gains from this pair
The next big release is Jurassic World Evolution 3, featuring swimming dinosaurs, which could launch anytime between this June and next May. However, the next serial film, Jurassic World Rebirth, is due to launch in the UK on 2 July, so hopefully Frontier does not miss a marketing trick to coincide with the film release.
It is therefore a more speculative share than Jupiter but where qualitatively it seems possible – with good games' launches – to radically improve earnings with creative and execution skills. Meanwhile, a retail-oriented asset manager really needs to dispel scepticism about actively managed funds, and it seems early days for that.
I therefore retain a “buy” stance on Frontier, reiterating that it is strictly not investment grade.
Edmond Jackson is a freelance contributor and not a direct employee of interactive investor.
AIM stocks tend to be volatile high-risk/high-reward investments and are intended for people with an appropriate degree of equity trading knowledge and experience.
These articles are provided for information purposes only. Occasionally, an opinion about whether to buy or sell a specific investment may be provided by third parties. The content is not intended to be a personal recommendation to buy or sell any financial instrument or product, or to adopt any investment strategy as it is not provided based on an assessment of your investing knowledge and experience, your financial situation or your investment objectives. The value of your investments, and the income derived from them, may go down as well as up. You may not get back all the money that you invest. The investments referred to in this article may not be suitable for all investors, and if in doubt, an investor should seek advice from a qualified investment adviser.
Full performance can be found on the company or index summary page on the interactive investor website. Simply click on the company's or index name highlighted in the article.
Disclosure
We use a combination of fundamental and technical analysis in forming our view as to the valuation and prospects of an investment. Where relevant we have set out those particular matters we think are important in the above article, but further detail can be found here.
Please note that our article on this investment should not be considered to be a regular publication.
Details of all recommendations issued by ii during the previous 12-month period can be found here.
ii adheres to a strict code of conduct. Contributors may hold shares or have other interests in companies included in these portfolios, which could create a conflict of interests. Contributors intending to write about any financial instruments in which they have an interest are required to disclose such interest to ii and in the article itself. ii will at all times consider whether such interest impairs the objectivity of the recommendation.
In addition, individuals involved in the production of investment articles are subject to a personal account dealing restriction, which prevents them from placing a transaction in the specified instrument(s) for a period before and for five working days after such publication. This is to avoid personal interests conflicting with the interests of the recipients of those investment articles.