Stockwatch: what this warning for stock market investors really means
13th May 2022 08:18
by Edmond Jackson from interactive investor
As a broad US index falls below a key technical support level and experts talk of a mass exodus from equities,analyst Edmond Jackson assesses the global investment outlook, the future for equities and containing the inflation genie.

Now is a fascinating time to test the validity of technical analysis. Two days ago, the S&P 500 index dropped to 3,935 – below a key call ofthe 4,000 level made by Bank of America (BofA) strategists at the end of April.
Using comparative data across markets and asset classes from Emerging Portfolio Fund Research (EPFR), the BofA team argued a drop below 4,000 would be a “tipping point”, potentially triggering a mass exodus from equities.
Yesterday, the S&P 500 continued below 3,860 shortly before 3pm local time, then rallied to 3,930.
When BofA’s note was published, the index was around 4,200, so their call starts to look prescient. One benchmark is EPFR data showing 4,274 as the average entry point for $1.1 trillion (£900 billion) by equity funds since the start of 2021.
This April saw the worst outflows from equity funds since March 2020, hence some of that would have contributed to dumping stocks. I find it debatable whether fund managers have a net counter-balancing effect on market swings, or quarterly performance measurement and league tables mean they accentuate them.
Annualised total equity returns adjusted for inflation are worst since 1974
Investors are grappling with aggressive monetary tightening by the US Federal Reserve in response to soaring inflation, hence also fears of recession.
The S&P 500 is down 18% this year, which adjusted for inflation is the worst annual return so far since 1974. Bonds, however, have suffered the chief exodus, with global government debt on course for the biggest loss since 1920.
- What Rolls-Royce just told shareholders at this year's AGM
- Recessions are becoming more likely – here’s how to invest
- How this investor is fighting fear amid market turbulence
- The benefits of buying shares in a resilient global brand
Noting central banks’ shift from quantitative easing to quantitative tightening, the BofA strategists say a relief rally is possible but, amid depressed sentiment, it will not be a big rebound and investors should sell it.
They compare the current situation to 1973-1974 during Richard Nixon’s presidency and argue: “high inflation means the Fed must tighten until it breaks the economy or the market. Until it does, asset prices must reset lower.”
Central banks now recognise their group-think failure
I think this is a key element of recent change. Most central banks casually dismissed inflation as “transient” and due to Covid’s disruption of supply chains, not loose monetary policy.
They forgot Milton Friedman’s key insight during the 1970s: “inflation is always, everywhere, a monetary phenomenon.”
Instead, they fell for recently fashionable “modern monetary theory” – colloquially cited as “MMT” – which argues for vigorous creation of new money, then controlling inflation by taxes.
The impracticality is shown by the UK’s tax burden continuing to set record levels, yet inflation is expected to continue up to 10%.
Paraphrasing John Maynard Keynes’ remark from 1936, it looks as if we are already slaves to some (soon-to-be) defunct economist.
What is different now, compared with the “buy the drop” mantra which worked so well since the 2008 crisis, is central banks no longer being able to turn on the monetary spigot at every crisis.
A generation of investors became used to this, illustrating a flaw with inductive reasoning. Happy pigs associate daily sight of the farmer as meaning food, but one day they get slaughtered.
Confusion and fear thus abound.
Can central banks now genuinely contain inflation?
The 1970s showed that once the inflation genie is out the bottle, it is very hard to contain.
Recalling the incoming Thatcher administration in 1979, interest rates rose to 17% triggering the early 1980s recession which devastated much of UK manufacturing industry.
In recent weeks I have read arguments by US “Fed watchers”, some saying it will now confront inflation irrespective of wider consequences – quite as the UK did.
Yet interest rates rising towards 2% are nothing like what was required over 40 years ago.
- FTSE 100 and reaction to latest US inflation shock
- Warren Buffett: stocks I’m buying and AGM comments
- Want to buy and sell international shares? It’s easy to do. Here’s how
It is true how in the 1970s trade union wage-bargaining was more powerful than it is now, although skills shortages, including post-Brexit lack of key workers from Europe, has in its own way boosted wages selectively. If wage rises get ingrained, then so does inflation.
A further dilemma is expansion of private and public debt in the last 15 years or so – central banks are responsible for, due to ultra-low interest rates – meaning rates cannot now be raised significantly without causing a bust.
Optimists argue, inflation will have a self-fulfilling effect of tempering economic demand, hence US inflation is already peaking and the UK will do so later this year.
Yet BofA is not alone with a medium-term bearish view. Morgan Stanley anticipates stocks being lower from here, one year out, amid economic and earnings uncertainties. It counsels staying defensive.
Long-term S&P 500 chart affirms the warning
Mean-reversion looks due if technical analysis means anything.
The index’s bull-run from 827 in January 2009 to 3,338 on 21 February 2020 was pretty much linear.
Then in response to Covid, governments and central banks unleashed colossal economic stimulus and the S&P 500 trend-line steepened – in a new linear fashion – from 2,711 on 13 March 2020 to 4,595 last 26 November.
This Covid-induced rally has looked exotic – where in chart terms, reversion to a mean long-term uptrend would imply retreat to roughly 3,500, i.e. near 11% further downside.
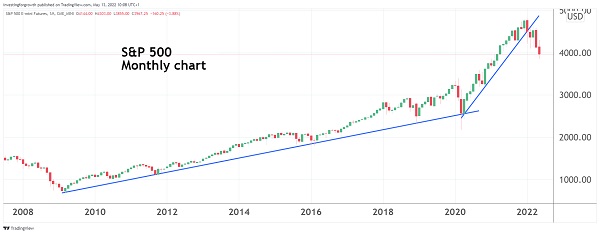
Source: TradingView. Past performance is not a guide to future performance.
Yet equities are still a preferred asset class
So-called “perma-bears” have questioned the rally back to at least 2012, because QE persisted far too long beyond dealing with the 2008 financial crisis.
Pundits such as Jeremy Grantham, the octogenarian British investor and co-founder of Boston-based GMO Asset Management, have argued a retracement more like 40% is possible; and John Hussman, a US economist and fund manager, continues to reckon on 80% over a complete market cycle.
The “perma-bear” accusation could be seen as coming from those with their own distorted perceptions due to the QE years. Yet if you had followed the likes of Grantham then you would have been light on equities pretty much since 2014.
Reasons to be cheerful about equities
Within market volatility, shares in traditional industries such as defence, banks, utilities and smoking are likely to gain attraction both as an inflation hedge and for yield.
That assumes, however, my point about how the risk-free rate of interest cannot rise materially versus inflation without causing worse economic trouble.
If stocks trend lower but rate rises are mitigated, the appeal of equity yields will be reinforced.
- 60 reasons to sell your UK shares
- How to invest for difficult times
- BRICs: is the famous investment acronym no longer fit for purpose?
- Eight star fund managers you can buy on the cheap
With fresh money, the main issue is timing. Remember, a market low is only apparent with hindsight.
Industry and private equity investors would also capitalise on an equities slump to make takeovers. Mid cap HomeServe HSV has already been in play since late March. Depressed sterling is a boon for overseas buyers.
A great deal of cash rots away on bank deposit and ongoing pension contributions need to find a home. When markets stabilise, buyers are certain.
I must of course beware repeating President Hoover’s “fundamentals remain sound” remark as the 1929 Wall Street Crash got underway, which led to the Great Depression.
Much will depend in months ahead, on how company earnings releases pan out – besides the wider economy.
Oversold situations could arise, hence opportunities for near-term trading or averaging-in.
Edmond Jackson is a freelance contributor and not a direct employee of interactive investor.
These articles are provided for information purposes only. Occasionally, an opinion about whether to buy or sell a specific investment may be provided by third parties. The content is not intended to be a personal recommendation to buy or sell any financial instrument or product, or to adopt any investment strategy as it is not provided based on an assessment of your investing knowledge and experience, your financial situation or your investment objectives. The value of your investments, and the income derived from them, may go down as well as up. You may not get back all the money that you invest. The investments referred to in this article may not be suitable for all investors, and if in doubt, an investor should seek advice from a qualified investment adviser.
Full performance can be found on the company or index summary page on the interactive investor website. Simply click on the company's or index name highlighted in the article.
Disclosure
We use a combination of fundamental and technical analysis in forming our view as to the valuation and prospects of an investment. Where relevant we have set out those particular matters we think are important in the above article, but further detail can be found here.
Please note that our article on this investment should not be considered to be a regular publication.
Details of all recommendations issued by ii during the previous 12-month period can be found here.
ii adheres to a strict code of conduct. Contributors may hold shares or have other interests in companies included in these portfolios, which could create a conflict of interests. Contributors intending to write about any financial instruments in which they have an interest are required to disclose such interest to ii and in the article itself. ii will at all times consider whether such interest impairs the objectivity of the recommendation.
In addition, individuals involved in the production of investment articles are subject to a personal account dealing restriction, which prevents them from placing a transaction in the specified instrument(s) for a period before and for five working days after such publication. This is to avoid personal interests conflicting with the interests of the recipients of those investment articles.