Trusts to help diversify the bond exposure
High-yield bonds outperformed equities in the recovery from 2008, but can they repeat the trick, asks Kepler Trust Intelligence.
24th May 2024 13:58

This content is provided by Kepler Trust Intelligence, an investment trust focused website for private and professional investors. Kepler Trust Intelligence is a third-party supplier and not part of interactive investor. It is provided for information only and does not constitute a personal recommendation.
Material produced by Kepler Trust Intelligence should be considered a marketing communication, and is not independent research.
Let’s get one thing clear: in bond land, 10 bps is a lot. That is one-tenth of a per cent to you. A bond fund manager who can outperform his peers by 10 bps is a king.
In this world, the 19,000 extra bps (190% to me and you) that have been earned by being in high-yield bonds rather than equities since the great financial crisis (GFC) are the riches of Croesus.
- Invest with ii: How Bonds & Gilts work | Free Regular Investing | Open a Stocks & Shares ISA
Following three successive months in which Investment Association (IA) funds saw net outflows across equity, fixed income and mixed asset, March 2024 saw a huge surge of cash jump back into bonds. Net retail sales of fixed income funds hit £809 million in the month, while equity funds saw just £149 million flow in and mixed asset funds saw outflows.
Given how strongly fixed income performed after the last crisis, are investors right to be buying back into bonds, and could they repeat their stunning performance?
Do bonds offer attractive returns?
They say a picture paints a thousand words, so let’s start with a chart. The graph below shows returns to UK high-yield bonds and UK equities from the bottom of the 2007-08 great financial crisis.
If you had gone 100% into UK high-yield bonds in March 2009, you would be up 500% since then, and have about 60% more money than if you had invested 100% in UK equities. You would have actually outperformed the S&P 500 index until August 2017 too.
UK EQUITIES VS UK HY BONDS
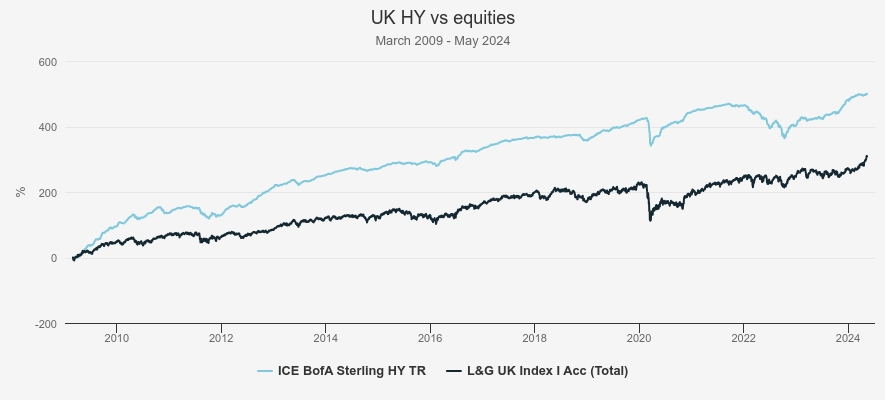
Source: Morningstar. Past performance is not a reliable indicator of future results
The cumulative relative return chart shows that much of this outperformance was earned at the start of the period. After a brief retrenchment, high yield outperformed equities by around another 20 percentage points up to mid-2020, before adding even more to relative returns by the start of 2021. Some of these gains have been given back since.
RELATIVE RETURNS OF UK EQUITIES VS HY
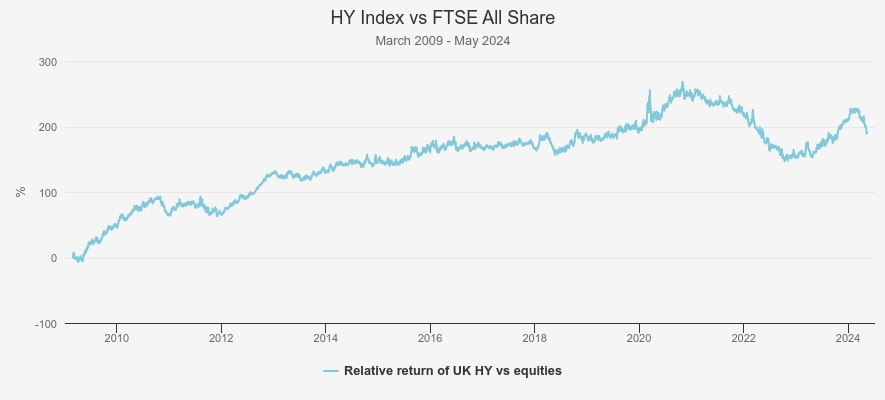
Source: Morningstar. Past performance is not a reliable indicator of future results
So, is this an investment strategy? Equity markets are now off their post-pandemic lows, but bonds have double dipped. Investors have been increasingly positive on fixed income, with the IA recording massive inflows in March from both retail and professional investors. Anecdotally, we hear that wealth managers have also been adding to fixed income in recent months.
We think there are three reasons that this time is likely to be different, investors should be wary of chasing yield in bonds, and a fixed income bucket should probably remain diversified.
1) The first point is that credit spreads were the source of a greater proportion of the return on offer from bonds in 2009 than they are today. UK rates had been cut from 5.75% at the end of 2007 to 2% at the end of 2008, and were at just 1% when our period starts, so almost all the yield on offer in sterling bonds was from credit spreads. Today, UK rates sit at 5.25% and high yield bonds yield around 7% at the index level, so are only offering an additional 175bps return a year for credit risk.
In the US market, the picture is even worse, with the USD market offering less than 100 bps of additional spread over short-term rates. In other words, there isn’t a lot of scope for an improving picture for the economy or for corporate earnings to be reflected in bond fund returns. This time round, a vastly greater proportion of returns are likely to be due to duration – i.e. movements in interest rates.
The picture is even worse in the sterling investment grade sector, which retail investors are currently favouring (going by IA data). Here yields are only around 5.4%, meaning only a few bps are on offer for taking the credit risk of lending to a company rather than HMG. Even a bond fund manager would struggle to get excited about that. Our first point is that bonds don’t offer much extra return over short-term money market funds, i.e. cash.
2) The second point is that the rate outlook looks bumpy. A cut seems more likely than a raise at the next BoE meeting, but even that is now less certain in the US, after some strong data. Better economic data would be good for credit spreads, but as discussed above, there is more limited scope for these to tighten and deliver returns. Better economic data would suggest higher inflation, which would see rates stay high or be hiked, which would see a greater, negative impact on bonds through duration.
Your author suggested that central banks were underestimating the persistence of inflation in early 2022 by anchoring on the past cycle. Now there is a danger that investors are anchoring on the secure glide path down in rates developed market rates saw after the debt binge of the 2000s. Keeping monetary policy as loose as possible worked well in the deflationary world in the 2010s, but inflation is proving more persistent in this cycle.
Rearmament, massive spending on net-zero initiatives, those initiatives’ vast demand for metals and minerals and the huge costs of reorganising supply chains in the light of geopolitical tensions are all inflationary. The political climate is also different. In the 2010s, austerity was a message that plenty of people were listening to, but these days it is about as popular as a country that has apparently won two world wars and one world cup at a camp song contest.
3) There is another reason why returns are likely to be lower in this cycle, for high yield in particular. At the height of the GFC, many banks were forced to issue debt at eye-wateringly high yields. This subordinated debt was essentially emergency funding, with lenders taking a massive mark-up for taking the risk of being last in the queue to get paid back, while the solvency of developed world banks was in doubt.
To take an extreme example, Barclays (LSE:BARC) issued £3 billion in debt, which paid a 14% coupon, in perpetuity. As the banking system settled down and these bonds de-risked, they helped deliver outstanding returns to those managers who were brave enough to buy in (and enough bps of alpha to buy a Lambo in some cases).
This dynamic is absent from the current market, as our recent crisis was caused by the impact of the pandemic and the subsequent inflation rather than any issues in credit markets. In fact, the banking industry looks pretty healthy, and is benefitting from a higher net interest margin thanks to high short-term rates.
How can we protect ourselves against the risks in the bond market?
For these reasons, we would be wary of committing exclusively to the conventional bond market, and would want to diversify this exposure with shorter-duration assets or those with less credit risk. In our view, the current rate outlook makes taking a punchy position in duration questionable.
The UK corporate bond market has a duration of circa 6 at the time of writing, meaning that a loss of 6% would be expected for a 100 bps parallel shift in the yield curve. This is down from pre-crisis, thanks to the effect of the sell-off in prices, but means there are significant downside risks in the event of a resurgence in inflation. If inflation is accompanied by high nominal GDP growth, then this could be good for credit spreads, but they are already extremely narrow, so there is little to be gained there, and any rate hike effect should be far greater.
On the other hand, if we end up with runaway inflation and a recessionary environment, there is the potential for bonds and equities to sell off together as they did in 2022. While this danger seems to have receded, it has not gone away entirely, and in particular the ever-worsening geopolitical situation, and the current conflicts in Ukraine and Israel, offer one route to this outcome.
We think that investors could profit by being diversified in the bond sleeve of their portfolio. This can be done through more unconventional fixed income products. For example, M&G Credit Income Investment Ord (LSE:MGCI) invests in private as well as public debt markets, generating a very high yield without taking on the credit risk of a high-yield fund.
The portfolio is majority floating rate, meaning that investors effectively earn the UK short-term interest rate plus a spread. This spread is wider than it would be for a portfolio of public investments of similar credit risk, typically due to the extra yield that can be earned for the illiquidity and complexity of the private deals.
We explain the model in full in our recent note. Key points to note are that any rate hikes would actually boost the yield on offer from the fund without seeing much impact at all on the price. We think the trust offers an attractive way to hedge the risks to the current recovery narrative. Annualising the last quarterly dividend, the historical yield is circa 9.3%, achieved without the use of any gearing, while trading on a discount of 1.4%.
Sequoia Economic Infrastructure Inc Ord (LSE:SEQI)also operates in the private debt space. SEQI owns a highly diversified portfolio of loans made to infrastructure projects. These are spread across digital infrastructure, power and renewables projects, transport and other sectors. These loans are mostly bilateral or made with a small group of lenders, allowing the management team to negotiate attractive terms to both parties.
It has circa 40% in floating rate loans which helps reduce the duration, although the managers have been increasing fixed rate debt at the margin as they can lock in higher rates than in the past. Duration is nonetheless very low, at 2.2 years versus 1.2 years for MGCI. The high yield is one factor that reduces the duration: the current ‘yield to worst’ on the portfolio (which includes an early capital return baked in, assuming borrowers take advantage of any early repayment options) is 10%, and this is without the use of gearing. SEQI’s shares currently yield 8.6% on a historical basis and trade on a 14% discount. We will be publishing a full note on the trust in the coming weeks; click here to be notified.
Another way to diversify the bond sleeve of a portfolio is via alternatives. Greencoat UK Wind (LSE:UKW) is the largest trust in the AIC Renewable Energy Infrastructure sector, and is large enough to have generated 1.5% of UK electricity demand in 2023. UKW owns wind farms, and takes on debt at the fund level to help generate an attractive yield, which is currently circa 7%. The board seeks to raise its dividend by at least the growth in RPI over any year, and has achieved this even through the recent inflationary surge.
We think this could be an attractive feature if inflation proves more persistent. The managers model a 10% levered portfolio IRR, made up of a circa 6% dividend yield on NAV and real NAV preservation by reinvesting excess cash flows. This offers a considerably higher spread over the base rate than bonds, albeit for taking more specific industry risk. UKW’s shares trade on a 10.6% discount to NAV at the time of writing, which also adds to the total return potential.
There is effective duration to consider, as rising rates would reduce the discount rate used to value the assets. But in our view the positive sensitivity of the NAV to inflation and rising power prices offsets this and means the trust offers an interesting diversification element to a bond or bond-plus sleeve. Key risks to consider in the coming years are the need to regear, and with rates higher this will likely be a slight headwind to the economics of the fund.
A more diversified option, albeit with a slightly lower expected returns, is TheRenewables Infrastructure Grp (LSE:TRIG). In our latest note we explain how TRIG has an expected NAV return of circa 8%. This is with some significant inflation-linkage however, meaning that a good proportion of returns should be considered real, unlike conventional bonds. The portfolio is highly diversified and getting more so. It is spread across six European countries (including the UK), bringing exposure to different subsidy regimes, with assets across offshore wind, onshore wind and solar.
Rising interest rates have hit the NAV over the past two years, but this has been offset to some extent by the impact of high inflation on asset values – over the next ten years, 51% of expected portfolio returns have an inflation link. It is worth noting that the inflation expectations TIG is using are currently lower than those of in the market, so this suggests prudence and the potential for write-ups should the market be right. Like UKW there are risks to the NAV should we see further rate hikes, but like UKW we think the offsetting features to bonds (which have this risk in spades) are highly attractive.
Conclusion
Bonds add a lot of value to a portfolio, and if they are bought when the conditions are right, can deliver exceptional returns. Their generally lower volatility than equities means that improvements to a portfolio’s risk-adjusted returns can be particularly striking. However, we think investors would be mistaken to commit entirely to conventional fixed income at this juncture – especially high yield, or long duration bond portfolios.
The outlook for rates and the pricing in the market means that significant risks abound and we think bonds are unlikely to perform as well as they did post GFC. On an income basis, we think there is a strong case to be made for diversification to avoid the heavy duration risk in conventional bond markets, while credit markets seem to have already baked in an economic recovery.
Bond-like alternatives look like attractive components of a diversified bond-like sleeve in a portfolio. In particular, the discounts they are currently trading on make them look cheap in our view, and add to the long-term return potential.
Kepler Partners is a third-party supplier and not part of interactive investor. Neither Kepler Partners or interactive investor will be responsible for any losses that may be incurred as a result of a trading idea.
These articles are provided for information purposes only. Occasionally, an opinion about whether to buy or sell a specific investment may be provided by third parties. The content is not intended to be a personal recommendation to buy or sell any financial instrument or product, or to adopt any investment strategy as it is not provided based on an assessment of your investing knowledge and experience, your financial situation or your investment objectives. The value of your investments, and the income derived from them, may go down as well as up. You may not get back all the money that you invest. The investments referred to in this article may not be suitable for all investors, and if in doubt, an investor should seek advice from a qualified investment adviser.
Full performance can be found on the company or index summary page on the interactive investor website. Simply click on the company's or index name highlighted in the article.
Important Information
Kepler Partners is not authorised to make recommendations to Retail Clients. This report is based on factual information only, and is solely for information purposes only and any views contained in it must not be construed as investment or tax advice or a recommendation to buy, sell or take any action in relation to any investment.
This report has been issued by Kepler Partners LLP solely for information purposes only and the views contained in it must not be construed as investment or tax advice or a recommendation to buy, sell or take any action in relation to any investment. If you are unclear about any of the information on this website or its suitability for you, please contact your financial or tax adviser, or an independent financial or tax adviser before making any investment or financial decisions.
The information provided on this website is not intended for distribution to, or use by, any person or entity in any jurisdiction or country where such distribution or use would be contrary to law or regulation or which would subject Kepler Partners LLP to any registration requirement within such jurisdiction or country. Persons who access this information are required to inform themselves and to comply with any such restrictions. In particular, this website is exclusively for non-US Persons. The information in this website is not for distribution to and does not constitute an offer to sell or the solicitation of any offer to buy any securities in the United States of America to or for the benefit of US Persons.
This is a marketing document, should be considered non-independent research and is subject to the rules in COBS 12.3 relating to such research. It has not been prepared in accordance with legal requirements designed to promote the independence of investment research.
No representation or warranty, express or implied, is given by any person as to the accuracy or completeness of the information and no responsibility or liability is accepted for the accuracy or sufficiency of any of the information, for any errors, omissions or misstatements, negligent or otherwise. Any views and opinions, whilst given in good faith, are subject to change without notice.
This is not an official confirmation of terms and is not to be taken as advice to take any action in relation to any investment mentioned herein. Any prices or quotations contained herein are indicative only.
Kepler Partners LLP (including its partners, employees and representatives) or a connected person may have positions in or options on the securities detailed in this report, and may buy, sell or offer to purchase or sell such securities from time to time, but will at all times be subject to restrictions imposed by the firm's internal rules. A copy of the firm's conflict of interest policy is available on request.
Past performance is not necessarily a guide to the future. The value of investments can fall as well as rise and you may get back less than you invested when you decide to sell your investments. It is strongly recommended that Independent financial advice should be taken before entering into any financial transaction.
PLEASE SEE ALSO OUR TERMS AND CONDITIONS
Kepler Partners LLP is a limited liability partnership registered in England and Wales at 9/10 Savile Row, London W1S 3PF with registered number OC334771.
Kepler Partners LLP is authorised and regulated by the Financial Conduct Authority.