UK household costs rocket to highest in 30 years
13th July 2023 13:44
by Alice Guy from interactive investor
Times have changed. A period of low interest rates and low inflation is over, and everything is more expensive now. It’s as bad as it’s been since recessionary Britain in the early 90s. Alice Guy examines the dramatic changes in spending on big household bills over the past 50 years.
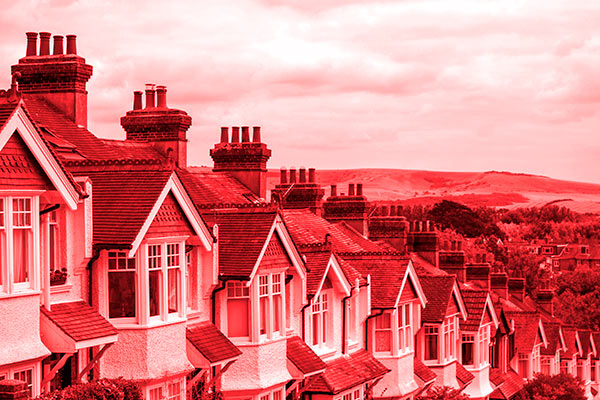
Household costs are at their highest level in three decades, and it’s hitting the younger generation hard. Waiting longer to buy their first homes, then grappling with super-sized mortgages, many households are now struggling to raise families on a shoe-string budget.
The big three costs, housing, food and energy are at their highest level since the early 1990s, sucking up an enormous 66% of an average income, leaving only 34% “spare” for other costs including their tax bill.
- Invest with ii: Open a Low Cost SIPP | What is a SIPP | Interactive investor Offers
This month, housing costs became more expensive than at any time since the early 1990s, and it doesn’t look like they’re coming down any time soon. This month, mortgage rates soared to 6.5%, leaving the average homeowner owing £1,323 each month. That’s a more than 100% increase compared with an average mortgage taken out in 2020, when mortgage interest rates stood at a historic low (based on a 75% mortgage on the average house price in 2020 and 2023).
But starting out in life has always been expensive, and there was even less money to go around for many families in the 1970s, 1980s and early 1990s. In fact, someone on an average salary in 1970 would only have 17.5% of their income “spare” after housing, food and energy costs. Buying a home 10 years later in 1980 was even worse as both interest rates and house prices soared, with a ludicrously low 1.6% spare after paying the big three costs.
Perhaps the biggest surprise is the eye-watering cost of food in the 1970s and 1980s, with the average household spending 40% of an average income on it in 1970, slowly falling to 30% by 1980. Many families relied on local top-up shops, with only 58% of households owning a fridge in 1970, and freezers still in the distant future. The cost of food gradually declined over the next 50 years, as larger supermarkets, with their economies of scale and modern farming methods, reduced production costs. Despite recent price rises, the average household now spends a more modest 12% of average income on food, down from 30% in 1980 and 22% in 1990.
- Merryn Somerset Webb: the scariest chart in the world
- The UK's coming mortgage crunch
- Investors expecting to make returns comfortably ahead of inflation in 2023
- UK housing most unaffordable since Victorian times
Housing costs hit their highest level in 1990, when interest rates reached 15% and a year after house prices hit their late 80s peak. In the early 1990s, a mix of sky-high house prices and rising interest rates as the UK left the exchange rate mechanism (ERM), triggered a property crash, forcing some households into negative equity.
In the mid-1990s house prices hit the pause button, before continuing their upward march from the late 1990s to the 2008 global financial crisis. After 2008, house prices continued to climb, although ultra-low interest rates made enormous mortgages more affordable.
Now, with the Bank of England base rate snowballing from 0.1% at the end of 2021 to 5% today, we’re returning to the bad old days when the big three household costs eat up two-thirds of an average income. Although 6.5% mortgage interest is about average in historic terms, many people have taken on huge mortgages just to get on the housing ladder. For families starting out, housing costs are now higher than the 1970s, although food costs are lower.
Of course, we’re slightly comparing apples with pears here. A lot has changed since the 1970s and many young people now start adult life with a huge amount of student debt, expected to average £45,600 for those starting uni in 2022. On the flip slide, it was much more common for households to have a single earner in the 1970s and 1980s, with only 50% of married women working in 1970. The employment rate among women (aged 25-54) rose from 57% in 1975 to a record high of 78% in 2017 (Institute for Fiscal Studies).
- Cash or shares? What the data tells us about where to invest
- Have the big super-trends for the next decade changed since Covid?
- Day in the life of a fund manager: Vanguard’s Mohneet Dhir
Another important factor is that although household costs were higher than today in the 1970s and 1980s, there were hidden benefits to high inflation back then. If you stayed put and didn’t move house every few years, your sky-high housing costs would quickly fall as your wages rose with inflation while your mortgage stayed the same. Someone on an average salary buying an average house in 1980 and spending 61% of their income on housing would see their costs drop to 40% by 1985, 25% by 1990, 20% by 1995. So, 10 tough years followed by rising disposable income.
For today’s pensioners, starting out in life meant huge sacrifices, but it was often worth it in the end as rising wages and wealth meant more disposable income over time. Many of today’s pensioners also have final salary pensions, giving them a guaranteed income in retirement. This type of pension has almost disappeared in the private sector.
But what about today’s youngsters? Are current first-time buyers likely to be wealthy in the future as eye-watering costs bow to the inevitable onward march of inflation? Without a crystal ball it’s impossible to tell, but it looks like we’re heading for difficult times ahead.
With house prices at a historic high compared to wages and economists predicting a sluggish economy for the next few years, it’s a reasonable bet that housing costs could be high for the foreseeable future. And with more of us renting rather than buying, many households may never see their household costs reduce significantly, even into retirement.
Today’s workers are contending with wage stagnation, pensions that are exposed to stock market volatility, and house prices at an historic high. It’s true, they have more disposable income on average than a family starting out in the 1970s, but they are unlikely to enjoy soaring wealth in the future. For households on an average income, it’s a struggle to afford more than the basics, and unless interest rates drop significantly, we could all be feeling a lot poorer for some time to come.
These articles are provided for information purposes only. Occasionally, an opinion about whether to buy or sell a specific investment may be provided by third parties. The content is not intended to be a personal recommendation to buy or sell any financial instrument or product, or to adopt any investment strategy as it is not provided based on an assessment of your investing knowledge and experience, your financial situation or your investment objectives. The value of your investments, and the income derived from them, may go down as well as up. You may not get back all the money that you invest. The investments referred to in this article may not be suitable for all investors, and if in doubt, an investor should seek advice from a qualified investment adviser.
Full performance can be found on the company or index summary page on the interactive investor website. Simply click on the company's or index name highlighted in the article.