What, if anything, could derail the multi-year tech boom?
Analysts at Kepler consider why technology-related stocks have been so successful.
22nd May 2020 15:45
This content is provided by Kepler Trust Intelligence, an investment trust focused website for private and professional investors. Kepler Trust Intelligence is a third-party supplier and not part of interactive investor. It is provided for information only and does not constitute a personal recommendation.
Material produced by Kepler Trust Intelligence should be considered a marketing communication, and is not independent research.
Analysts at Kepler Trust Intelligence consider why technology-related stocks and sectors have been so successful and the dangers which could bring their run to an end.

Thomas McMahon, senior analyst at Kepler Trust Intelligence.
We ask what could derail the multi-year tech boom…
In the financial markets, the biggest winners from the crisis so far have – without a doubt – been the technology sectors. Software, hardware, ecommerce and related sectors have outperformed in the immediate aftermath (as we discussed in a recent strategy note). They also seem likely to benefit from some of the likely long-lasting changes to society that the crisis will forge.
This is the latest episode in a long period of outperformance. Looking back over the past decade, technology-related companies have tended to perform like consumer staples or defensives on the downside, and like high growth discretionary stocks on the upside: an ideal combination from the investor’s point of view.
But will this continue, and can it? In this piece we consider why technology-related stocks and sectors have been so successful and the dangers which could bring their run to an end.
Masters of the universe
If you had been entirely invested in a FTSE 100 tracker, as a sterling investor, you would be down 23.5% in the year to date.
The MSCI ACWI is down almost 10%. Yet the NASDAQ 100 index of the largest tech stocks in the US is actually up 8.2% (1.5% in dollar terms). We discussed in a recent strategy note the trusts which have benefitted the most from this remarkable trend.
If we divide this short period into three: the run up to the coronavirus crash, the downmarket itself and the recovery from the bottom, the NASDAQ 100 outperformed in all three; as did the more globally diversified MSCI ACWI Information Technology Index.
This pattern holds even if we look in dollar terms, and at the corresponding Asian indices as well, so this is much more than a currency effect.
While this might seem remarkable, particularly considering that valuations in the technology sectors were higher than the market as a whole going into the crisis, it is entirely in accordance with recent history.
Over the past decade, technology sectors and stocks have outperformed consistently in both rising and falling markets.
According to Morningstar data, over the past eight years (at which point their NASDAQ 100 data runs out) the US, World and Asia technology indices have all done substantially better in terms of upside and downside capture than their broad markets.
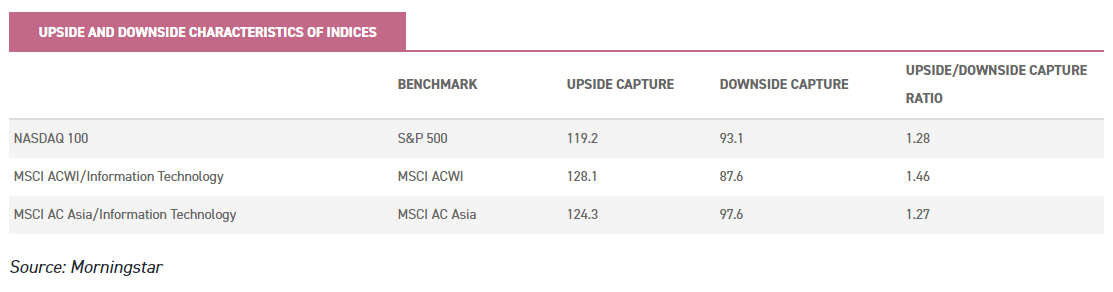
Source: Morningstar
We think this consistency is well illustrated by the graph below. It shows one year rolling returns of the US and global technology indices and those of the the MSCI ACWI (chosen as the broadest measure of global equities).
It is clear that the number of occasions an investment in the tech sector has been negative over any one rolling year is very low – and our numbers are dollar returns, so this is not a by-product of dollar strength.
Similarly when markets have been positive the tech sectors have been consistently well ahead of the broader market. In other words, the long-term numbers reflect not the impact of any small number of strong periods, but consistent outperformance in rising and falling markets.
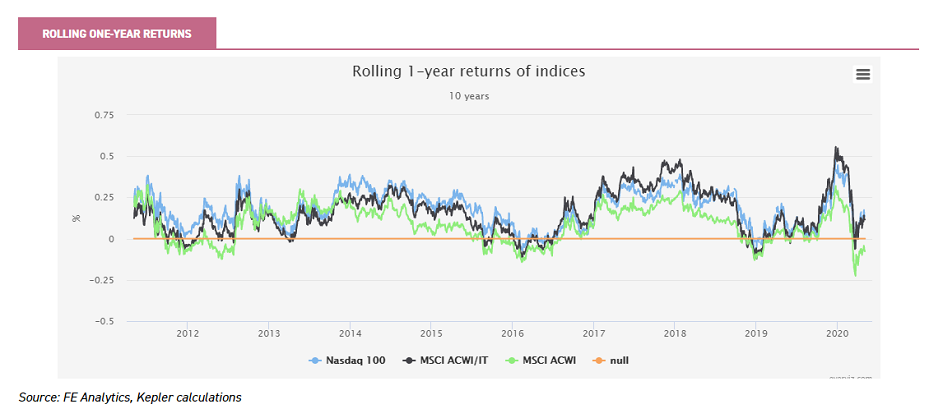
Source: FE Analytics, Kepler calculations
As the table below indicates, on only 3.7% of days over the past nine years was an investor in the NASDAQ in negative territory.
This period includes the eurozone crisis, an emerging markets recession, the Brexit vote, the election of Trump and surge in inflation expectations, and the global coronavirus crisis.
Even in the more internationally diversified MSCI ACWI/IT index the equivalent number was still just 11.8% of days, less than half the 26.1% figure for investors in the MSCI ACWI.
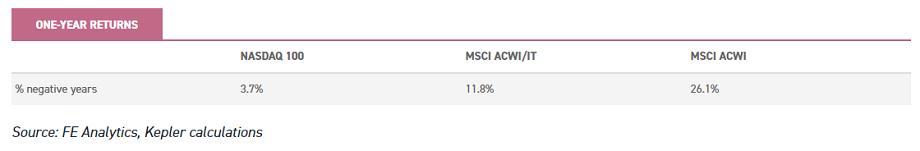
Source: Morningstar
Don't let a good crisis go to waste
Rather than conducting a post-mortem on the reasons for this trend over the past ten years, it is perhaps more useful to consider whether anything has changed that might not allow it to continue.
It is easy to identify why the good downside performance was repeated in the current crisis: certain types of economic activity have been banned by governments around the world and other types have been permitted only at a distance.
The online economy has been boosted as a result. Additionally technology has provided many of the solutions for us to stay in contact, and to keep other industries moving. As certain industries shut down, hardware, software and ecommerce have been significantly less affected.
We believe it is evident that the impact of the current crisis will be to accelerate and strengthen some trends in the use of technology. Some seem obvious and don’t require much explanation, but others might be more subtle. We have identified the main themes below.
Online shopping: Non-food online sales in the UK jumped from 15% of total sales in March 2019 to 22% this year.
As much as 20% more food sales were made online in March compared to a year ago; although online sales remain low as a total of food sales, at just 6%. Even larger jumps are likely to be seen in the coming months.
Although lockdown restrictions are likely to ease slowly over the coming months, it will be harder to shop in the high street for some time and many people will be afraid to go out. The main obstacle to sales growing even higher over the coming weeks is capacity. In the past many consumers have been reluctant to shop online.
Retailers have therefore had to balance growing online capacity with serving existing shoppers. These reluctant web users are typically the older generations, who are much more susceptible to COVID-19 and are now – as a result – much more likely to be compelled to stay indoors over the coming months. There will be no going back for many of these groups of people.
The extra volume of sales they bring may be the key to overcoming the real reason that online food sales have not swelled even more in recent years: it is unprofitable.
With low delivery charges not covering the costs of picking and delivering, supermarkets have not invested in it.
But supermarkets will have to build capacity and find efficiencies; since it is clear that, in the short to medium term, there will be an explosion of demand. However we have to recognise a danger here: if COVID-19 turns out to be less severe than originally feared, these trends could start to reverse in a matter of months.
Consequently consumers might become keener to trim the delivery cost off their order or less keen to pay a bit more on the cost of their shopping.
General retailers Amazon (NASDAQ:AMZN) and Alibaba (NYSE:BABA) have been strong performers during the crisis and the scale of their logistics operations means they could continue to prosper at the expense of their smaller rivals, although they are already highly profitable.
Manchester & London has over 25% of its portfolio in those two companies and is mostly invested in other tech stocks (including Polar Capital Technology (LSE:PCT)).
However the growth of online retailing isn’t just about the retailers. It is bullish for industrial property. Portfolios such as that of Tritax Big Box (LSE:BBOX), on which we published a note last week, are exposed to retail sales through their tenants who operate in that sector and use their logistics sites for distribution. BBOX and its peers could see missed rental payments and potentially defaults.
This will depend on the strength of the underlying business model both in the pre-COVID and post-COVID environment. Are they profitable enough online to survive? Can they expand online offerings enough to offset declining high street footfall?
However, in our view the long run trajectory is clear, and in fact any temporary dip in property valuations in this sector could be a good entry point, as yields in logistics have been compressed in recent years.
The large distribution sites – big or ‘mega’ boxes – are major development projects and so supply is slow. Tritax Big Box is a real estate investment trust with c. £2.5bn net assets, specifically exposed to just these types of location, and trades on a discount of 14%.
The growth of online retailing could also be bullish for robotics. Using robots is one way to cut the costs of online picking and distribution.
Furthermore the possibility that social distancing measures could stay in the workplace for many months – and perhaps years – could see companies accelerate the shift to using robots in manufacturing, as they cannot spread biological viruses to each other.
This could be bullish for robotics manufacturers such as Keyence, the largest holding inJPMorgan Japanese (LSE:JFJ), which has been the strongest performing Japan trust in 2020. Another trust to have invested significantly in the robotics theme in recent years is Mid Wynd (LSE:MWY), which owns Daifuku, a leading automater.
Uber's (NYSE:UBER) sales have collapsed as taxi use has plummeted. This may not rebound quickly: UK statistics show that the taxi driver is one of the occupations which has suffered the most fatalities in the epidemic.
It could, however, provide a boost to Uber’s long-term endgame: robot taxis. Automated taxis would clearly limit the risk of disease transmission (if they could be cleaned in between rides), and would be much more profitable for the operator.
With interest rates likely to remain low for years to come, could further capital be attracted to fund this migration? Tesla (NASDAQ:TSLA) and Lyft (NASDAQ:LYFT), both holdings in Scottish Mortgage (LSE:SMT), could benefit from this trend.
Research by fintech firm Nucoro shows that, since the start of the crisis, six million Britons have downloaded their bank’s app for the first time – around 200,000 each day.
As with online grocery shopping, many have resisted the migration from face-to-face interaction, particularly the older generation.
The ground is now much more fertile for companies like Atom Bank, the top holding in Schroder UK Public Private Trust (LSE:SUPP), and Starling Bank, a major holding in Merian Chrysalis Investment Company (LSE:MERI).
In the financial sector, another big winner in the long term could be card payment companies like Mastercard (NYSE:MA). Mastercard has seen sales fall 30% during the crisis, but the number of shops installing card machines, alongside concerns about hygiene, should see a greater proportion of payments flow their way in the next upswing.
Finally those of us who work from an office are expecting to be the last to be urged back to work. There is even talk of a right to work from home being written into law.
Although it is likely there would have to be loopholes that mean it has little force in practice (like the EU Working Time Directive), there is no doubt that more people will be working from home in the future. This is good news for the companies facilitating this trend with software, cloud storage and other services, which continues to be a major theme in Allianz Technology Trust (LSE:ATT).
Manager Walter Price has positioned the portfolio to benefit from remote working and a stay-at-home environment, including software companies providing cyber security, workforce collaboration, video streaming and communication services. Since a rise in home working, security and security software are likely to remain, increasing demand, Walter has been adding to CrowdStrike Holdings (NASDAQ:CRWD) and Zscaler (NASDAQ:ZS) in this space.
Riding for a fall?
One argument against the continued dominance of big tech is to claim that it is just a technical accident, as it is being driven by passive flows.
The argument runs that as more and more people invest in the US market through passives, the larger stocks just continue to get larger.
Our analysis above disproves that: were it the case, then technology stocks would display a high beta in downmarkets as well as in rising markets. We have shown this is not the case in practice, however, and for many years technology exposed stocks have fallen less than the market when it falls.
Another concern centres around valuation. The historic PE ratio on the NASDAQ is 28 times, while that of the S&P 500 is just 24.7 times.
When looking at expected earnings the absolute numbers drop, but the gap is very similar. Using estimates from Birinyi Associates, the forward PE on the NASDAQ is 26.7 compared to 22.8 for the S&P 500. Of course this only looks at expected earnings for the next twelve months and does not account for the superior growth rates possible over the long run in the technology sectors.
According to estimates from Yardeni Research, the five year expected earnings growth for the S&P 500 IT sector is 11.3% per annum; and is 15.7% for the consumer discretionary index, which includes Amazon and Netflix (NASDAQ:NFLX). This compares to 9.7% for the index as a whole.
Without getting into the details of projected cash flows for individual stocks, the case for a higher valuation for technology is based on the belief that these higher than average returns can be sustained for longer.
This is pretty much the definition of a ‘quality’ stock (in investment jargon). We think that some technology companies are inherently more likely to be able to achieve this outcome.
Coupled with secular growth trends, which accelerate in economic expansions, this is what explains their good performance in rising and falling markets.
In our view technology lends itself to being able to leverage low levels of capital to generate ever higher returns, with increasing profit margins, returns on equity and high levels of cash generation: all key quality characteristics.
The more successful a technology company is – in many cases – the greater the benefits of returns to scale. In the jargon, the gamma – the rate of change of the delta – changes as well as the delta itself.
This is true particularly in the software sectors. When it comes to online sales, superior logistics networks are hard to replicate; while companies like Amazon have managed to invest the cash generated from a lower-cost model of retailing into other areas, magnifying the benefits of scale.
Netflix, which is far more about intellectual property than logistics, may also benefit from similar advantages.
By being first, and by generating cash from a highly profitable enterprise (selling others’ content online), it has built up resources to generate a huge library of contemporary international content which any competitor could struggle to rival.
The cash generation possible in many of these companies also leads to debt-light capital structures, which is a huge benefit in falling markets (Netflix is an exception here).
It is interesting that, as the big five in the S&P 500 (all tech stocks) have grown to make up a greater percentage of the market cap of the index, they now make up a greater percentage of the index’s enterprise value – or debt plus equity.
This means that growth in equity value has been organic rather achieved than by levering up. Finally, it is the globalised nature of the markets that tech stocks operate in which gives them growth potential, unlike most companies.
China only opened its stock market in 1990. What use are valuation or economic trend signals which don’t take into account the extraordinary changes in the structure of the global economy and stock market since then?
The process of globalisation means that companies and central banks operate in a broader market and ecosystem.
As we have discussed, technology stocks have huge potential to sell across borders and to benefit from secular changes in society, which are becoming increasingly synchronised.
It was fifty years after the first steam railway was launched in the UK that the first railway was built in China. Now new products and services are launched almost simultaneously across much of the world.
It is this phenomenon which makes us sceptical about historical analogies. One often made is with Japan in 1988, when eight of the largest companies in the world were Japanese.
Now the six largest stocks in the world are all US based: Facebook (NASDAQ:FB), Amazon, Netflix, Microsoft (NASDAQ:MSFT), Apple (NASDAQ:AAPL) and Alphabet (NASDAQ:GOOGL).
Together they exceed the capitalisation of every individual country’s stock market except their own (obviously) and Japan’s.
Over the decade after 1989 you would have massively outperformed by switching from Japan into the cheaper US market.
But five of these Japanese stocks were banks: thus much more of a play on the domestic economy and much more exposed to the business cycle.
The US tech giants play in a global market, with much less dependence on their home country or on the business cycle thanks to the secular growth trends they are fuelling.
Similarly,we do not think the argument for small-caps we made recently is an argument against technology’s ability to outperform.
While there is always the potential for the giants to be cut down to size, we think this is most likely to come from small tech stocks.
These companies will be growing in their niches and taking over from their larger peers – unless they themselves are taken over. Facebook managed to absorb Instagram just as the newer firm was threatening it, but this strategy might not always be possible; particularly if regulators get more involved.
In this context the global dimension cannot be forgotten: competitors to the US leaders could come from abroad. Consider, for example, how the Swedish Spotify (NYSE:SPOT) beat the US based Pandora.
Conclusion
In conclusion, we think that the quality characteristics which technology stocks display gives them the potential to outperform for years to come. To us, even a period of rising interest rates may not be a threat.
Rising rates are assumed to be more beneficial to value rather than growth stocks, but we think this way of thinking might not be fruitful, and it is really on sector and company lines that we need to think.
The last time the tech sector really sold off was for a short period in Q4 2018. Everything sold off, bonds and equities alike, and the leaders sold off the most.
We could see this sort of short-term event happening again, but as long as the economy continues to grow, secular trends are likely to accelerate, particularly given the structural shifts that are likely to follow the current crisis.
We would therefore expect tech stocks to once more behave like quality stocks during the troubled months to come, as their sales remain relatively resilient even if they fall marginally.
When growth takes off, we expect the rate of societal change to in turn accelerate again. Even regulation is unlikely to stop the rise of tech, in our view, instead merely influencing which companies are the winners.
Kepler Partners is a third-party supplier and not part of interactive investor. Neither Kepler Partners or interactive investor will be responsible for any losses that may be incurred as a result of a trading idea.
Full performance can be found on the company or index summary page on the interactive investor website. Simply click on the company's or index name highlighted in the article.
Important Information
Kepler Partners is not authorised to make recommendations to Retail Clients. This report is based on factual information only, and is solely for information purposes only and any views contained in it must not be construed as investment or tax advice or a recommendation to buy, sell or take any action in relation to any investment.
This report has been issued by Kepler Partners LLP solely for information purposes only and the views contained in it must not be construed as investment or tax advice or a recommendation to buy, sell or take any action in relation to any investment. If you are unclear about any of the information on this website or its suitability for you, please contact your financial or tax adviser, or an independent financial or tax adviser before making any investment or financial decisions.
The information provided on this website is not intended for distribution to, or use by, any person or entity in any jurisdiction or country where such distribution or use would be contrary to law or regulation or which would subject Kepler Partners LLP to any registration requirement within such jurisdiction or country. Persons who access this information are required to inform themselves and to comply with any such restrictions. In particular, this website is exclusively for non-US Persons. The information in this website is not for distribution to and does not constitute an offer to sell or the solicitation of any offer to buy any securities in the United States of America to or for the benefit of US Persons.
This is a marketing document, should be considered non-independent research and is subject to the rules in COBS 12.3 relating to such research. It has not been prepared in accordance with legal requirements designed to promote the independence of investment research.
No representation or warranty, express or implied, is given by any person as to the accuracy or completeness of the information and no responsibility or liability is accepted for the accuracy or sufficiency of any of the information, for any errors, omissions or misstatements, negligent or otherwise. Any views and opinions, whilst given in good faith, are subject to change without notice.
This is not an official confirmation of terms and is not to be taken as advice to take any action in relation to any investment mentioned herein. Any prices or quotations contained herein are indicative only.
Kepler Partners LLP (including its partners, employees and representatives) or a connected person may have positions in or options on the securities detailed in this report, and may buy, sell or offer to purchase or sell such securities from time to time, but will at all times be subject to restrictions imposed by the firm's internal rules. A copy of the firm's conflict of interest policy is available on request.
Past performance is not necessarily a guide to the future. The value of investments can fall as well as rise and you may get back less than you invested when you decide to sell your investments. It is strongly recommended that Independent financial advice should be taken before entering into any financial transaction.
PLEASE SEE ALSO OUR TERMS AND CONDITIONS
Kepler Partners LLP is a limited liability partnership registered in England and Wales at 9/10 Savile Row, London W1S 3PF with registered number OC334771.
Kepler Partners LLP is authorised and regulated by the Financial Conduct Authority.
Kepler Partners is a third-party supplier and not part of interactive investor. Neither Kepler Partners or interactive investor will be responsible for any losses that may be incurred as a result of a trading idea.
These articles are provided for information purposes only. Occasionally, an opinion about whether to buy or sell a specific investment may be provided by third parties. The content is not intended to be a personal recommendation to buy or sell any financial instrument or product, or to adopt any investment strategy as it is not provided based on an assessment of your investing knowledge and experience, your financial situation or your investment objectives. The value of your investments, and the income derived from them, may go down as well as up. You may not get back all the money that you invest. The investments referred to in this article may not be suitable for all investors, and if in doubt, an investor should seek advice from a qualified investment adviser.
Full performance can be found on the company or index summary page on the interactive investor website. Simply click on the company's or index name highlighted in the article.
Important Information
Kepler Partners is not authorised to make recommendations to Retail Clients. This report is based on factual information only, and is solely for information purposes only and any views contained in it must not be construed as investment or tax advice or a recommendation to buy, sell or take any action in relation to any investment.
This report has been issued by Kepler Partners LLP solely for information purposes only and the views contained in it must not be construed as investment or tax advice or a recommendation to buy, sell or take any action in relation to any investment. If you are unclear about any of the information on this website or its suitability for you, please contact your financial or tax adviser, or an independent financial or tax adviser before making any investment or financial decisions.
The information provided on this website is not intended for distribution to, or use by, any person or entity in any jurisdiction or country where such distribution or use would be contrary to law or regulation or which would subject Kepler Partners LLP to any registration requirement within such jurisdiction or country. Persons who access this information are required to inform themselves and to comply with any such restrictions. In particular, this website is exclusively for non-US Persons. The information in this website is not for distribution to and does not constitute an offer to sell or the solicitation of any offer to buy any securities in the United States of America to or for the benefit of US Persons.
This is a marketing document, should be considered non-independent research and is subject to the rules in COBS 12.3 relating to such research. It has not been prepared in accordance with legal requirements designed to promote the independence of investment research.
No representation or warranty, express or implied, is given by any person as to the accuracy or completeness of the information and no responsibility or liability is accepted for the accuracy or sufficiency of any of the information, for any errors, omissions or misstatements, negligent or otherwise. Any views and opinions, whilst given in good faith, are subject to change without notice.
This is not an official confirmation of terms and is not to be taken as advice to take any action in relation to any investment mentioned herein. Any prices or quotations contained herein are indicative only.
Kepler Partners LLP (including its partners, employees and representatives) or a connected person may have positions in or options on the securities detailed in this report, and may buy, sell or offer to purchase or sell such securities from time to time, but will at all times be subject to restrictions imposed by the firm's internal rules. A copy of the firm's conflict of interest policy is available on request.
Past performance is not necessarily a guide to the future. The value of investments can fall as well as rise and you may get back less than you invested when you decide to sell your investments. It is strongly recommended that Independent financial advice should be taken before entering into any financial transaction.
PLEASE SEE ALSO OUR TERMS AND CONDITIONS
Kepler Partners LLP is a limited liability partnership registered in England and Wales at 9/10 Savile Row, London W1S 3PF with registered number OC334771.
Kepler Partners LLP is authorised and regulated by the Financial Conduct Authority.
These articles are provided for information purposes only. Occasionally, an opinion about whether to buy or sell a specific investment may be provided by third parties. The content is not intended to be a personal recommendation to buy or sell any financial instrument or product, or to adopt any investment strategy as it is not provided based on an assessment of your investing knowledge and experience, your financial situation or your investment objectives. The value of your investments, and the income derived from them, may go down as well as up. You may not get back all the money that you invest. The investments referred to in this article may not be suitable for all investors, and if in doubt, an investor should seek advice from a qualified investment adviser.
Full performance can be found on the company or index summary page on the interactive investor website. Simply click on the company's or index name highlighted in the article.