When it comes to investing - change never stops
We reveal how changing financial trends have impacted investors' portfolios.
4th October 2019 11:05
by Tom Bailey from interactive investor
We reveal how changing financial trends have impacted investors' portfolios.

Publicly listed companies have a limited lifespan. Eventually, they fall victim to competition, are taken over or see their business model become obsolete as a consequence of some technological or regulatory development, or simply changing fashion. Similarly, certain sectors come to dominate for a while before fading, and new technologies and trends lead to the rise and fall of particular industries over time.
This process of constant change means the composition of stock markets too is always altering, and with it the make-up of a typical investor's portfolio. Here we examine the trends that have led to changes in investors' portfolios over the past 40 years.
We can't look in detail at which stocks investors typically held in their portfolios over the period, as the data needed do so is unavailable. However, data on fund flows and the composition of major market indices tell us which companies dominated markets during the period. This in turn gives us clues to the popularity of specific stocks and sectors with equity investors and fund managers.
Leaving home
One of the biggest changes in UK investors' portfolios over recent decades has been a reduction in UK bias. James Norton, a senior planner at Vanguard, says:
"Historically, retail investors have favoured their home market, possibly because they are familiar with UK companies."
That, though, has changed in recent years: He adds:
"Anecdotally, I've seen investors reduce their home bias substantially over the past 15-20 years."
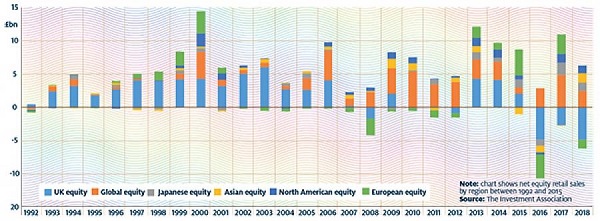
Jonathan Lipkin, director of policy, strategy and research at the Investment Association, says: "One of the most notable changes in retail saver behaviour over the past three decades has been a shift away from the [focus on] UK equity funds that characterised the 1990s."
As the chart below shows, throughout the 1990s UK equity funds (pale blue) dominated. That briefly changed in 2000 when global equity funds eclipsed UK funds, driven by the dotcom boom, but when the dotcom bubble burst, so too did appetite for global stocks (orange). There was a brief swing back to UK equities in the early 2000s, but it was short-lived.
In the late 2000s UK equity funds again started to lose their dominance, a position they have not regained. Gradually UK investors renewed their confidence in global stocks. The increasing popularity of global index trackers might partly explain this trend.
Data from the IA also shows the flows of money going to different asset classes among investors between 1993 (the earliest date for which it has data) and 2018. Overall, investors still preferred equity funds over the period but drifted slightly towards more diverse asset classes such as property, fixed income and mixed assets.
UK dominance declines as global funds gain strength
Uncertainty spurs shift
According to one analyst, the most interesting shift in the asset class preferences of investors has been towards multi-asset funds. These funds barely registered with investors in the 1990s, but their popularity grew in the mid-2000s and took off around the time of the global financial crisis, according to IA data.
He says demand has been driven by a sense that there are "multiple [conceivable] outcomes to what is happening on the global geopolitical stage, and in terms of policy responses from governments and central banks". He explains that since the 2008 crisis, investors have felt that a range of eventualities is possible, spanning inflation, deflation and stagflation. No one knows what is coming next.
He adds:
"Each of those three scenarios would require a different asset allocation strategy, at least if history is any guide, so it makes sense for investors to try to cover as many bases as possible using multi-asset funds."
Investors in FTSE 100 index companies have also had to face significant change as sectors of the index have risen and fallen in line with global economic trends.
For example, 25 technology, media and telecoms stocks were added to the index between 1998 and 2000, only for 22 to fall straight back out in 2000/02. Similarly, between 2008 and 2012 17 mining and oil firms gained promotion to the index. However, when commodity prices started to dive from 2011 onwards, 16 firms were demoted.
The period 2008/18 also saw some important trends. For example, in 2008 financials comprised 24% of the index. The financial crisis trimmed this to just 14.9% by 2009. Yet by 2010 the sector’s weighting had bounced back to 21%.
Financials once again declined in 2012 as oil and gas stocks reached their peak on the back of surging commodity prices. However, the financials sector constituted 20% or more of the index in subsequent years and 24% by 2018.
He suggests that one of the most noteworthy changes has been seen in the industrials sector. Until 2012 industrials accounted for 3-4% of the FTSE 100. However, the sector now constitutes about 7% of the index, largely on the back of the success of housebuilders.
He says:
"Four builders – Barratt (LSE:BDEV), Berkeley (LSE:BKG), Persimmon (LSE:PSN) and Taylor Wimpey (LSE:TW.) – are now in the index, thanks to their record profits, net cash balance sheets and generous cash returns to shareholders. The companies have felt the benefit of record low interest rates and government efforts to stoke the housing market via the Help to Buy scheme."
Tech trends
Amid all the change over the past decade, there has been one constant: a lack of technology stocks in the UK index. Technology accounted for less than 1% of the index in 2008, and it was the same story in 2018.
This shows that UK investors have had to look to the US and, to a lesser degree, Asia, Japan and Europe to play the latest growth trends in the technology sector.
In the US, the dominance of the tech sector today is indisputable. However, the narrative that tech stocks gained ascendency over the past 40 years, knocking industrials and old-economy stocks off their perches, is inaccurate. Data from Goldman Sachs shows that tech stocks had already gained dominance by 1979. Even back in the early 1970s, thanks to the craze for fast-growing Nifty Fifty tech stocks, technology was the largest sector in the US market.
A further nuance in the picture is that big-name Nifty Fifty tech stocks of the past often had larger market weightings than the largest tech stocks of today.
For example, Apple (NASDAQ:AAPL) currently has a market weighting of 3.6%, Amazon (NASDAQ:AMZN) 3.2%, Alphabet (NASDAQ:GOOGL) 2.7% and Facebook (NASDAQ:FB) 1.9%. However, at the height of the Nifty Fifty craze IBM (NYSE:IBM) had a market weighting of 8.3%, Eastman Kodak (NYSE:KODK) 4.2%, General Electric (NYSE:GE) 2.3% and Xerox Holdings (NYSE:XRX) 2.1%.
Indeed, at several points over the past decade tech companies have been even more dominant than they are today. The tech sector as a percentage of the US market reached its peak during the final stages of the dotcom bubble, not during the bull market of the past few years that has been led by FAANG stocks (Facebook, Amazon, Apple, Netflix and Google).
At the height of the tech boom, the individual market caps of the tech giants surpassed or rivalled those dominating today: Microsoft (NASDAQ:MSFT) was on a market weighting of 5.5%, Cisco Systems (NASDAQ:CSCO) on 4.2% and Intel (NASDAQ:INTC) 3.6%. For most of the past 40 years anyone holding the whole US market would have found that their largest sectoral exposure was to tech.
As readers may have noticed, much of the UK data that can be called upon to map out investing patterns over the past 40 years only extends to the 1990s, whereas US market data is more complete and easier to access. Nonetheless, readers should have gained some sense of the ebbing and flowing of investment trends over the past 40 years, and of the corresponding changes that have occurred in the composition of investors’ portfolios.
Top 5 FTSE 100 sectors
| Sector | No of companies | Weight (%) |
|---|---|---|
| As at February 2008 | ||
| Financials | 27 | 24.09 |
| Oil and gas | 7 | 19.12 |
| Consumer services | 24 | 9.23 |
| Consumer goods | 11 | 10.77 |
| Healthcare | 4 | 7.38 |
| As at February 2018 | ||
| Financials | 23 | 23.96 |
| Consumer goods | 13 | 17.19 |
| Oil and gas | 3 | 15.03 |
| Consumer services | 21 | 10.08 |
| Basic materials | 11 | 9.38 |
| Source: FTSE Russell |
Full performance can be found on the company or index summary page on the interactive investor website. Simply click on the company's or index name highlighted in the article.
This article was originally published in our sister magazine Money Observer, which ceased publication in August 2020.
These articles are provided for information purposes only. Occasionally, an opinion about whether to buy or sell a specific investment may be provided by third parties. The content is not intended to be a personal recommendation to buy or sell any financial instrument or product, or to adopt any investment strategy as it is not provided based on an assessment of your investing knowledge and experience, your financial situation or your investment objectives. The value of your investments, and the income derived from them, may go down as well as up. You may not get back all the money that you invest. The investments referred to in this article may not be suitable for all investors, and if in doubt, an investor should seek advice from a qualified investment adviser.
Full performance can be found on the company or index summary page on the interactive investor website. Simply click on the company's or index name highlighted in the article.