eyeQ round-up: gold, BT, Aviva, Persimmon, Imperial Brands
Six weeks ago, interactive investor teamed up with the experts at eyeQ who use artificial intelligence and their own smart machine to generate actionable trading signals. Here’s how they've worked so far.
15th March 2024 10:10
by Huw Roberts from eyeQ

"Our signals are crafted through macro-valuation, trend analysis, and meticulous back-testing. This combination ensures a comprehensive evaluation of an asset's value, market conditions, and historical performance." eyeQ
Discover: eyeQ analysis explained | eyeQ: our smart machine in action | Glossary
Taking stock
eyeQ’s data is now a little over a month old on interactive investor. How have the observations and signals from our macro-driven smart machine fared in that time?
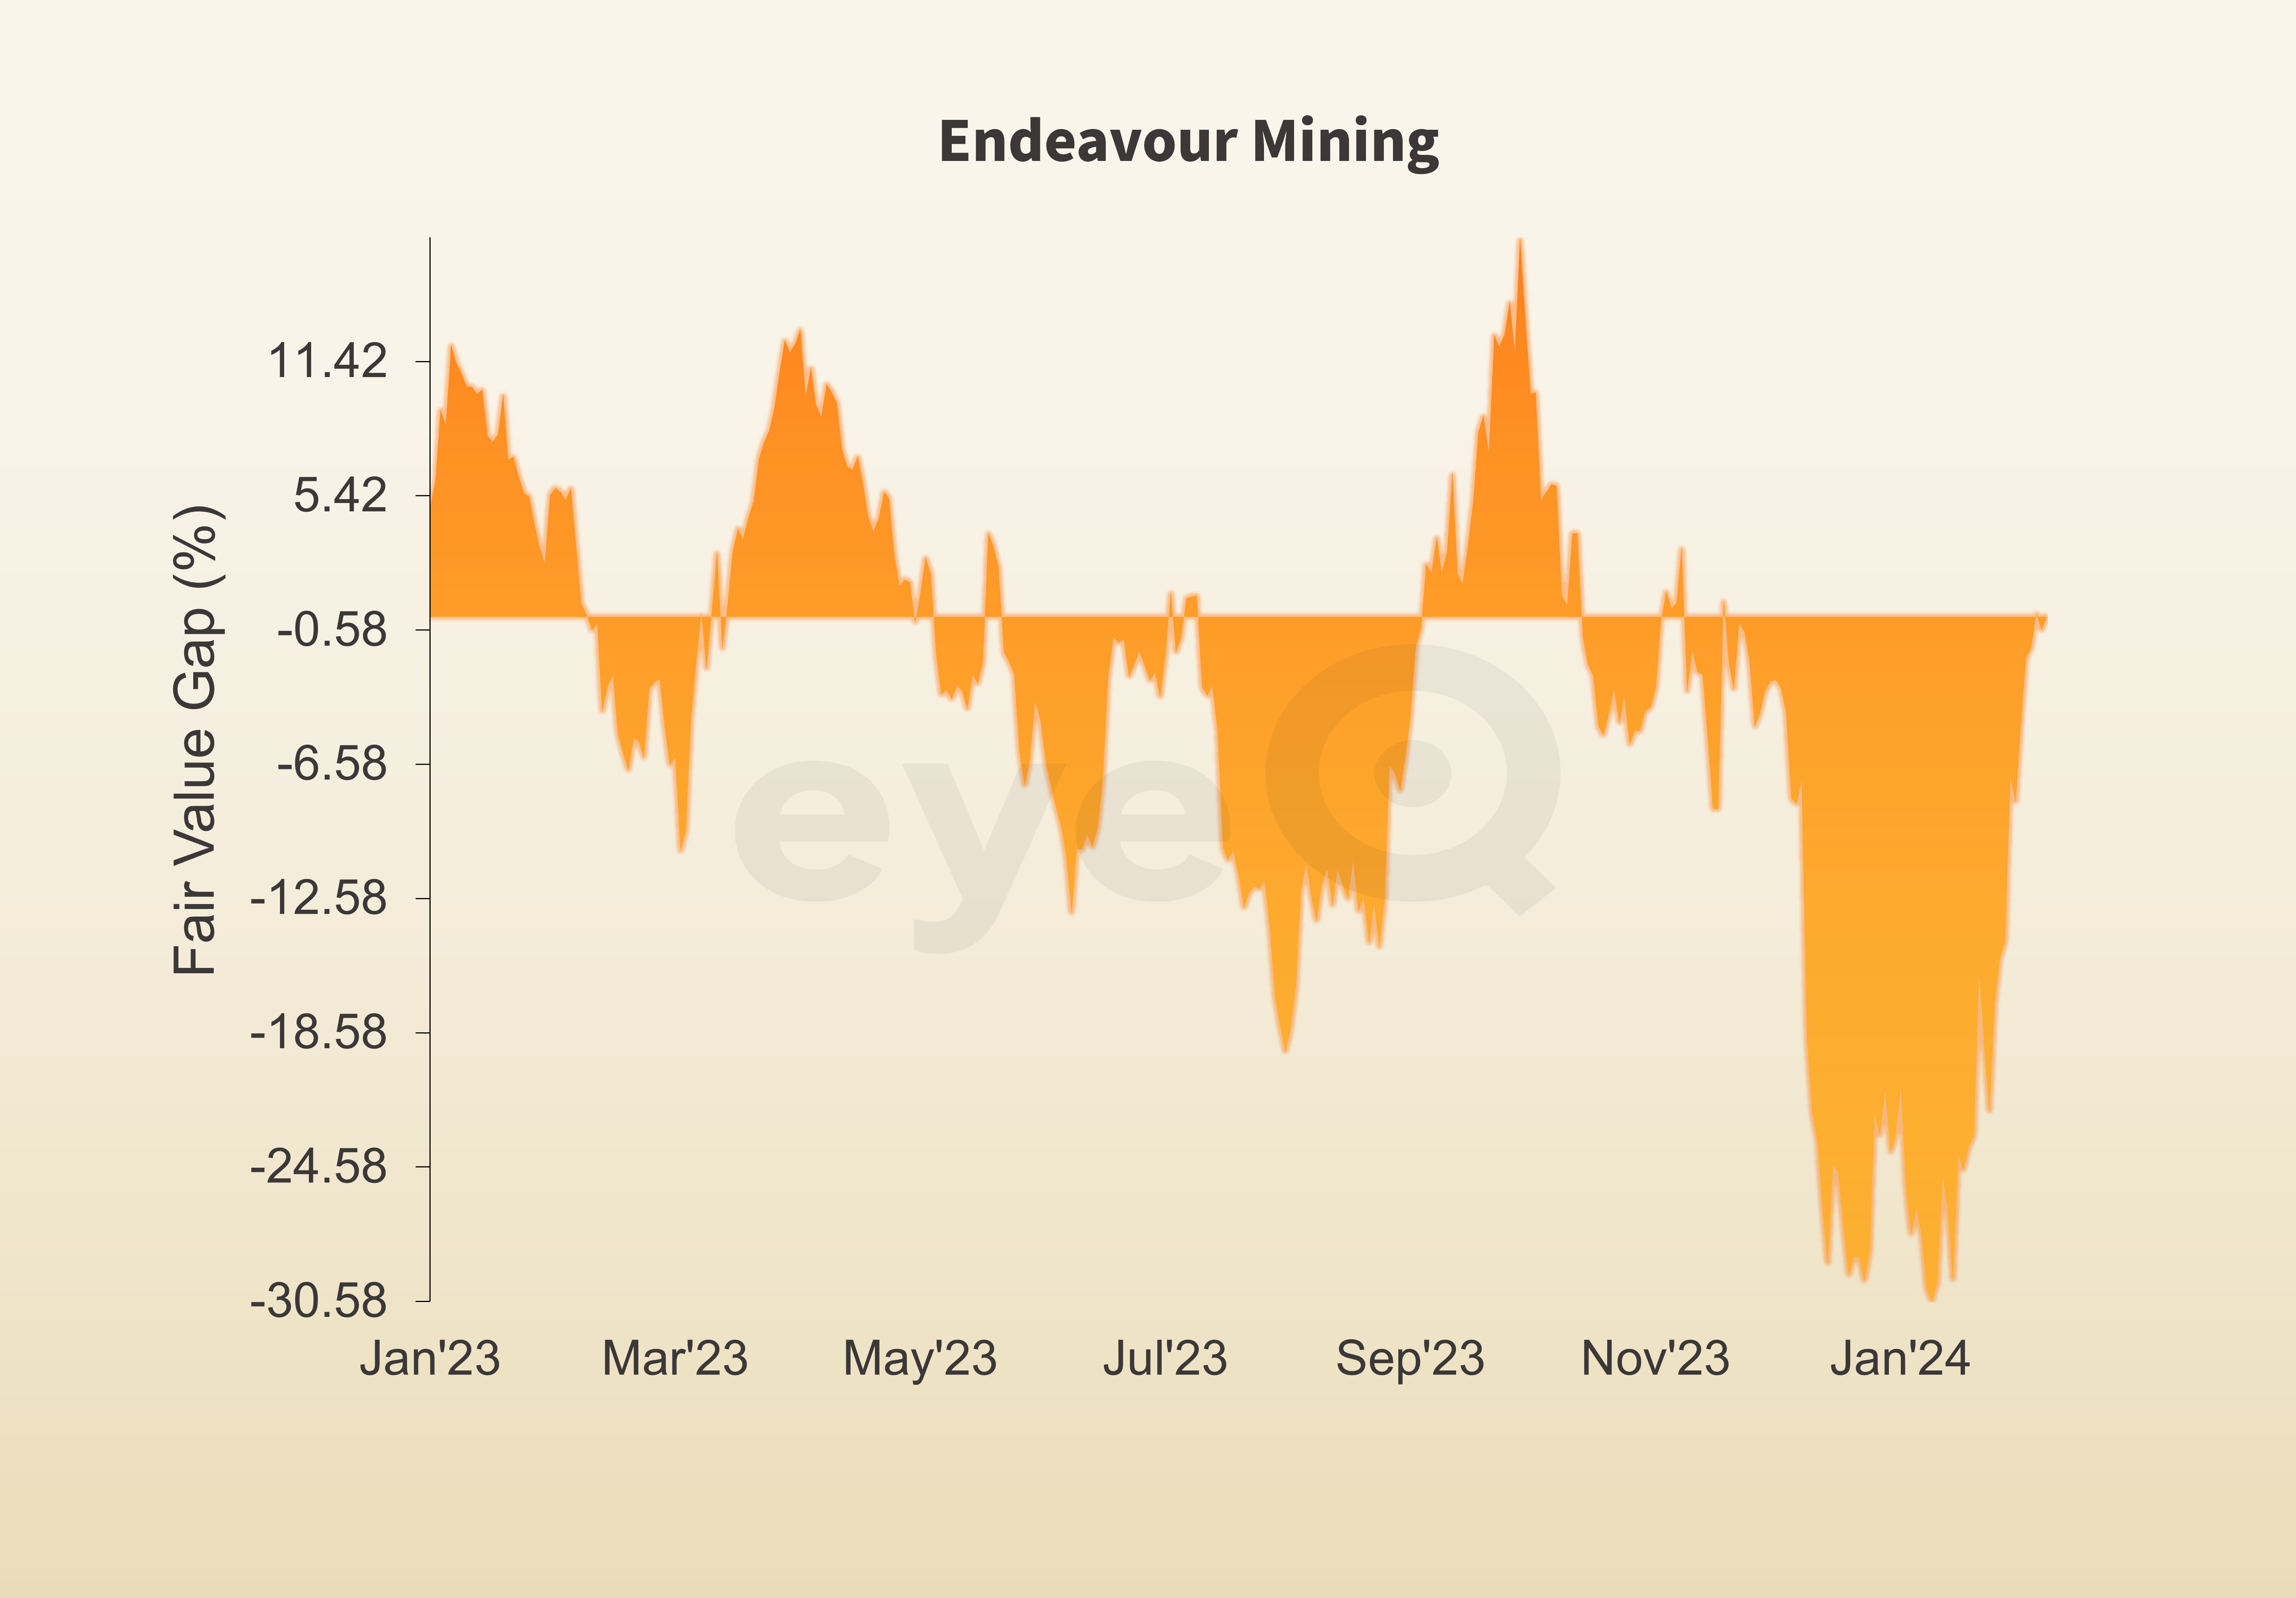
Our very first post on ii was about gold back on 1 February. Specifically, we flagged the VanEck Gold Miners ETF (LSE:GDX), which tracks gold miners as 6.5% cheap to macro conditions, and Endeavour Mining (LSE:EDV), which eyeQ had as trading 25% below our model value.
The pattern was similar on both signals. February was tough as both languished at first but, for those who stayed the course, patience was rewarded. Since our signal, GDX shares are up around 8% and Endeavour around 10%.
GDX closed the valuation gap - the difference between our model value (fair value) and where the price currently is - and has now overshot, which means it now looks somewhat extended. For Endeavour, the valuation gap has halved but eyeQ model value is moving up, so the machine says stick with this one.
Source: eyeQ. Past performance is not a guide to future performance.
Another early post was on Imperial Brands (LSE:IMB), which also wins our award for the best title thus far: “This tobacco stock could damage your wealth”.
eyeQ said Imperial was 6.1% rich to the overall macro environment (share price is above our model value) and, by the end of February when the valuation gap closed, the stock had fallen 6.8%. Currently, with the shares down 10.7% since our initial analysis, there is no strong signal.
eyeQ signalled the BT Group (LSE:BT.A)sell off was overdone when we got to 9.4% cheap on our models back on 6 February. The trade worked but the return was a modest 1.6%. The gap closed as much by model value falling as BT’s share price rallying. Sometimes it’s a bit of both.
Mid-February we flagged the homebuilder Persimmon (LSE:PSN), which was 8.9% rich to macro conditions. Over the next four weeks the stock fell nearly 7% and eyeQ’s signal was closed.
But what hasn’t worked?
On 6 March, ahead of their results, we posted on Aviva (LSE:AV.). We acknowledged that, among the insurers, Aviva looked the best pick from a bottom-up company fundamental perspective. But we flagged that relative to macro conditions, a lot of good news was in the price as the stock screened as 6.5% rich on our models.
Their earnings were strong and the stock has rallied a further 7% since reporting those results.
eyeQ’s model value is falling which makes the contrast between deteriorating top down and healthy bottom up all the starker. Aviva is now 13.3% rich on our models, so the machine still doesn’t like the stock. But even if we’re ultimately proven right, we acknowledge we’ve been wrong thus far, and the losses might be too painful for some to ride.
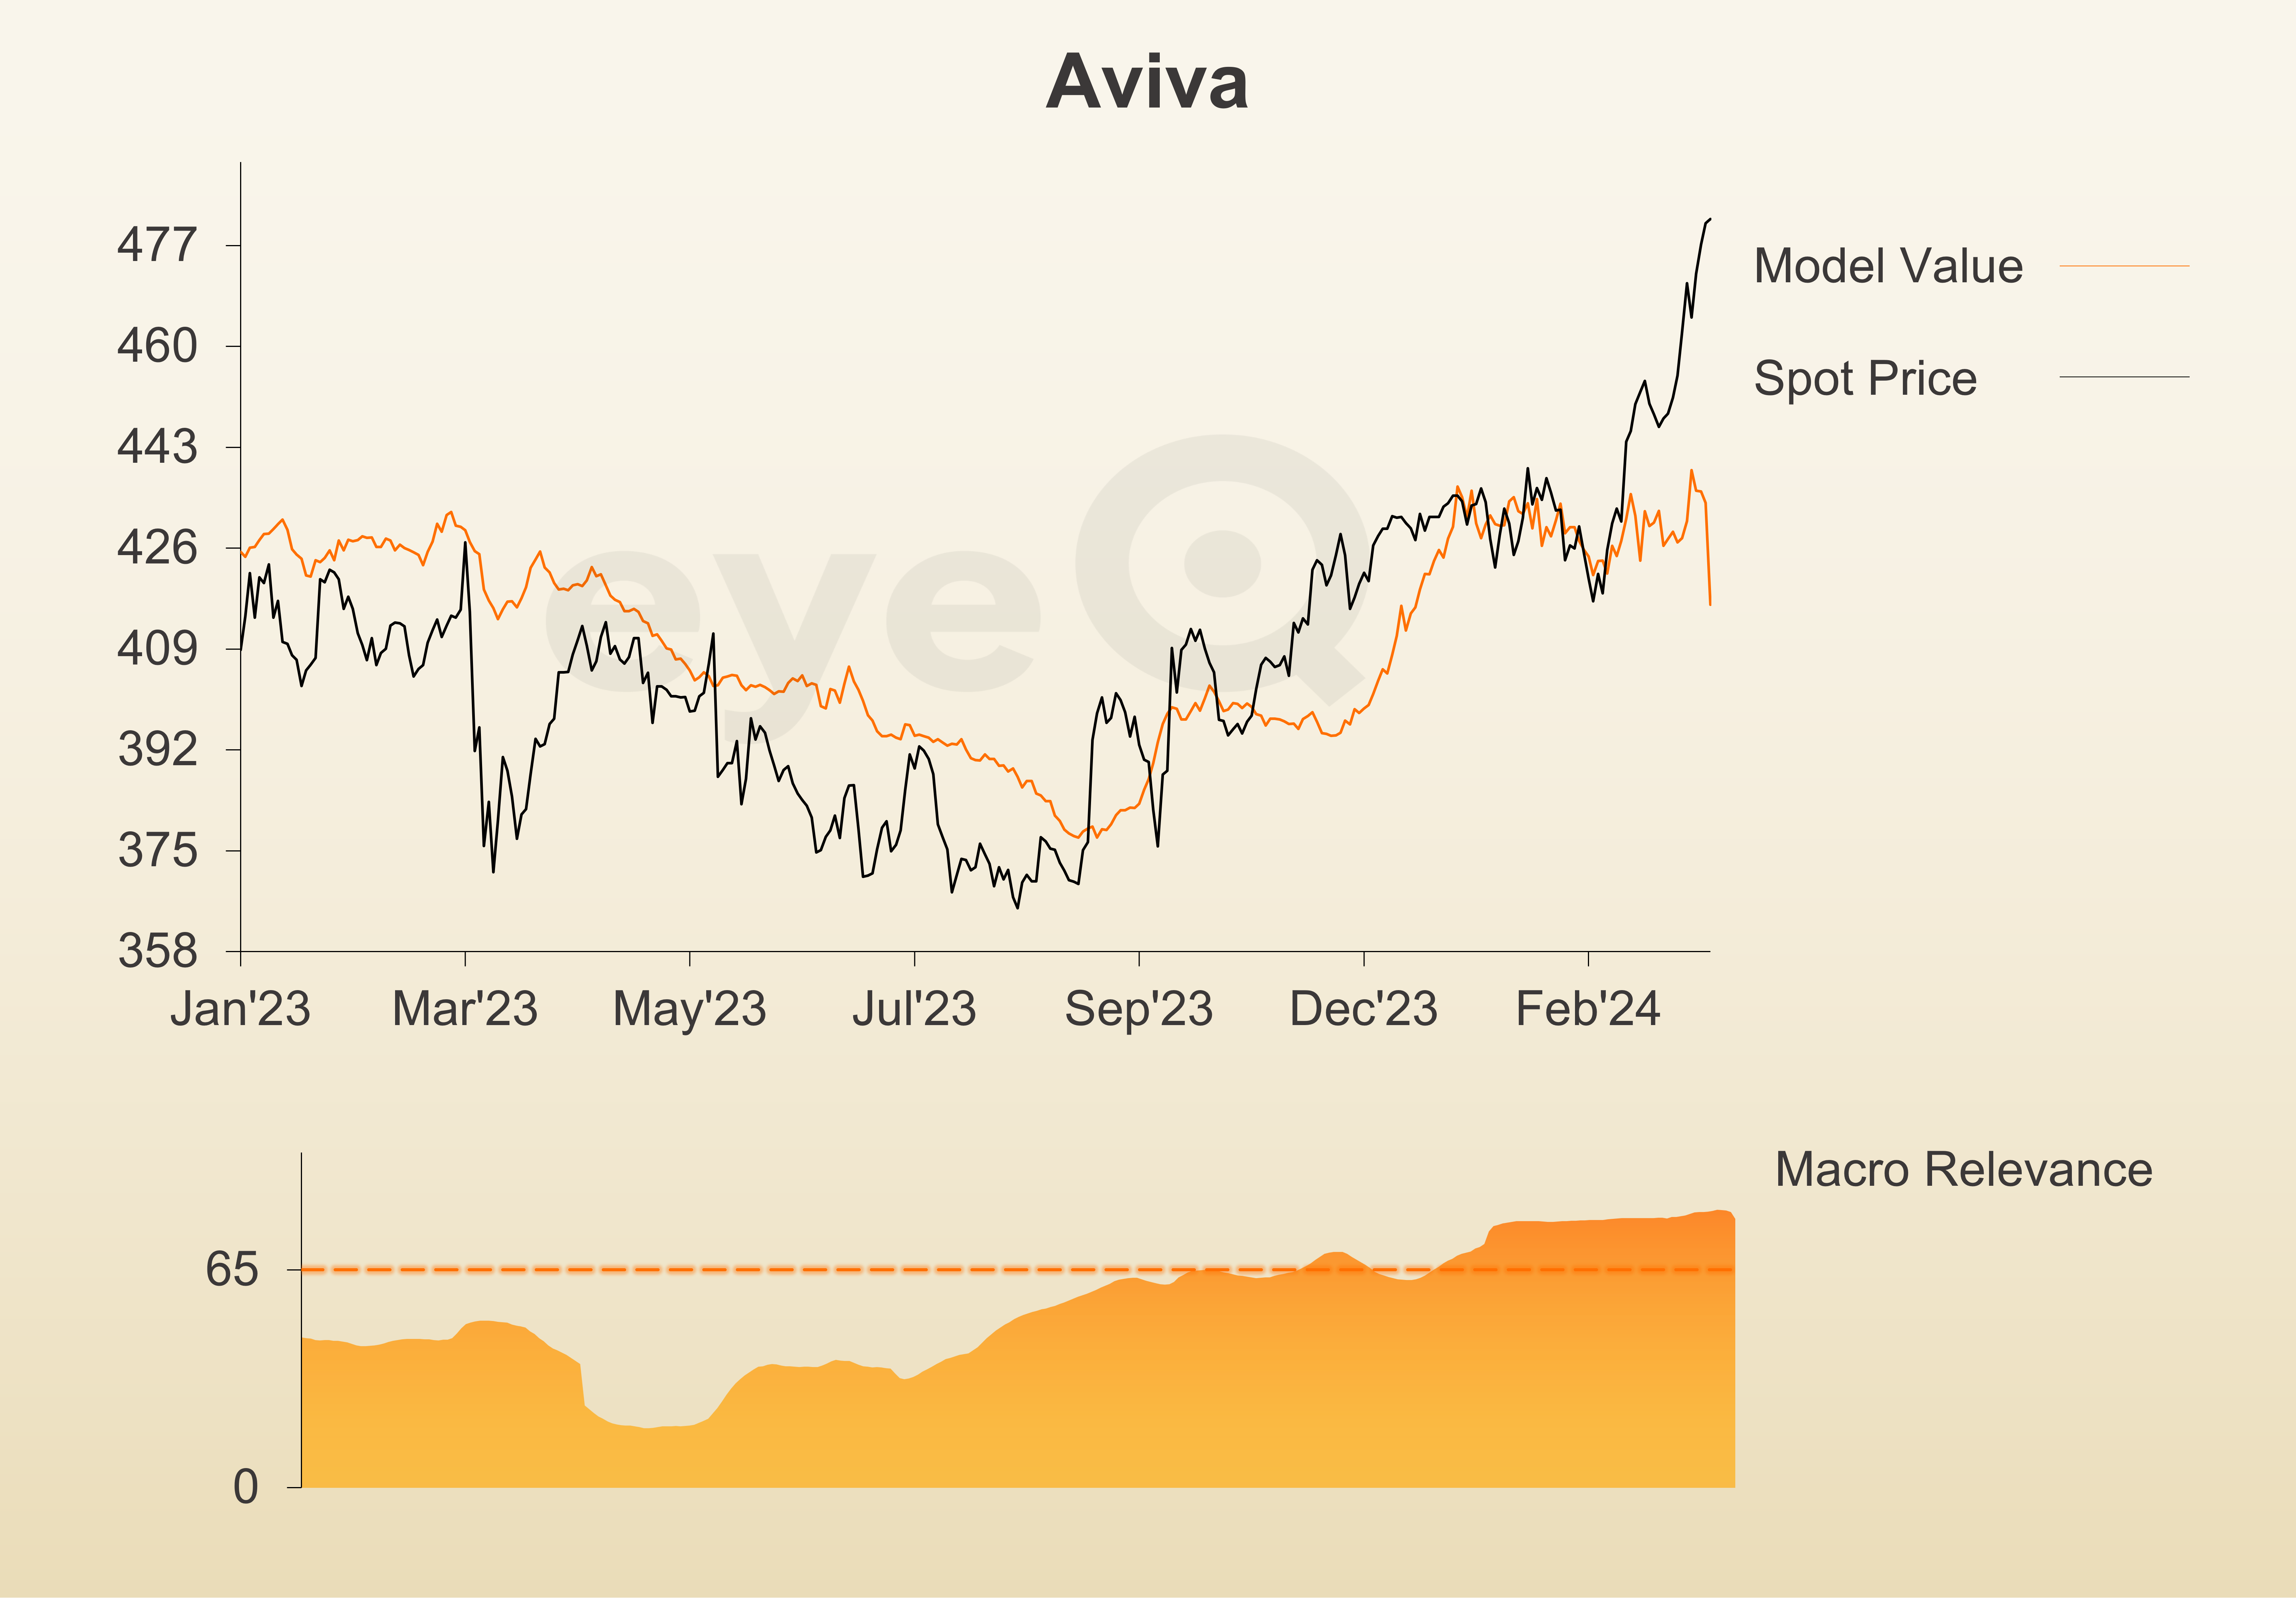
Source: eyeQ. Past performance is not a guide to future performance.
Investing is tough. The aim of eyeQ is to help tilt the risk-reward in your favour by using an AI-driven machine to highlight when stocks are being driven by macro forces and, when they are, if there any opportunities.
They won’t always work, and we will be open and transparent about that. But six weeks in and the eyeQ/interactive investor partnership is off to a strong start!
Useful terminology:
Model value
Where our smart machine calculates that any stock market index, singe stock or exchange-traded fund (ETF) should be priced (the fair value) given the overall macroeconomic environment.
Model (macro) relevance
How confident we are in the model value. The higher the number the better! Above 65% means the macro environment is critical, so any valuation signals carry strong weight. Below 65%, we deem that something other than macro is driving the price.
Fair Value Gap (FVG)
The difference between our model value (fair value) and where the price currently is. A positive Fair Value Gap means the security is above the model value, which we refer to as “rich”. A negative FVG means that it's cheap. The bigger the FVG, the bigger the dislocation and therefore a better entry level for trades.
Short Term model
This model looks at share prices over the last four months, captures the company’s relationship with growth, inflation, currency shifts, central bank policy etc and calculates our key results - model value, model relevance, Fair Value Gap. It’s what we call a tactical opportunity.
Long Term model
This model looks at share prices over the last 12 months, captures the company’s relationship with growth, inflation, currency shifts, central bank policy etc and calculates our key results - model value, model relevance, Fair Value Gap.
These third-party research articles are provided by eyeQ (Quant Insight). interactive investor does not make any representation as to the completeness, accuracy or timeliness of the information provided, nor do we accept any liability for any losses, costs, liabilities or expenses that may arise directly or indirectly from your use of, or reliance on, the information (except where we have acted negligently, fraudulently or in wilful default in relation to the production or distribution of the information).
The value of your investments may go down as well as up. You may not get back all the money that you invest.
Equity research is provided for information purposes only. Neither eyeQ (Quant Insight) nor interactive investor have considered your personal circumstances, and the information provided should not be considered a personal recommendation. If you are in any doubt as to the action you should take, please consult an authorised financial adviser.
Disclosure
We use a combination of fundamental and technical analysis in forming our view as to the valuation and prospects of an investment. Where relevant we have set out those particular matters we think are important in the above article, but further detail can be found here.
Please note that our article on this investment should not be considered to be a regular publication.
Details of all recommendations issued by ii during the previous 12-month period can be found here.
ii adheres to a strict code of conduct. Contributors may hold shares or have other interests in companies included in these portfolios, which could create a conflict of interests. Contributors intending to write about any financial instruments in which they have an interest are required to disclose such interest to ii and in the article itself. ii will at all times consider whether such interest impairs the objectivity of the recommendation.
In addition, individuals involved in the production of investment articles are subject to a personal account dealing restriction, which prevents them from placing a transaction in the specified instrument(s) for a period before and for five working days after such publication. This is to avoid personal interests conflicting with the interests of the recipients of those investment articles.