Higher vs lower-risk strategies: which outperformed?
With a nod to 19th-century Russian literature, a Kepler analyst examines key developed market equity sectors to reach an answer.
9th May 2025 14:01

This content is provided by Kepler Trust Intelligence, an investment trust focused website for private and professional investors. Kepler Trust Intelligence is a third-party supplier and not part of interactive investor. It is provided for information only and does not constitute a personal recommendation.
Material produced by Kepler Trust Intelligence should be considered a marketing communication, and is not independent research.
The term ‘Oblomovschina’- sometimes translated into English as ‘Oblomovism’- refers to the extreme inertia embodied by Ilya Ilyich Oblomov, the main character of the eponymous 19th-century Russian novel Oblomov.
A member of the landed gentry, Oblomov lives off the income from his country estate and rarely leaves his bed, with his first physical movement in the story - from bed to chair - occurring only after roughly 50 pages.
- Our Services: SIPP Account | Stocks & Shares ISA | See all Investment Accounts
His behaviour stands in stark contrast to that of his childhood friend, Andrei Ivanovich Stolz, a diligent and practical man who consistently attempts to help Oblomov reform and solve his problems. Ultimately, Oblomov dies unfulfilled, having missed opportunities for success, personal growth, and love - losing his fiancée to Stolz, who, in contrast, builds a successful career.
Arguably, Oblomov and Stolz can be seen as personifications of a fund's beta, with Oblomov representing a low beta strategy - one that moves less than the market - and Stolz embodying a high beta strategy, which, conversely, moves more than the market. However, the world of investment management operates according to a different logic than that of 19th-century Russian literature.
To investigate whether higher systematic risk (high beta) consistently drove superior performance or if lower risk (low beta) resulted in better outcomes, we analysed key developed market equity sectors.
To identify the investment companies with the lowest and highest betas in each sector, we used the benchmark most commonly used by sector constituents and measured beta over a five-year period (ending 31 March 2025).
For example, in the AIC Europe sector, we have measured beta relative to the FTSE World Europe ex UK Index, as it serves as benchmark for three of the six constituents. We also examined rolling three-year returns over the past 15 years (to 31 March 2025) - when data was available or the number of sector constituents was sufficient - to assess the consistency of performance patterns over time.
Where Oblomov was rewarded
The AIC Japan sector is notable in that its lower beta constituents have been the strongest performers over the period under review - namely, CC Japan Income & Growth Ord (LSE:CCJI)and Schroder Japan Trust Ord (LSE:SJG). Both have investment approaches that should theoretically lead to lower beta portfolios.
Richard Aston, manager of CCJI, invests in what he considers to be high-quality, attractively valued companies, which should bring a bias to more stable businesses operationally and therefore potentially in terms of their share price performance. Similarly, Masaki Taketsume, manager of SJG, focuses on a mixture of value and quality across the entire market-cap spectrum. By contrast, the other sector constituents are growth-oriented strategies, which usually take more market risk than core strategies. As is often the case with stylistic strategies, these approaches can face challenging periods. Notably, the value factor has dominated in the Japanese equity market during the period under review - especially since 2022 - resulting in a stylistic headwind for growth strategies and benefitting the more ‘core’ and valuation-sensitive approaches of CCJI and SJG.
That said, while both trusts have had lower betas than their sector peers, they actually have betas above one, implying they take more market risk than a simple index strategy. We think this reflects the fact that both investment trusts employ gearing, which has amplified the beta of the NAV. Over the five years to 31 March 2025, CCJI’s average gearing was c. 19%, and SJG’s c. 12%, compared with a simple average of c. 16% for the AIC Japan sector.
This is just one five-year period, of course. It covers the post-pandemic global recovery and the dramatic rise in US interest rates following the lifting of lockdowns. It is interesting that in Japan, lower beta strategies seem to have done the best, which may reflect Japan’s particular economic situation over this period.
We decided to look back over the past 15 years to see if this was a longer pattern: have lower beta strategies always done best in Japan?
The chart below compares the average performance of the two constituents of the AIC Japan sector with the lowest and highest betas, across three-year rolling periods over the past 15 years. It shows that the lowest beta strategies underperformed their highest beta peers in eight out of 13 periods, with the most recent period of underperformance occurring between 1 April 2018 and 31 March 2021. So, higher beta was a better bet on average in Japan.
ROLLING RETURNS
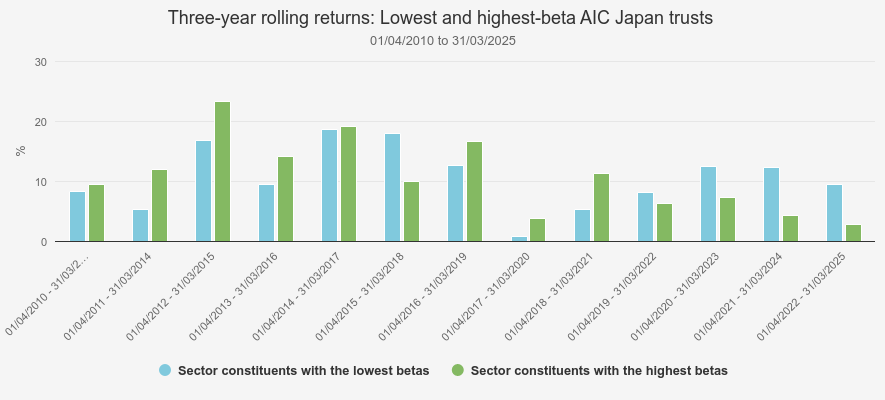
Source: Morningstar. Past performance is not a reliable indicator of future results
In the AIC Global sector, AVI Global Trust Ord (LSE:AGT)- which exhibited a beta of 0.84 over the five years to 31 March 2025 - emerges as the lowest beta constituent and the best performer. Unlike in Japan, however, there was no consistent pattern of strategies with lower betas delivering stronger returns across the sector. We believe AGT’s unique strategy and the composition of the AIC Global sector may explain why it combined both low beta and high performance.
AGT focuses on high-quality companies that its managers believe are overlooked by the market and trade at a discount to their intrinsic value. In our view, this emphasis on undervalued businesses likely contributed to its lower beta, as such stocks may be less reactive to broad market swings, even if they are not immune to them. By contrast, the sector is largely composed of core strategies - whose betas tend to be closer to one - and growth-oriented trusts, which typically are more volatile.
Interestingly, in the AIC Global sector, looking at three-year periods over the past 15 years, we note that the lowest beta strategies have generally delivered better returns than their higher beta sector peers, outperforming in nine out of 12 periods. We believe this may reflect the fact that quality stocks - which are often lower beta - have been in favour over much of the past 15 years. One standout period, however, was 1 April 2016 – 31 March 2019, during which higher beta strategies strongly outperformed their lower beta peers.
This period captured a broad recovery - typically favourable to higher beta stocks due to their greater sensitivity to market movements - following the 2016 market dip, as well as an ultra-low interest rate environment that encouraged risk-taking. Since the post-Covid reopening, however, there has been no consistent pattern of outperformance by either lower or higher beta strategies. This inconsistency reflects rapidly shifting market conditions. The 2022 bear market had a particularly negative impact on higher beta growth stocks but was followed by the dominance of the 'Magnificent Seven' - especially NVIDIA Corp (NASDAQ:NVDA) - which tend to be higher beta names. This was in turn followed by a sell-off in early 2025, amid rising trade tensions that prompted investors to reduce risk.
ROLLING RETURNS
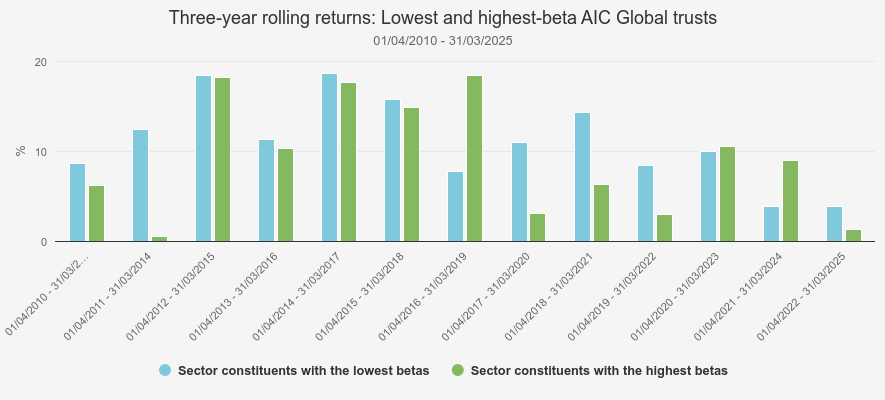
Source: Morningstar. Past performance is not a reliable indicator of future results
Where Stolz prevailed
Interestingly, in the UK we observe the exact opposite pattern from these two sectors over the same time frame. Note that we have grouped the AIC UK All Companies and AIC UK Equity Income sectors in a single UK ‘supersector’, as the constituents of the two sectors share the same investable universe.
In this supersector, Temple Bar Ord (LSE:TMPL), the investment trust with the highest beta relative to the FTSE All-Share Index - at 1.24 - was also the best performer. TMPL’s unabashed value strategy has led it into cyclical sectors over the past five years, which has brought high beta as well as good returns. The trust has significant exposure to the financials and energy sectors, accounting for 32.4% and 15.1% of the portfolio respectively as of 31 March 2025. In addition, TMPL’s average gearing of c. 7.5% over the five-year period may have further contributed to the trust’s higher beta.
TMPL is managed by Ian Lance and Nick Purves at Redwheel, who aim to identify quality companies trading at significant discounts to intrinsic value and to hold them until their share prices more accurately reflect that value. While constituents of the supersector lean toward the value factor on average, TMPL has the highest exposure to value stocks, which we believe partly explains its strong outperformance.
As the value factor dominated market returns in the period under review - similarly to Japan - TMPL benefited from a stylistic tailwind. That said, the trust also returned c. 1.6× the 92.7% returns of the MSCI UK Value Index (in the five years to 31 March 2025), which we believe highlights that the trust’s performance was driven by alpha as well as its style bias.
The investment trust in our UK supersector that exhibited the lowest beta over the review period was Diverse Income Trust Ord (LSE:DIVI), with a beta of 0.77 over the five years to 31 March 2025. We believe this low beta is largely attributable to DIVI’s strong exposure to micro-cap stocks, which are less frequently traded due to their lower liquidity and therefore tend to move less than the large-cap stocks that dominate the FTSE All-Share Index. In addition, DIVI has maintained a net cash position throughout the period, further reducing its sensitivity to market movements.
As a result, we also examined the trust with the next lowest beta in the supersector - Finsbury Growth & Income Ord (LSE:FGT)-with a beta of 0.83. In many ways, FGT stands in stark contrast to TMPL, with the highest allocation to growth stocks in the supersector, as illustrated in the chart below.
Managed by Nick Train since 2000, FGT runs a concentrated portfolio of 19 holdings (as of 31 March 2025), selected for their quality characteristics and growth potential. The portfolio has historically had little or no gearing, avoiding an increase in market exposure.
STYLE EXPOSURE
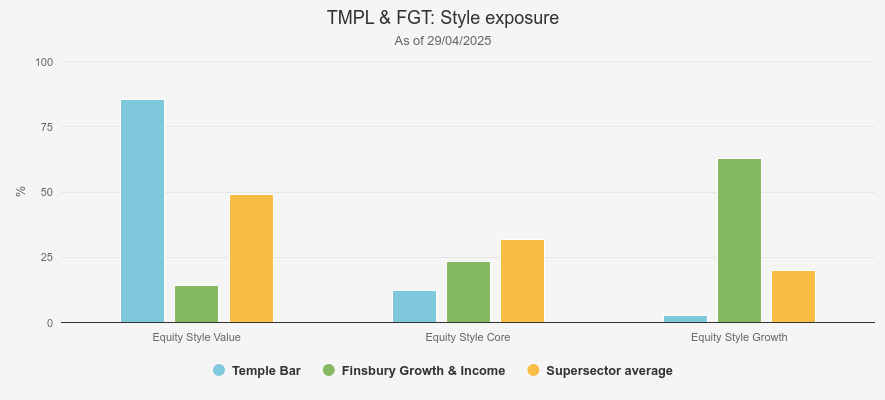
Source: Morningstar
While quality stocks, such as those Nick aims to hold, tend to be less sensitive to market fluctuations, they have largely been out of favour during the period under review. As a result, FGT has faced a stylistic headwind, which we think partly explains its underperformance of every other constituent in the AIC UK Equity Income sector over this time frame. It is interesting how quality worked in Japan, but not in the UK over this five-year period.
While high beta has outperformed over the past five years in the UK, a lower beta approach has generally outperformed over the past 15 years (in eight of the periods). However, two of the three periods in which higher beta strategies outperformed occurred during time frames that encompass the post-Covid era. This coincided with the strong performance of cyclical sectors - such as energy and financials - which tend to include higher beta stocks.
ROLLING RETURNS
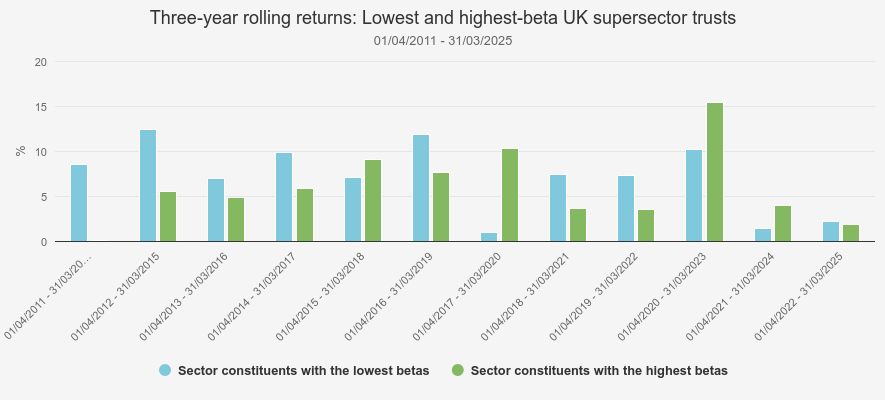
Source: Morningstar. Past performance is not a reliable indicator of future results
Where neither Oblomov nor Stolz stood out
In the remaining AIC sectors examined in this research, neither a lower nor a higher beta consistently corresponded with the best or worst performance. For example, in the AIC Europe sector, the top performer was JPMorgan European Growth & Income Ord (LSE:JEGI), which had a beta of 1.02 relative to the FTSE World Europe ex UK Index - broadly in line with the sector median of 1.03.
Managed by Alexander Fitzalan Howard, Zenah Shuhaiber and Timothy Lewis, JEGI follows a core strategy that blends JPMorgan’s investment principles of quality, value and momentum. In our view, this balanced approach - combined with moderate gearing -may have helped the trust navigate a value-driven market environment more effectively than the more volatile high-growth strategies and the lower beta, quality-focused peers also present in the sector.
For the AIC North America sector, we excluded strategies focused on Canadian equities. Similarly to Europe, the best-performing investment trust in North America was JPMorgan American Ord (LSE:JAM), a core strategy, whose beta of 1.10 relative to the S&P 500 Index was above the curated sector’s simple average of 1.02 but not the highest in the sector.
This higher beta can likely be attributed to the presence of income strategies within the sector, which tend to be less volatile due to their emphasis on stable, dividend-paying companies, as well as JAM’s use of gearing, which averaged 5.1% over the past five years - the highest in the sector. That said, JAM still exhibited a lower beta than Baillie Gifford US Growth Ord (LSE:USA), a trust focused on high-growth stocks.
Over the past 15 years, low beta strategies have generally outperformed in Europe, while high-growth strategies have typically performed better in North America. This reflects the markedly different economic environments in these regions over the period, as well as the distinct nature of their equity markets.
Since the global financial crisis in 2008, Europe has experienced sluggish economic growth, which has favoured defensive sectors such as consumer staples and healthcare - areas that typically exhibit lower betas than the broader market.
In contrast, the US has enjoyed more resilient GDP growth and a stock market rich in growth-oriented sectors such as technology, where stocks tend to have higher betas, where Europe arguably does not offer as much. Another contributing factor may be the more risk-tolerant mindset of US investors, who are generally more willing to accept market risk in pursuit of higher returns.
ROLLING RETURNS
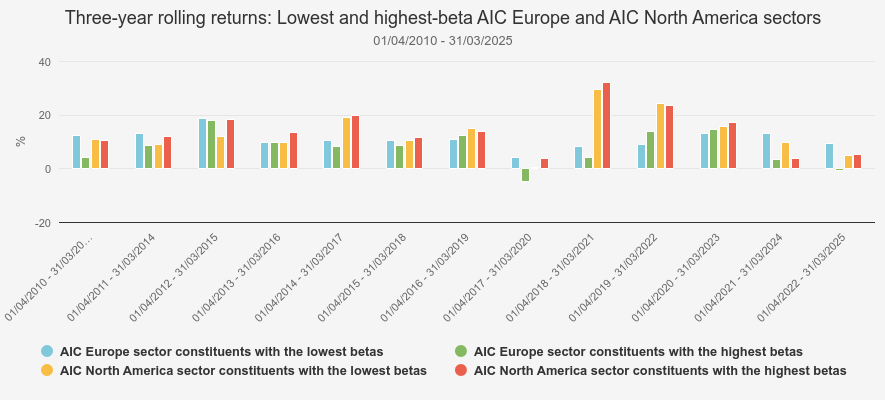
Source: Morningstar. Past performance is not a reliable indicator of future results
Conclusion
While there has been no clear evidence that either lower or higher beta strategies consistently led to better performance over the past five years (to 31 March 2025), longer-term patterns suggest that lower beta strategies have usually been the better bet. However, the one big counter-example has been the US, which would have been the key driver of any portfolio returns over the past five or 15 years.
In the AIC Global and AIC Europe sectors, as well as in the UK supersector, low beta strategies most often outperformed. We think this is likely due to the prominence of low beta quality stocks, particularly in Europe and the UK, operating in regions where economic growth was subdued. While higher beta strategies have performed better in post-Covid periods in the UK - driven by investment trusts focused on cyclical, higher beta sectors - this trend is less apparent in the AIC Europe sector.
The post-Covid picture is also mixed in the AIC Global sector. Higher beta strategies saw periods of outperformance during the dominance of the Magnificent Seven - which tend to be higher beta stocks, albeit with some variation between them. However, the bear market of 2022 and recent turbulence caused by rising trade tensions have once again favoured lower beta strategies.
A possible conclusion is that, unlike in Ivan Goncharov’s novel, being as indolent as Oblomov or as driven as Stolz has not been predictive of performance. Instead, factors such as the macroeconomic environment, the nature of the equity market, and investment style may have played a more prominent role.
However, the US stands out as a region where higher beta strategies have consistently outperformed, reflecting both a stronger economic backdrop and the nature of its equity market, which offers a rich pipeline of growth opportunities.
When it comes to investing for the next five years, we think it will be important to consider whether the environment is more likely to be like the ones that we saw in the UK and Europe over the past 15 years, or more like the one we saw in the US.
Kepler Partners is a third-party supplier and not part of interactive investor. Neither Kepler Partners or interactive investor will be responsible for any losses that may be incurred as a result of a trading idea.
These articles are provided for information purposes only. Occasionally, an opinion about whether to buy or sell a specific investment may be provided by third parties. The content is not intended to be a personal recommendation to buy or sell any financial instrument or product, or to adopt any investment strategy as it is not provided based on an assessment of your investing knowledge and experience, your financial situation or your investment objectives. The value of your investments, and the income derived from them, may go down as well as up. You may not get back all the money that you invest. The investments referred to in this article may not be suitable for all investors, and if in doubt, an investor should seek advice from a qualified investment adviser.
Full performance can be found on the company or index summary page on the interactive investor website. Simply click on the company's or index name highlighted in the article.
Important Information
Kepler Partners is not authorised to make recommendations to Retail Clients. This report is based on factual information only, and is solely for information purposes only and any views contained in it must not be construed as investment or tax advice or a recommendation to buy, sell or take any action in relation to any investment.
This report has been issued by Kepler Partners LLP solely for information purposes only and the views contained in it must not be construed as investment or tax advice or a recommendation to buy, sell or take any action in relation to any investment. If you are unclear about any of the information on this website or its suitability for you, please contact your financial or tax adviser, or an independent financial or tax adviser before making any investment or financial decisions.
The information provided on this website is not intended for distribution to, or use by, any person or entity in any jurisdiction or country where such distribution or use would be contrary to law or regulation or which would subject Kepler Partners LLP to any registration requirement within such jurisdiction or country. Persons who access this information are required to inform themselves and to comply with any such restrictions. In particular, this website is exclusively for non-US Persons. The information in this website is not for distribution to and does not constitute an offer to sell or the solicitation of any offer to buy any securities in the United States of America to or for the benefit of US Persons.
This is a marketing document, should be considered non-independent research and is subject to the rules in COBS 12.3 relating to such research. It has not been prepared in accordance with legal requirements designed to promote the independence of investment research.
No representation or warranty, express or implied, is given by any person as to the accuracy or completeness of the information and no responsibility or liability is accepted for the accuracy or sufficiency of any of the information, for any errors, omissions or misstatements, negligent or otherwise. Any views and opinions, whilst given in good faith, are subject to change without notice.
This is not an official confirmation of terms and is not to be taken as advice to take any action in relation to any investment mentioned herein. Any prices or quotations contained herein are indicative only.
Kepler Partners LLP (including its partners, employees and representatives) or a connected person may have positions in or options on the securities detailed in this report, and may buy, sell or offer to purchase or sell such securities from time to time, but will at all times be subject to restrictions imposed by the firm's internal rules. A copy of the firm's conflict of interest policy is available on request.
Past performance is not necessarily a guide to the future. The value of investments can fall as well as rise and you may get back less than you invested when you decide to sell your investments. It is strongly recommended that Independent financial advice should be taken before entering into any financial transaction.
PLEASE SEE ALSO OUR TERMS AND CONDITIONS
Kepler Partners LLP is a limited liability partnership registered in England and Wales at 9/10 Savile Row, London W1S 3PF with registered number OC334771.
Kepler Partners LLP is authorised and regulated by the Financial Conduct Authority.