ii investment performance review 2023
In 2023, inflation dominated headlines, there was a resurgence in Japanese equities, and technology-related stocks trumped the market. We round up the headlines and data for the year.
12th January 2024 09:13

Market round-up
The start of the year saw the reopening of China’s economy and a renewal of risk appetite due to the improving global economic outlook. The reopening, however, underwhelmed beyond an initial boost to markets, as worsening geopolitical tensions between China and the US impacted demand. In China, we also saw a regulatory crackdown on the technology and education sectors, and a crisis in the real estate sector (a major driver of GDP growth), which had the potential to spill over into the Chinese financial sector, all of which weighed on sentiment.
- Invest with ii: Open an ISA | ISA Investment Ideas | ISA Offers & Cashback
Inflation continued to dominate headlines along with subsequent rate hikes by numerous central banks around the world in their ongoing battle to tame inflation, arising from energy and food price shocks resulting from the war in Ukraine and ongoing post-pandemic problems. While there was initial optimism of tempered rate hikes and perhaps rate cuts being on the horizon as inflation appeared to have peaked; this faded quickly as it became apparent that central banks were predicting a “higher for longer” interest rate environment. Core inflation proved stickier than expected with rises in wages due to an exceptionally resilient labour market, exacerbated by the cost-of-living crisis. In the UK, the latest inflation figure (November) stands at 3.9%, down from 10.1% in January, while core inflation fell from 5.8% to 5.1% over the same period, peaking at 7.1% in May. In the US, inflation fell from 6.4% to 3.1% over the same period with core inflation falling from 5.6% to 4.0%.
Despite typically being more interest-rate sensitive, technology-related stocks trumped the market in 2023, specifically the “Magnificent Seven” (Apple Inc (NASDAQ:AAPL), Microsoft Corp (NASDAQ:MSFT), Alphabet Inc Class A (NASDAQ:GOOGL), Amazon.com Inc (NASDAQ:AMZN), NVIDIA Corp (NASDAQ:NVDA), Meta Platforms Inc Class A (NASDAQ:META) and Tesla Inc (NASDAQ:TSLA)), all of which are involved in artificial intelligence (AI) or high-end semiconductor chips which are needed to power AI. This enthusiasm surrounding AI went into overdrive with the release of AI powered chatbots, OpenAI’s ChatGPT and Google’s Bard in early 2023. This enthusiasm was not unfounded given AI’s boundless potential and the significant progress already made in AI image and music generation, and in scientific research.
2023 saw the resurgence of Japanese equities, which hit a 33-year high and outperformed the broad market in local currency terms. One factor for this is cyclical, with the Japanese economy reopening later than most after Covid-19 pandemic. In addition, after decades of deflation or low inflation, Japan saw a welcome return of inflation following the pandemic, driven by the weak yen. Another long-term structural change comes from the Tokyo Stock Exchange (TSE) pushing corporate governance reforms focused on enhancing corporate value and sustainable growth for shareholders. These reforms are particularly targeted at companies with a price-to-book (PB) ratio below 1.
While these themes played out over the entirety of 2023, it would be remiss not to mention some of the “flash” events that shocked the markets, which include the collapse of Silicon Valley Bank and several other US regional banks, together with the collapse of Credit Suisse and subsequent takeover by UBS, which caused concerns over the resilience of the banking system. Investors also had to navigate potential chaos concerning the US debt ceiling in Q2 as the ideological divide on the issue at Capitol Hill seemed insurmountable at the time, threatening the first US default in history. Although a deal to lift the debt ceiling was reached in late May, ratings agency Fitch has since stripped the US of its top credit rating, citing fiscal deterioration and repeated debt-ceiling negotiations that threaten the US government’s ability to pay its bills. Meanwhile, Moody’s downgraded its outlook on the US from “stable” to “negative”. Moreover, we also saw the outbreak of conflict between Hamas and Israel in October that has the potential to spread into the wider region, with shipping lanes in the area being targeted and threatening global supply chains.
Note: all returns are quoted on a sterling basis, unless otherwise stated.
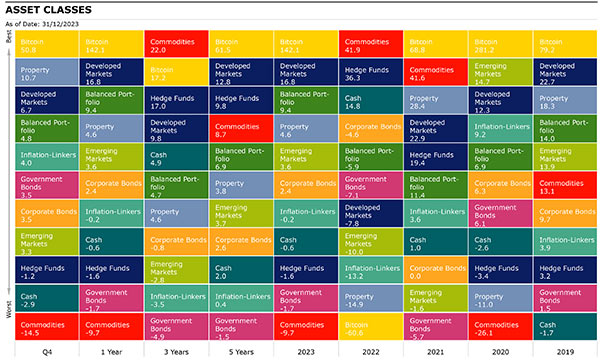
Source: Morningstar as of 31 December 2023. Total Returns in GBP. Developed Markets: MSCI World, Emerging Markets: MSCI EM, Corporate Bonds: Bloomberg Global Aggregate Corporate, Commodities: S&P GSCI, Property: FTSE EPRA Nareit Developed, Inflation-Linkers: Bloomberg Global Inflation Linked, Government Bonds: Bloomberg Global Treasury, Bitcoin: MarketVector Bitcoin, Hedge Funds: Morningstar Broad Hedge Fund, Balanced Portfolio: FTSE UK Private Investor Balanced, Cash: ICE LIBOR 1 Month.
Equities
After a torrid 2022, global equities closed the year up 15.31% as measured by MSCI ACWI, with Developed Markets (DM) outperforming Emerging Markets (EM) having returned 16.81% and 3.63% respectively. In terms of size, global large-cap equities led the way (16.49%), while global small-caps (10.25%) and mid-caps (8.85%) underperformed.
UK equities underperformed the broad market having returned 7.92% in the year. The best-performing sectors were Technology (36.28%), Industrials (25.62%) and Consumer Discretionary (23.14%), while the largest detractors were Consumer Staples (-11.70%) and Basic Materials (-8.03%), which suffered in H1 amid weak commodities prices and concerns over China’s economic outlook impacting demand.
In the US, the S&P 500 rose 19.17% in 2023 with large-caps leading the way (21.03%) while mid- and small-caps gained 8.26% and 11.21% respectively. The best-performing sectors were Technology (48.53%), Communications (46.61%) and Consumer Discretionary (33.99%), the largest detractors were Utilities (-13.21%), Energy (-7.89%) and Consumer Staples (-5.92%).
European equities rose 14.83% for the year and like the broad market, large-caps (16.07%) outperformed small (10.22%) and mid-caps (8.64%). Technology also led the way in Europe having gained 31.08% followed by Industrials (22.55%) and Financials (19.10%) which benefited from rising interest rates.
Japanese equities rose 13.27% in sterling terms, underperforming the broad market due to a weak yen. In local currency, Japanese equities gained 28.26% this year. Japanese large-caps (15.11%) outperformed mid (10.31%) and small-caps (9.72%) with all sectors seeing positive returns bar one, Pharmaceuticals (-10.51%).
Emerging Markets rose modestly having gained 3.63% this year, with Brazil (25.21%) being one of the bright spots due to easing fiscal policy concerns, improving economic data and the potential of rate cuts which became reality in Q3 with four rate cuts since August. Taiwan also contributed positively to EM returns as MSCI Taiwan gained 23.06% driven by Taiwan Semiconductor Manufacturing Co Ltd ADR (NYSE:TSM), which benefited greatly from the enthusiasm surrounding AI.
The most notable detractor was Chinese equities, which fell 16.21% as the boost from the reopening of its economic fell short due to geopolitical tensions with the US, regulatory crackdowns on certain sectors, and a flagging real estate sector threatening to cause issues in the financial system. Other notable detractors include Turkey (-11.00%) as inflation ran wild before the central bank finally reversed its loose monetary policy and adopted a more orthodox approach.
| Q4 | 1 year | 3 years | 5 years | |
| India | 7.13 | 13.99 | 14.60 | 11.76 |
| TOPIX Japan | 3.41 | 13.27 | 3.47 | 6.82 |
| World Value | 4.52 | 5.50 | 9.86 | 8.22 |
| FTSE 100 | 2.31 | 7.93 | 10.21 | 6.79 |
| China | -8.29 | -16.21 | -16.51 | -2.82 |
| FTSE All Share | 3.23 | 7.92 | 8.61 | 6.61 |
| Emerging Markets | 3.28 | 3.63 | -2.84 | 3.67 |
| FTSE Small Cap | 6.31 | 6.73 | 4.31 | 7.64 |
| S&P 500 | 6.94 | 19.17 | 12.59 | 15.66 |
| Asia Pacific Ex Japan | 3.26 | 1.31 | -2.65 | 4.63 |
| MSCI ACWI | 6.31 | 15.31 | 8.24 | 11.70 |
| World | 6.67 | 16.81 | 9.80 | 12.78 |
| Brazil | 12.83 | 25.21 | 10.29 | 5.04 |
| FTSE 250 | 8.57 | 8.03 | 1.42 | 5.12 |
| World Growth | 7.94 | 25.71 | 6.10 | 14.56 |
| Europe Ex UK | 7.56 | 14.83 | 7.38 | 9.81 |
Source: Morningstar as of 31st December 2023. Total Returns in GBP. MSCI ACWI World Indexes.
Sectors/Style
As alluded to in earlier sections, IT gained 42.51% in 2023 having rebounded from the dismal performance it had in 2022, much of which can be attributed to the market enthusiasm over the potential of AI and the semiconductor chips required to power AI models. Within this global sector, three of the Magnificent Seven make up over 40% of the index (Apple, Microsoft and Nvidia).
Communication Services and Consumer Discretionary also outperformed this year having posted 29.98% and 21.85% respectively. However, this was not quite enough to offset the losses these two sectors incurred in 2022. These two sectors also benefit from the AI theme as the remaining stocks in the Magnificent Seven have a high weighting in these sectors; Alphabet and Meta make up over 45% of the Communication Services Index, while Amazon and Tesla make up almost 30% of the Consumer Discretionary sector.
Perhaps not surprisingly then, global growth massively outperformed its value counterpart having returned 25.71% this year, while value returned 5.50%, reflecting the relative performance of those styles within the US equity market.
| Q4 | 1 years | 3 years | 5 years | |
| Energy | -7.05 | -0.96 | 26.78 | 8.87 |
| Communication Services | 4.67 | 29.98 | 1.71 | 8.61 |
| Financials | 7.69 | 9.03 | 11.58 | 8.95 |
| Health Care | 1.41 | -2.26 | 7.00 | 9.97 |
| Materials | 6.81 | 5.81 | 6.85 | 10.55 |
| Industrials | 8.45 | 15.02 | 9.67 | 11.57 |
| Consumer Discretionary | 5.15 | 21.85 | 0.98 | 10.86 |
| Information Technology | 12.56 | 42.51 | 12.44 | 23.15 |
| Consumer Staples | 0.89 | -3.29 | 4.49 | 6.93 |
| Utilities | 6.06 | -5.21 | 4.16 | 5.77 |
Source: Morningstar as of 31st December 2023. Total Returns in GBP. MSCI ACWI World Indexes.
Fixed Income
The Bloomberg Global Aggregate Index fell 0.25% in 2023 in sterling terms but rose 5.72% in dollar terms, with Q4 being an exceptionally good quarter as sentiment on monetary policy began to shift, as markets begin to anticipate rate cuts being on the horizon. Global corporates rose 2.35% in sterling terms, outperforming global treasuries. The story is the same in the UK, Europe, and the US. Investment grade bonds were outperformed by global high yield (HY), which rose 7.61% this year as these bonds tend to be less sensitive to interest rate movements than investment grade bonds.
- Benstead on Bonds: will fixed income reward investors in 2024?
- Bonds expected to be the best-performing investment in 2024
In the UK, gilts returned 3.69% and outperformed inflation-linked gilts (0.93%) in 2023 due to the latter having a higher duration profile, which is unfavourable when interest rates rise. Gilts and inflation-linked bonds rose 8.11% and 9.41% respectively in Q4 as the Bank of England opted to hold rates at 5.25% from August, with expectations of future falls being priced in.
The UK gilt 2-year yield rose over the year from 3.57% to 3.97% with a peak of 5.50%, while the 10-year yield fell marginally from 3.67% to 3.54%, with a peak of 4.75%.
US Treasury 2-year yield fell from 4.41% to 4.25% with a peak of 5.21%, while the 10-year yield rose from 3.79% to 3.86%, with a peak of 4.99%.
| Q4 | 1 year | 3 years | 5 years | |
| Global High Yield | 3.94 | 7.61 | 2.53 | 3.89 |
| Sterling Corporate | 7.37 | 8.62 | -4.67 | 0.47 |
| EURO Corporate | 5.51 | 5.67 | -3.83 | -0.64 |
| Global Corporate | 3.48 | 2.35 | -0.78 | 2.63 |
| Global Aggregate | 3.50 | -0.25 | -3.28 | -0.33 |
| Global Government | 3.50 | -1.70 | -4.87 | -1.49 |
| UK Gilts | 8.11 | 3.69 | -9.18 | -2.82 |
| Global Inflation Linked | 3.95 | -0.19 | -3.55 | 0.35 |
| UK Inflation Linked | 9.41 | 0.65 | -11.83 | -4.09 |
Source: Morningstar as of 31 December 2023. Total Returns in GBP. Global Aggregate: Bloomberg Global Aggregate, Global Government: Bloomberg Global Treasury, UK Gilts: FTSE Act UK Conventional Gilts All Stocks. Global Corporate: Bloomberg Global Corporate, Sterling Corporate: ICE BofA Sterling Non-Gilt, Euro Corporate: Markit iBoxx EUR, Global High Yield: Bloomberg Global High Yield, Global Inflation Linked: Bloomberg Global Inflation Linked, UK Inflation Linked: Bloomberg Global Inflation Linked UK.
Commodities and Alternatives
The S&P GSCI Index fell 9.67% as all commodity sectors fell in 2023 after an exceptional 2022. Energy fell 10.51% after rising dramatically in 2022 due to energy price shocks, with the outbreak of war in Ukraine resulting in sanctions on Russian oil and gas. Oil prices declined 15.38% despite the announcement of production cuts by Saudi Arabia and Russia in Q3 (with the rest of OPEC+ joining in shortly after).
| Q4 | 1 year | 3 years | 5 years | |
| Volatility | -31.96 | -45.79 | -16.28 | -13.32 |
| Brent Crude Oil | -20.00 | -15.38 | 16.83 | 7.42 |
| Commodity | -14.53 | -9.67 | 21.98 | 8.70 |
| Energy | -20.28 | -10.51 | 32.49 | 8.58 |
| Global Natural Resources | -0.82 | -1.79 | 15.52 | 11.13 |
| Hedge Funds | -1.22 | -1.59 | 16.97 | 9.80 |
| Cash | -2.91 | -0.59 | 4.86 | 2.01 |
| Gold | 5.51 | 7.38 | 5.36 | 9.96 |
| UK REITs | 18.90 | 10.69 | -0.94 | 1.32 |
| Global REITs | 10.67 | 4.60 | 4.56 | 3.77 |
| Global Infrastructure | 6.22 | 0.77 | 8.54 | 7.35 |
| Bitcoin | 50.84 | 142.14 | 17.17 | 61.50 |
Source: Morningstar as of 31 December 2023. Total Returns in GBP. Global REITS: FTSE EPRA Nareit Developed, UK REITs: FTSE EPRA Nareit UK, Gold: LBMA Gold Price AM, Oil: Oil Price Brent Crude, Global Infrastructure: S&P Global Infrastructure, Natural Resources: S&P Global Natural Resources, Commodities: S&P GSCI , Energy : S&P GSCI, Hedge Funds: Morningstar Broad Hedge Fund, Volatility: CBOE Market Volatility (VIX), Cash: ICE LIBOR 1 Month, Bitcoin: MarketVector Bitcoin.
Most-traded shares on the ii platform in 2023
Most-bought shares on ii platform in 2023
Most-sold shares on ii platform in 2023
These articles are provided for information purposes only. Occasionally, an opinion about whether to buy or sell a specific investment may be provided by third parties. The content is not intended to be a personal recommendation to buy or sell any financial instrument or product, or to adopt any investment strategy as it is not provided based on an assessment of your investing knowledge and experience, your financial situation or your investment objectives. The value of your investments, and the income derived from them, may go down as well as up. You may not get back all the money that you invest. The investments referred to in this article may not be suitable for all investors, and if in doubt, an investor should seek advice from a qualified investment adviser.
Full performance can be found on the company or index summary page on the interactive investor website. Simply click on the company's or index name highlighted in the article.