ii investment performance review: Q3 2025
Several indices hit all-time highs amid US President Donald Trump backtracking on tariff threats.
15th October 2025 11:39

Market round-up
The third quarter was a strong one for global markets with several indices hitting all-time highs over the period as equities continued to rally, with President Donald Trump having retreated from imposing the highest levels of tariffs that were threatened initially.
The markets continued to be enthralled by all things artificial intelligence (AI), with solid corporate earnings and expectations of rate cuts by the Federal Reserve providing additional tailwinds.
- Our Services: SIPP Account | Stocks & Shares ISA | See all Investment Accounts
Despite a strong quarter, risks and uncertainties remain, and although President Trump’s tariffs were lower than initially feared, it remains to be seen how much upwards pressure this will have on inflation. Companies around the world have been adjusting supply chains to reduce their dependency on the US and China.
In the US, economic resilience has come under increasing focus as there were signs of a weakening labour market as jobs and payroll employment growth were revised down, adding complications for the Federal Reserve should inflation begin to rise again.
There were also political concerns such as the US administration repeatedly threatening the independence of the Fed and a potential shutdown of the US government, which came to pass at the start of October as Congress failed to agree to extend funding.
Meanwhile, there were increasing fiscal pressures in France as it failed to pass budget cuts, with the resignation of Sébastien Lecornu in early October, less than a month into his premiership and following the resignation of François Bayrou, who lost a vote of no confidence in September.
France’s sovereign rating was downgraded from AA- to A+ by Fitch, citing political instability with the country going through five prime ministers in less than two years and a deteriorating fiscal position.
- Interest rates held as inflation threat persists
- Sign up to our free newsletter for share, fund and trust ideas, and the latest news and analysis
There were also fiscal concerns in the UK as borrowing was higher than expected, putting even more scrutiny on the Treasury.
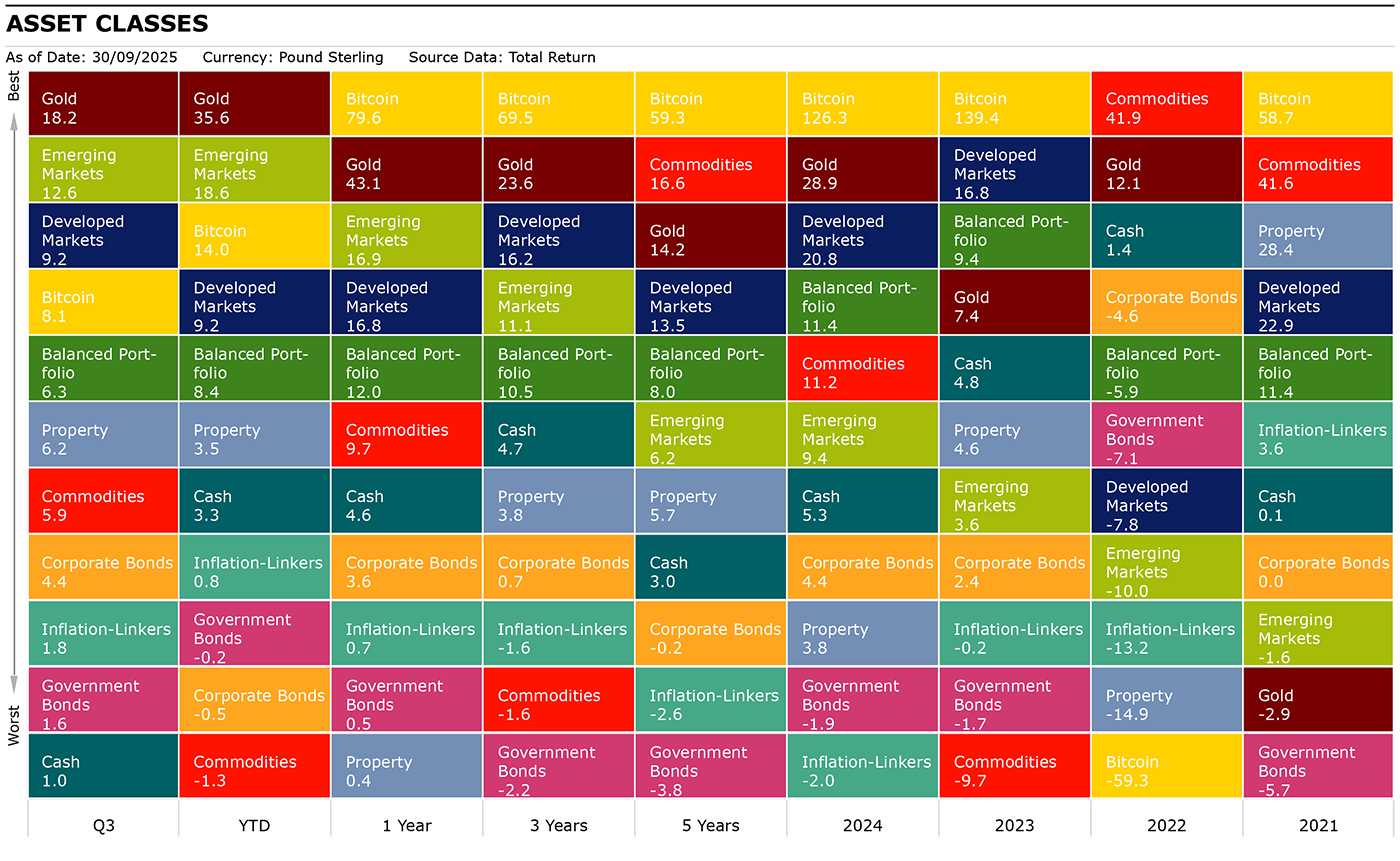
Source: Morningstar as of 30 September 2025. Total Returns in GBP. Developed Markets: MSCI World, Emerging Markets: MSCI EM, Corporate Bonds: Bloomberg Global Aggregate Corporate, Commodities: S&P GSCI, Property: FTSE EPRA Nareit Developed, Inflation-Linkers: Bloomberg Global Inflation Linked, Government Bonds: Bloomberg Global Treasury, Bitcoin: S&P Bitcoin, Balanced Portfolio: FTSE UK Private Investor Balanced, Cash: SONIA Lending Rate, Gold : LBMA Gold Price.
Shares
The MSCI ACWI gained 9.55% over the quarter with emerging markets (EM) outperforming developed markets (DM) as they rose 12.62% and 9.19% respectively.
The S&P 500 saw double-digit gains (10.06%) as it hit an all-time high this quarter, with gains being supported by a solid earnings session, optimism over rate cuts and continued enthusiasm over AI. The best-performing sectors were IT (15.17%), Communication Services (13.97%) and Consumer Discretionary (11.45%) with Consumer Staples (-0.78%) being the only sector that saw negative returns in the US this quarter.
UK equities rose 6.87% in Q3 led by Basic Materials (23.58%) and Industrials (10.07%), with Healthcare (8.70%), Financials (8.47%) and Energy (8.20%) also posting strong returns. Basic Materials benefited from higher gold prices with weaker sterling also supporting broader market returns. Meanwhile, IT (-8.54%) and Utilities (-0.60%) were the only sectors to see a decline over the quarter.
- The fund sector delivering gains of more than 20% in third quarter
- Three dominant themes among top funds
European equities lagged this quarter as the MSCI Europe ex-UK index rose 4.82%, with German equities (0.65%) dragging on performance as higher energy prices and weak demand continued to weigh on the economy.
Meanwhile, MSCI France rose 5.00% despite political instability and economic uncertainty in Q3. From a sector perspective, Financials (11.10%), Consumer Discretionary (7.36%) and Industrials (6.39%) contributed to performance in the region, while Communication Services (-3.65%), Consumer Staples (-2.72%) and Materials (-1.33%) detracted from performance.
In Japan, the TOPIX rose 10.55% as it hit a record high during the quarter as a weaker yen, lower-than-expected US tariffs and corporate governance reforms all contributed to outperformance by Japanese equities. The best-contributing sectors were Steel & Nonferrous (36.03%), Energy Resources (28.92%) and Banks (21.05%), while Retail Trade (0.72%), Pharmaceuticals (1.49%) and IT & Services (5.17%) lagged the market. No sectors saw negative returns in Q3.
The MSCI EM Index rose 12.62% with China being a bright spot as it rose 22.86% during the quarter, other index heavyweights such as Taiwan (16.38%) and South Korea (14.76%) also contributed to outperformance, while India was a notable laggard within EM as it struggled due to the US imposing a 50% tariff on most exports from India.
Numerous smaller index constituents such as Egypt (27.05%), Peru (25.26%) and South Africa (22.55%) saw particularly strong returns over the quarter.
In general, EM benefited from progress on US-China trade talks which lifted sentiment, a weaker US dollar and higher commodities prices.
From a sector perspective, all sectors saw positive returns with the best-performing sectors being Materials (26.20%), Communication Services (21.67%) and Consumer Discretionary (20.90%), while Energy (2.04%), Financials (2.08%) and Consumer Staples (2.82%) were the worst performers.
| Q3 (%) | YTD (%) | 1 year (%) | 3 years (%) | 5 years (%) | |
| FTSE All-Share | 6.87 | 16.58 | 16.17 | 14.47 | 12.99 |
| FTSE 100 | 7.53 | 17.74 | 17.53 | 14.84 | 13.89 |
| FTSE 250 | 2.70 | 9.75 | 8.18 | 12.33 | 8.03 |
| FTSE Small Cap | 2.14 | 9.43 | 8.91 | 11.43 | 11.29 |
| Europe Ex UK | 4.82 | 18.96 | 13.92 | 15.78 | 10.35 |
| S&P 500 | 10.06 | 6.83 | 17.17 | 17.37 | 15.53 |
| Asia Pacific Ex Japan | 11.63 | 16.39 | 14.48 | 11.21 | 6.29 |
| TOPIX Japan | 10.55 | 14.13 | 17.30 | 14.33 | 8.37 |
| Emerging Markets | 12.62 | 18.64 | 16.89 | 11.06 | 6.15 |
| Brazil | 10.21 | 30.16 | 12.40 | 3.43 | 10.09 |
| China | 22.86 | 31.75 | 30.28 | 12.23 | -0.40 |
| India | -5.95 | -8.89 | -13.47 | 3.62 | 12.19 |
| World | 9.19 | 9.25 | 16.82 | 16.23 | 13.49 |
| MSCI ACWI | 9.55 | 10.18 | 16.84 | 15.67 | 12.63 |
| World Growth | 10.93 | 10.77 | 21.77 | 19.82 | 12.34 |
| World Value | 8.03 | 9.47 | 11.73 | 11.34 | 12.54 |
Source: Morningstar as of 30 September 2025. Total Returns in GBP. MSCI ACWI World Indexes. Past performance is not a guide to future performance.
Sectors/Style
Stylistically, global growth (10.93%) outperformed global value (8.03%) in Q3 with growth sectors such as IT (14.78%) and Communications Services (13.80%) leading the charge as the AI tailwind continue to attract inflows, while Consumer Discretionary (11.60%) also saw double-digit returns. Notably, Materials (13.21%) was also a strong performer this quarter, while Consumer Staples (-0.02%) and Healthcare (5.14%) lagged.
At the global level, large-caps and small-caps saw similar levels of returns, 10.06% and 10.01% respectively, while mid-caps saw lower returns at 6.83% although there are regional variations. In the UK and EM, large-caps led mid and small-caps, while in Japan, small-caps (12.86%) outperformed mid (10.81%) and large-caps (10.17%), and in Europe, mid-caps (5.20%) outperformed large (4.73%) and small-caps (3.26%).
| Q3 (%) | YTD (%) | 1 year (%) | 3 years (%) | 5 years (%) | |
| Consumer Discretionary | 11.60 | 2.45 | 15.71 | 12.09 | 6.95 |
| Healthcare | 5.14 | -2.87 | -7.84 | 0.84 | 4.45 |
| Industrials | 6.56 | 14.79 | 16.95 | 18.05 | 13.61 |
| Information Technology | 14.78 | 14.27 | 27.62 | 28.88 | 18.84 |
| Materials | 13.21 | 15.21 | 4.80 | 7.14 | 8.04 |
| Utilities | 6.75 | 12.35 | 9.81 | 7.45 | 8.54 |
| Consumer Staples | -0.02 | -0.13 | -0.67 | 1.83 | 4.16 |
| Financials | 6.55 | 14.01 | 25.35 | 18.62 | 18.65 |
| Energy | 7.37 | 3.12 | 5.72 | 4.92 | 20.58 |
| Communication Services | 13.80 | 19.42 | 34.01 | 25.48 | 12.83 |
Source: Morningstar as of 30 September 2025. Total Returns in GBP. MSCI ACWI World Indexes. Past performance is not a guide to future performance.
Fixed income
The Bloomberg Global Aggregate Index returned 2.4% with high yield 4.43% outperforming investment-grade bonds. Global corporates rose 4.43%, which outpaced government bonds which returned 1.55% as spreads tightened over the quarter.
Emerging Market Debt (EMD) returned a healthy 4.40% as measured by iShares JP Morgan $ EM Bond ETF GBP H Dist (LSE:EMHG) (sterling hedged), with EMD benefiting from a weaker US dollar. In the UK, corporates also outperformed gilts as they returned 0.68% and -0.62% respectively.
In the UK, the Bank of England cut the base rate by 25 basis points (bps) to 4% in August as it continues to approach monetary policy easing cautiously due to sticky inflation.
- Stockwatch: is recent bolt of panic a warning sign?
- Bond Watch: what the US government shutdown means for markets
There has also been an increased focus on fiscal conditions ahead of the November Budget as year-to-date borrowing was higher than expected. This has pushed gilt yields higher over the quarter with the two-year yield increasing from 3.85% to 3.99%, the 10-year yield from 4.46% to 4.70% and the 30-year yield from 5.21% to 5.51%.
In the US, while there were concerns on debt sustainability, this was outweighed by economic concerns as the labour market showed signs of softening over the quarter, which led to increased expectations for rate cuts.
In response, the Fed announced a 25bps cut to the Fed Funds Rate to 4.00% - 4.25% as inflation has, so far, been manageable despite expectations of upward pressures from tariffs.
Overall, Treasury yields in the US fell in Q3 as the two-year fell from 3.79% to 3.62%, 10-year from 4.24% to 4.15% and 30-year from 4.77% to 4.73%.
| Q3 (%) | YTD (%) | 1 year (%) | 3 years (%) | 5 years (%) | |
| Global Aggregate | 2.40 | 0.39 | 2.03 | -0.93 | -2.35 |
| Global Government | 1.55 | -0.19 | 0.50 | -2.15 | -3.82 |
| UK Gilts | -0.62 | 1.87 | -1.29 | 1.27 | -5.78 |
| Global Corporate | 4.43 | -0.53 | 3.56 | 0.68 | -0.25 |
| Sterling Corporate | 0.68 | 4.16 | 3.69 | 6.93 | -1.07 |
| EURO Corporate | 2.84 | 8.49 | 8.67 | 5.36 | -0.64 |
| Global Inflation Linked | 1.83 | 0.76 | 0.68 | -1.63 | -2.55 |
| UK Inflation Linked | -1.43 | -2.06 | -7.87 | -5.39 | -9.09 |
| Global High Yield | 4.43 | 1.96 | 8.80 | 6.91 | 4.46 |
Source: Morningstar as of 30 September 2025. Total Returns in GBP. Global Aggregate: Bloomberg Global Aggregate, Global Government: Bloomberg Global Treasury, UK Gilts: FTSE Act UK Conventional Gilts All Stocks. Global Corporate: Bloomberg Global Corporate, Sterling Corporate: ICE BofA Sterling Non-Gilt, Euro Corporate: Markit iBoxx EUR, Global High Yield: Bloomberg Global High Yield, Global Inflation Linked: Bloomberg Global Inflation Linked, UK Inflation Linked: Bloomberg Global Inflation Linked UK. Past performance is not a guide to future performance.
Alternatives
The S&P GSCI rose 5.94% over the quarter as all major components of the index saw positive returns with Precious Metals (19.48%) and Livestock (13.40%) outperforming broad commodities, while Agriculture (0.02%) and Energy (3.79%) were relative underperformers.
Within Precious Metals, gold and silver rallied and returned 18.23% and 30.93% respectively as investors sought out safe-haven assets amid economic and political risks such as a weakening US dollar and a US government shutdown, which came to pass in early October.
| Q3 (%) | YTD (%) | 1 year (%) | 3 years (%) | 5 years (%) | |
| Global REITs | 6.18 | 3.50 | 0.38 | 3.76 | 5.68 |
| UK REITs | -5.85 | 5.29 | -10.16 | 2.47 | 0.56 |
| Gold | 18.23 | 35.63 | 43.11 | 23.57 | 14.18 |
| Global Infrastructure | 5.55 | 11.40 | 16.36 | 10.66 | 12.67 |
| Global Natural Resources | 11.47 | 12.86 | 6.65 | 4.02 | 13.36 |
| Volatility | -0.95 | -12.71 | -3.04 | -24.70 | -9.93 |
| Cash | 1.04 | 3.32 | 4.60 | 4.70 | 2.96 |
| Commodity | 5.94 | -1.31 | 9.73 | -1.64 | 16.62 |
| Brent Crude Oil | 0.71 | -17.70 | -8.24 | -13.68 | 8.43 |
| Energy | 3.79 | -7.06 | 7.02 | -4.06 | 21.73 |
| Bitcoin | 8.07 | 13.95 | 79.60 | 69.50 | 59.33 |
Source: Morningstar as of 30 September 2025. Total Returns in GBP. Global REITS: FTSE EPRA Nareit Developed, UK REITs: FTSE EPRA Nareit UK, Gold: LBMA Gold Price AM, Oil: Oil Price Brent Crude, Global Infrastructure: S&P Global Infrastructure, Natural Resources: S&P Global Natural Resources, Commodities: S&P GSCI , Energy : S&P GSCI,Volatility: CBOE Market Volatility (VIX), Cash: SONIA Lending Rate, Bitcoin: S&P Bitcoin. Past performance is not a guide to future performance.
Most-traded shares on the ii platform in Q3 2025
Most-bought shares
Most-sold shares
These articles are provided for information purposes only. Occasionally, an opinion about whether to buy or sell a specific investment may be provided by third parties. The content is not intended to be a personal recommendation to buy or sell any financial instrument or product, or to adopt any investment strategy as it is not provided based on an assessment of your investing knowledge and experience, your financial situation or your investment objectives. The value of your investments, and the income derived from them, may go down as well as up. You may not get back all the money that you invest. The investments referred to in this article may not be suitable for all investors, and if in doubt, an investor should seek advice from a qualified investment adviser.
Full performance can be found on the company or index summary page on the interactive investor website. Simply click on the company's or index name highlighted in the article.