Team China vs Team India: which Asian powerhouse should you back?
7th July 2023 14:00
Kepler Trust Intelligence examines which side investment trust managers are choosing.

This content is provided by Kepler Trust Intelligence, an investment trust focused website for private and professional investors. Kepler Trust Intelligence is a third-party supplier and not part of interactive investor. It is provided for information only and does not constitute a personal recommendation.
Material produced by Kepler Trust Intelligence should be considered a marketing communication, and is not independent research.
Recent estimates are that India’s population has now overtaken China’s, ending the country’s 70-year reign as the most populous nation. However, China’s phenomenal growth story continues to give it the economic edge over its Asian rival. While India surpassed the UK to become the world’s fifth-largest economy in 2022, China’s economy remains more than five times larger than India’s, according to figures from the International Monetary Fund (IMF).
- Invest with ii: Buy Investment Trusts | Top UK Shares | Open a Trading Account
However, India is closing in, having only broken into the global top 10 in 2010 and having more than doubled its GDP since. Indeed, many argue that it’s a matter of when, not if, India will overtake China to become Asia’s leading economy. This has left investors in the region in a quandary: do they stick with the economic powerhouse that is China, or switch to its Silk Road rival, hoping to capture the growth potential on offer? Below, we consider how investment trust managers are handling this potentially epoch-making handover.
Sino-India attractions
First, it is worth revisiting the investment case for each country. India has been one of the fastest growing major economies in the world for over a decade. The country has excellent demographics, driven by a young, well-educated workforce that is not only impacting economic growth, but leading to a big expansion of the middle classes. This is contributing to a burgeoning number of people with disposable income and has been pushing up levels of consumption. It is not just the consumer that is driving the growth, as government reforms are also having an impact. India was previously criticised for having considerable issues with ‘red tape’. However, recent initiatives, such as the ‘Make in India’ policy which is designed to attract global designers and manufacturers, or changes to the Insolvency and Bankruptcy Code, are designed to attract more businesses and investors to the country.
These improvements have not gone unnoticed by markets. As we show in the chart below, the price/earnings (PE) ratio of the Indian market is trading at one standard deviation above its near 15-year average. This has come off the back of good returns for the stock markets. The MSCI India Index has returned 62.9% over the past three years, nearly double that of the MSCI All-Country World Index which has returned 34.2%, and ahead of the S&P 500, FTSE All-Share and MSCI AC Europe Indices over the same period. Whilst the Indian market dipped in the first quarter of 2023, it has since rebounded and data from Refinitiv now values the MSCI India Index’s market capitalisation as larger than both the UK and French stock markets. The market has benefitted from the economic growth story, but valuations are clearly factoring a lot in.
INDIA VALUATIONS
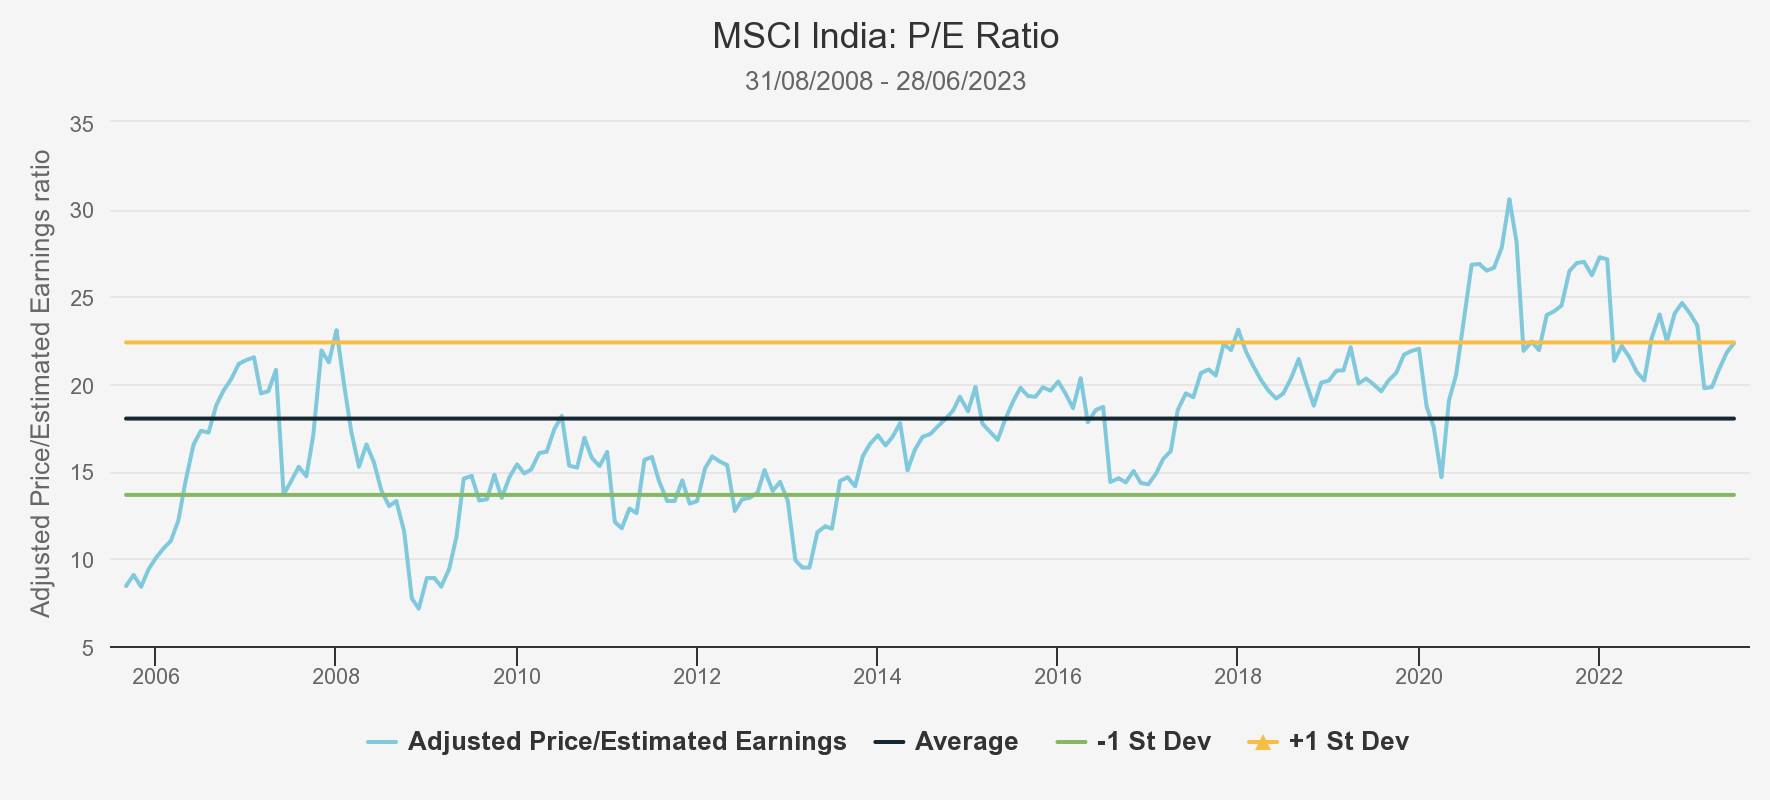
Source: Bloomberg
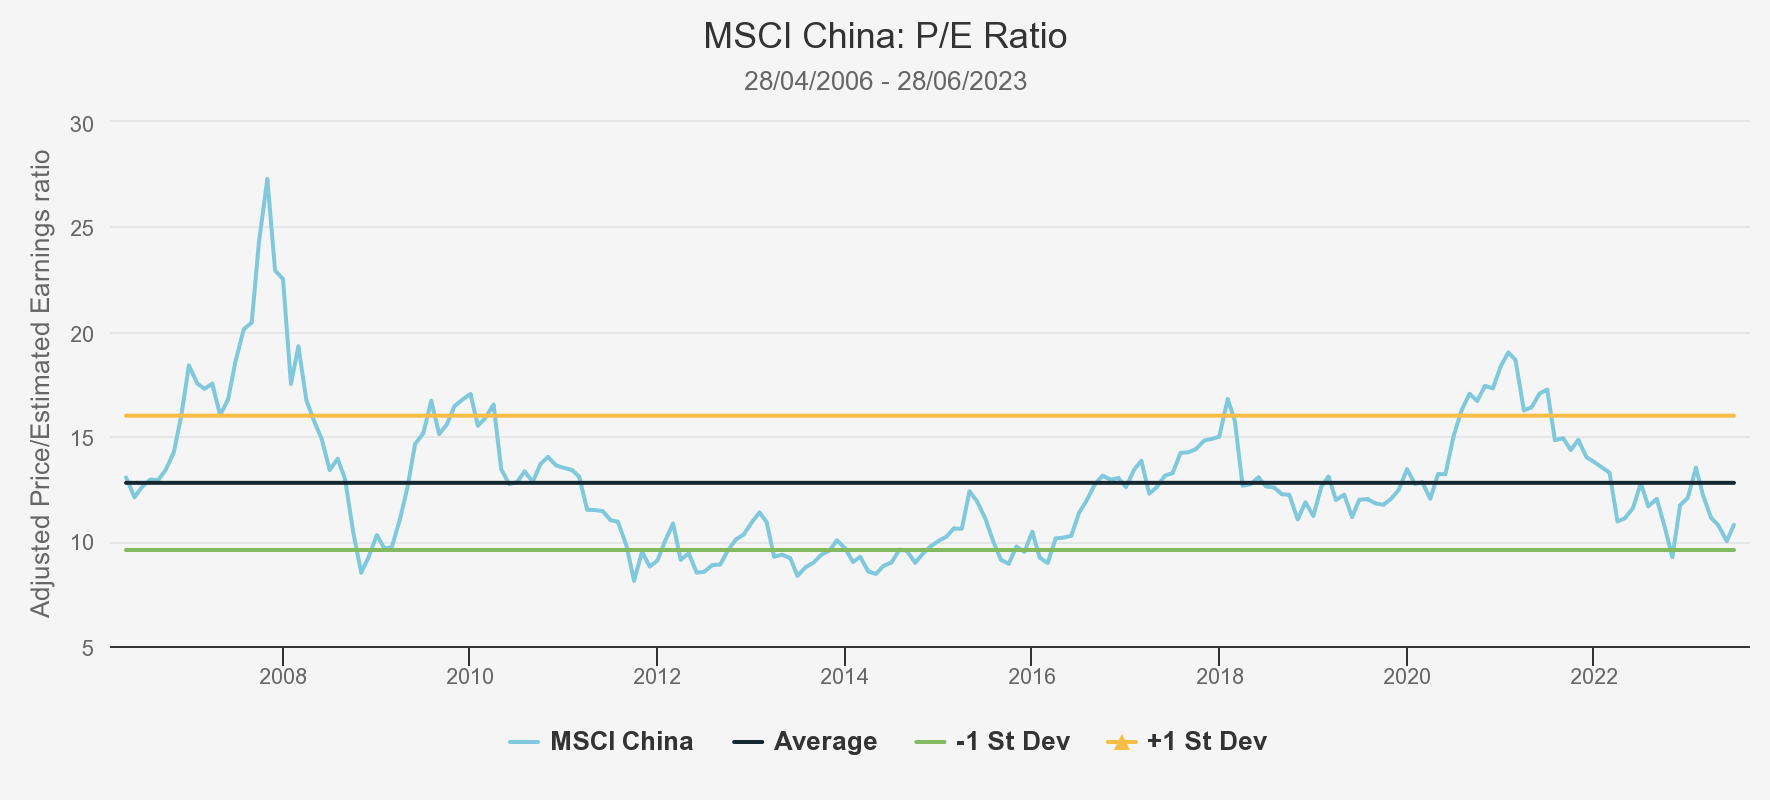
Valuations are one area where China may offer an alternative. The Chinese growth story has faltered recently, as a result of growing geopolitical tensions and the impact of the country’s zero-Covid policy, which has been subsequently abandoned. This is not to mention the ongoing weakness of the real estate market and negative perceptions of government intervention in markets. This has resulted in cheap valuations versus its own history, as is shown in the chart below. However, the country arguably continues to offer numerous opportunities. Despite the difficulties of late, the country still has a compelling growth opportunity, led by the expansion of the middle class. The surging economy of the past few decades has led to vast wealth creation. This has created a big domestic consumer market and an increase in demand for goods and services.
The Chinese government have been very keen to encourage citizens to spend this disposable income on domestic products, thus encouraging a demand-led consumer boom. The government are also spending heavily on infrastructure through the Belt and Road Initiative, which is designed to support the export-focussed manufacturing sector by facilitating better connection to global markets. However, as we have discussed in a previous strategy note, one major problem for China is its demographics, which have turned from a key tailwind to a headwind. The large, low-cost workforce has driven the country to become the world’s workshop over the past few years, which has been a key factor in driving economic growth. This is reversing, though, with a shrinking workforce leading to upward pressure on wages and a growing old-age dependency ratio. However, as Kepler CIO Ed Butchart discussed at our recent event, there is scope for optimism primarily from a recovery in the consumer focussed service sector. Chinese mobility remains significantly below pre-pandemic levels, so there could be more reopening growth to come. As the chart below shows, this recovery potential is available at low aggregate valuations.
CHINA VALUATIONS
Investment Trust allocations
With positives and negatives for both countries, the managers of investment trusts focused on the region have taken a range of different stances. We have detailed these in the table below. The data includes trusts from the three Asian-focused sectors, namely Asia Pacific, Equity Income and Smaller Companies. They have been compared against their reference benchmarks to provide figures for the level of overweight or underweight they have for each country. In two instances, trusts have more than one benchmark, therefore comparisons against both have been given.
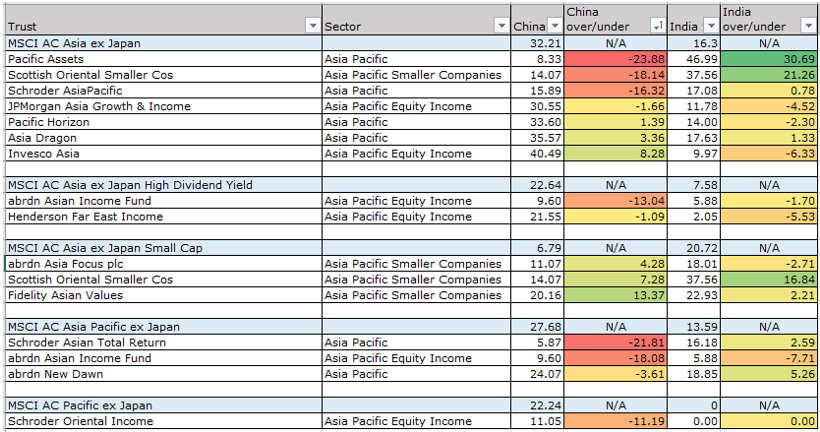
Source: Morningstar, as at 29/06/2023
Some interesting conclusions come from the data in this table. Of the 14 trusts, just six have overweight allocations to China, whereas eight are overweight India. The average underweight to China is 5.68%, whereas the average overweight to India is 3.14%. Using average figures, it seems the investment trust universe prefers the growth story of India, over the valuation opportunity of China – although this is surprisingly modest, given how strong the India growth story is. Anecdotally, managers we speak to often say they love the companies in India, but not the valuations.
One notable exception to the trend is Invesco Asia Ord (LSE:IAT), which has an 8.3% overweight to China, but a 6.3% underweight to India. Managers Ian Hargreaves and Fiona Yang have a strong focus on valuations when looking for growth opportunities in Asia, which supports this positioning. They have pointed to India being one of the most expensive markets in the region, with a trailing P/B ratio far higher than its ten-year average. Their disciplined process has led them to reduce their exposure over the past few months. They still hold a number of companies, but are highly selective. On the other side, the managers have looked through the noise surrounding China, held their nerve and been rewarded for it. They closed the trust’s underweight over the past 18 months, despite the challenging headwinds the country has faced. This positioning and focus on valuations has served the managers well, with the trust now ahead of the both its peer group and benchmark over a five-year period. We believe this contrarian approach helps to set the trust apart from its peer group and makes the trust an interesting complementary option for investors.
Conversely, Schroder Asian Total Return Inv. Company (LSE:ATR) has a large underweight to China and a modest overweight to India. Co-managers Robin Parbrook and King Fuei Lee have a benchmark agnostic approach, meaning they have the flexibility to take significant country allocations if they find opportunities, or not, if they do not see any attraction. The managers have a collaborative approach to building the portfolio, using a combination of stock selection for identifying individual companies alongside a hedging strategy, driven by a quantitative model which helps to identify risks from different countries. As a result of these two inputs, they have increased their underweight to China in 2023. They believe the market was expecting too much impetus from the reopening trade and that share prices had gone too far, following the abandonment of the country’s zero-Covid policies. This positioning has proved beneficial to performance over the past quarter, with the managers opening up a gap against both the index and the sector average over the past six months. The trust returned 0.3% on a NAV basis, versus the index and peer group falling by 1.9% and 2.8%, respectively. We believe ATR’s strategy leads to a unique offering in the sector, as the managers aim to mitigate the more excessive risk factors in the region while still focussing on high-quality companies.
abrdn Asia Focus (LSE:AAS) is another trust with a modest overweight to China, but underweight to India. Managed by a leadership team including veteran investor Hugh Young, they lever the significant analyst resource from the wider abrdn global team to identify under researched opportunities from around the bottom 20% of stocks, by market cap, in each country. The trust can look very different to its small-cap benchmark, with an active share percentage typically in the high 90s. The overweight to China has come about recently. The managers had been sceptical due to the level of government intervention and were underweight as recently as 2022. However, they found a number of new ideas during the market weakness later that year, which led to three new positions. As such, the managers more than doubled their allocation to the country since the beginning of 2022, to leave them more than 4% overweight, at the time of writing. The Indian underweight has come as a result of high valuations. The country is still the largest absolute country weight, but as valuations rose, the managers decided to take some profit and rotate this into better value opportunities, including China. This disciplined approach has helped deliver consistent outperformance of the trust’s benchmark over the past five years.
The next frontier
While the headlines surrounding the region have been dominated by the two economic powerhouses of India and China, they are far from the only stories in the region. More recently, there has been a considerable focus on some of the smaller emerging markets, in particular Indonesia and Vietnam. These countries have moved into the spotlight due to a combination of improving internal dynamics, as well as being beneficiaries of the trend of firms looking to diversify their supply chains away from China. This diversification aims to capitalise on better wage competitiveness and avoid fears over geopolitical tensions. Both countries offer similar drivers as for India, such as good demographics and reform-focused governments, which has led to a number of investment trusts allocating to the countries.
JPMorgan Asia Growth & Income Ord (LSE:JAGI) is one, with Indonesia a notable overweight. Co-managers Ayaz Ebrahim and Robert Lloyd believe the country has an exciting growth profile, supported by improving government finances and a focus on developing more downstream industries to support their large raw materials sector. The managers have chosen to take their allocation in banks and telecoms companies, as these are some of the best-run companies in the country.
The team at BlackRock Frontiers Ord (LSE:BRFI) are also positive on the country. In particular, they note it is in a position to benefit from continuing to do business with China and the US as the two major powers decouple. Indonesia is a major source of nickel, which is a vital ingredient for modern electric batteries. It has successfully encouraged Chinese investment off the back of this, while also being in negotiations for a trade deal. This would see it able to contribute to the electric vehicle (EV) supply chain, despite the strictures of the Inflation Reduction Act in the US, which seeks to encourage domestic manufacturing.
Vietnam Enterprise Ord (LSE:VEIL) is one of three investment trusts focused purely on the opportunity in Vietnam. Managed by Dien Vu Huu of Dragon Capital, which was the first investment management firm set up in Vietnam, back in 1994, the aim is to capture the best growth opportunities within the country. Dien has a relatively low-turnover approach, with an average holding period of over six years, which allows enough time for the high-quality businesses to fulfil their growth prospects, inspired by the rapid economic development. It has been a difficult year for the market and VEIL in the wake of market adjustments for US interest rate expectations, as well as country-specific issues. However, Dien’s earnings growth forecast for 2024 is over 20%, which would be very supportive for returns, should it prove correct. Despite the recent headwinds, the trust has still delivered attractive returns over five years, returning 33.7% in NAV terms to 27/06/2023 versus the FTSE Vietnam Index, which has fallen 0.34% in the same period.
Conclusion
The two economic powerhouses of Asia, India and China, both offer unique and compelling investment opportunities. India may arguably have the edge over the long term, with its younger, well-educated workforce driving an expanding middle class. However, valuations are arguably pricing this in. Conversely, Chinese equities are discounting a lot, and there are plenty of managers who think this outweighs the higher growth in India.
Beyond this, the wider Asian region continues to offer a number of different opportunities, in the likes of Vietnam and Indonesia. With such a wide range of considerations, we believe the investment trust universe is well-suited to capitalise on this. Not only are there a number of trusts with divergent allocations that can offer investors diversification, but many of these trusts are also trading at wide discounts. Consequently, this could offer investors an attractive entry point to the long-term growth potential of the region.
Kepler Partners is a third-party supplier and not part of interactive investor. Neither Kepler Partners or interactive investor will be responsible for any losses that may be incurred as a result of a trading idea.
These articles are provided for information purposes only. Occasionally, an opinion about whether to buy or sell a specific investment may be provided by third parties. The content is not intended to be a personal recommendation to buy or sell any financial instrument or product, or to adopt any investment strategy as it is not provided based on an assessment of your investing knowledge and experience, your financial situation or your investment objectives. The value of your investments, and the income derived from them, may go down as well as up. You may not get back all the money that you invest. The investments referred to in this article may not be suitable for all investors, and if in doubt, an investor should seek advice from a qualified investment adviser.
Full performance can be found on the company or index summary page on the interactive investor website. Simply click on the company's or index name highlighted in the article.
Important Information
Kepler Partners is not authorised to make recommendations to Retail Clients. This report is based on factual information only, and is solely for information purposes only and any views contained in it must not be construed as investment or tax advice or a recommendation to buy, sell or take any action in relation to any investment.
This report has been issued by Kepler Partners LLP solely for information purposes only and the views contained in it must not be construed as investment or tax advice or a recommendation to buy, sell or take any action in relation to any investment. If you are unclear about any of the information on this website or its suitability for you, please contact your financial or tax adviser, or an independent financial or tax adviser before making any investment or financial decisions.
The information provided on this website is not intended for distribution to, or use by, any person or entity in any jurisdiction or country where such distribution or use would be contrary to law or regulation or which would subject Kepler Partners LLP to any registration requirement within such jurisdiction or country. Persons who access this information are required to inform themselves and to comply with any such restrictions. In particular, this website is exclusively for non-US Persons. The information in this website is not for distribution to and does not constitute an offer to sell or the solicitation of any offer to buy any securities in the United States of America to or for the benefit of US Persons.
This is a marketing document, should be considered non-independent research and is subject to the rules in COBS 12.3 relating to such research. It has not been prepared in accordance with legal requirements designed to promote the independence of investment research.
No representation or warranty, express or implied, is given by any person as to the accuracy or completeness of the information and no responsibility or liability is accepted for the accuracy or sufficiency of any of the information, for any errors, omissions or misstatements, negligent or otherwise. Any views and opinions, whilst given in good faith, are subject to change without notice.
This is not an official confirmation of terms and is not to be taken as advice to take any action in relation to any investment mentioned herein. Any prices or quotations contained herein are indicative only.
Kepler Partners LLP (including its partners, employees and representatives) or a connected person may have positions in or options on the securities detailed in this report, and may buy, sell or offer to purchase or sell such securities from time to time, but will at all times be subject to restrictions imposed by the firm's internal rules. A copy of the firm's conflict of interest policy is available on request.
Past performance is not necessarily a guide to the future. The value of investments can fall as well as rise and you may get back less than you invested when you decide to sell your investments. It is strongly recommended that Independent financial advice should be taken before entering into any financial transaction.
PLEASE SEE ALSO OUR TERMS AND CONDITIONS
Kepler Partners LLP is a limited liability partnership registered in England and Wales at 9/10 Savile Row, London W1S 3PF with registered number OC334771.
Kepler Partners LLP is authorised and regulated by the Financial Conduct Authority.