Time to switch from US mega-cap stocks to small-caps?
Investment trust experts examine arguments in favour of a longer-term shift in the prevailing wind.
15th May 2020 16:40
This content is provided by Kepler Trust Intelligence, an investment trust focused website for private and professional investors. Kepler Trust Intelligence is a third-party supplier and not part of interactive investor. It is provided for information only and does not constitute a personal recommendation.
Material produced by Kepler Trust Intelligence should be considered a marketing communication, and is not independent research.
While global giants such as Amazon still hold the weather gauge, we examine the long-term prospects for a shift in the prevailing wind.

Sea change
Callum Stokeld, investment trust research analyst at Kepler Trust Intelligence.
The Covid-19 related shutdown has seen the largest US companies extend their share price performance leadership even further, and they are generally assumed to be the winners from any changes to the economy.
In part, this outperformance reflects increased certainty that these companies are the beneficiaries from a change in working practices and structural shifts in the economy, but this outperformance has been a longer-running trend.
Investors with US equity exposure might be tempted to tilt in favour of strategies exposed to this trend, but tactical and strategic investment considerations are not necessarily always aligned.
Tactics vs strategy
Like everyone, there are areas I know of, but know nearly nothing about. For example: human genome sequencing, Exeter, K-Pop and healthy living.
On some of these things my ignorance is essentially total; on others, I assume I could vaguely outline a rough picture of the mechanics.
Falling into the latter category is the manufacturing of frozen chips. I can tell you almost nothing about this topic with confidence, but I would hazard a guess that this is an industrial process that I could reasonably sketch out a rough framework which ultimately would not be totally inaccurate.
Perhaps this is not the most complicated industry, with the most demanding intellectual property barriers to entry? Yet Lamb Weston, the largest frozen chip manufacturer in the world, operates and is valued as if it is that. Trading on an EV/EBITDA multiple of c. 13x, the market values the company as if it were a leading tech company or had incredibly strong brand value.
Personally speaking, I have no particular loyalty to any brand of frozen chips; nor, I imagine, do the various restaurants and supermarkets that make up Lamb Weston’s core customer base (75% in the former case). Nor are frozen chips particularly a growth industry.
Perhaps the market has just mispriced this stock? This seems eminently feasible, especially with the current volatility, except that valuation of this stock consistently stays close to that of the tech majors.
Furthermore this factor would not explain gross operating margins of c. 18% – this should not be a high margin business, surely? Given the low intangible barriers to entry, why would someone with knowledge of the industry – and a few good contacts – not disrupt this company?
And so we come to the point: since the adoption of the Bork doctrine in approaches to anti-trust jurisprudence, US industry has become more consolidated, and companies can sustainably operate with higher margins and less investment.
Each industry is not necessarily dominated by megalithic conglomerates, as Lamb Weston shows. It could be a reasonably small business which just happens to be a giant in its field. Warren Buffett, amongst others, has made a career out of targeting local monopolies with low competition.
Across the US market the Q ratio (the market value of a company divided by the replacement cost of its assets) has consistently remained above 1.
This should not, in a capitalist society, occur for any length of time; it implies it is cheaper to start a new company from scratch than buy it in the market, which should lead to new entrants taking advantage of this, and the Q ratio falling.
What also seems inconsistent, in our view, with a capitalist society is the would-be permanent outperformance of larger companies over smaller companies; smaller companies, after all, have greater potential for exponential growth. If a company with $10 million of sales grows this figure 100x, they will have $1 billion of sales.
If a firm achieves $514 billion of sales (as Walmart did in 2018) then growing sales by 100x will result in it having $51 trillion of sales, which would have represented c. 58% of global GDP in 2018 (i.e. it is impossible).
So, over the long-term, smaller companies 1) ought to outperform, and 2) ought to trade on higher valuations to reflect this potential outperformance.
The first pattern has been starkly absent in recent years, with the large-cap S&P 500 outperforming the small-cap Russell 2000 index consistently over the last ten years; in total, the S&P 500 outperformed by c. 92% to the end of April 2020.
Now the second pattern has reversed too, with US small and mid-caps trading at a valuation discount to their large-cap peers; this would seemingly imply the market expects superior growth from large-caps.
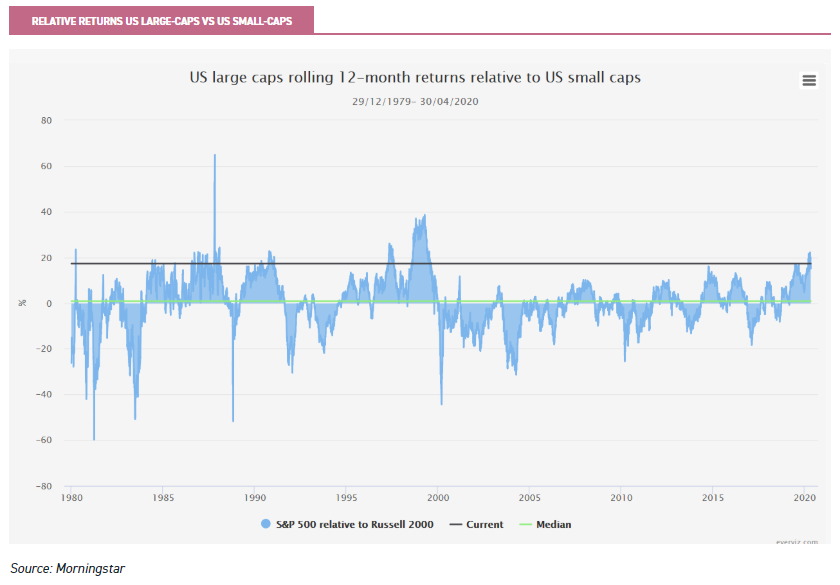
Source: Morningstar
This large-cap leadership has, in fact, been even more acute than the above analysis would suggest, with significant performance leadership from the largest companies such as Microsoft (NASDAQ:MSFT), Amazon (NASDAQ:AMZN), Apple (NASDAQ:AAPL), Alphabet (NASDAQ:GOOGL) and Facebook (NASDAQ:FB). Many of these names are further perceived as being the ultimate beneficiaries from the COVID-19 related shutdown; but does their performance leadership have further to run?
You do not have to hold US equities: doing nothing is always an option. However, IF you allocate systematically to the US – and/or believe that the US market rebound has legs to run and that you wish to hold US stocks – should you therefore trust to the traditional assumptions that small-caps represent higher beta, that higher beta will outperform in a rising market, and that we should reasonably expect to see some mean reversion in the above chart?
I think at this point we need to separate out strategic and tactical positioning and considerations.
Tactical
If we are to buy US stocks (or stocks in general), what are the factors we need to consider going forward at this time and in the near future? We are referring to large-cap indices here, but the primary consideration should be given to in fact the very largest companies, and those stocks perceived to have the greatest operational momentum; presently the two are more or less the same, with Big Tech having provided significant outperformance.
Liquidity and flows: if people are re-entering the market, where will these flows go? Where will existing, regular pension contributions go? A majority may go to passives, judging by recent trends. This favours large-cap on balance; whilst all-cap solutions are popular, S&P 500 trackers are amongst the most popular investment vehicles in the US as measured by inflows (Source: Morningstar).
Accordingly, large-caps receive relative benefits, especially in liquidity driven rallies (given their superior liquidity profile, they are more readily accessible for hot money flows).
We believe you should expect momentum strategies to further bid up existing winners – and that trends will run farther and reverse sharper than they used to.
The true macroeconomic effects of COVID have probably not yet been felt. When credit card debts go unpaid, certainly big credit card companies and banks will be vulnerable.
But if the ability of consumers to consume sees a squeeze, large-caps can more effectively push pricing pressure down their supply chains – for now. The support packages offered by the US federal government have already been oversubscribed; and anecdotal evidence suggests that larger companies (with more lucrative banking relationships) have benefitted disproportionately.
Furthermore, the decision of the Fed to verbally step into the high yield bond market has effectively allowed companies to again access financial markets for debt financing.
With the Fed likely (if they eventually participate) to buy passively, again we see potentially disproportionate refinancing benefits to large issuers whose bonds offer sufficient liquidity for the Fed to purchase meaningfully via a passive vehicle. On balance, all of this evidence again favours large-caps.
M&A activity: certain cash-rich companies have the ability to buy up assets and further consolidate in their sectors at lower prices right now.
Certain small-caps that become targets may benefit, but larger companies could ultimately gain even greater pricing power. In a time of severe economic stress, our opinion is that anti-trust considerations will probably be quietly ignored, especially in an election year characterised by a desire on the part of incumbent politicians to create a feelgood environment.
The negative impact for consumers and workers will have delayed impact, so politically can be ignored.
USD liquidity globally seems to have remained tight. This situation is why the Fed stepped into global FX markets by opening up and expanding swap lines with other central banks (swap lines allow foreign central banks the capacity to deliver USD funding to institutions within their jurisdiction).
These pressures have abated somewhat, but a global structural dependence on dollar liquidity remains. If we see this trend return, a dash for dollar assets could again benefit the most liquid (i.e. biggest) stocks on a relative basis as global investors reach for any dollar-denominated asset available.
We would not regard this as likely to be a good environment for risk assets or stock markets in general, but it would probably see large-cap growth stocks extend their leadership.
It is equally plausible that a desperate desire to raise any dollar assets possible may mean the most liquid stocks underperform, as they represent more readily available capital.
On balance, my opinion is slightly more in favour of large-cap stocks being relatively bid in such an environment.
US bond markets: recessions are disinflationary as output falls, unemployment rises and consumer spending falls. Combined with supportive monetary policy, inflationary pressures are unlikely to materialise in the bond market just yet.
Algorithmic trading programmes are likely to continue to favour high-duration (positive sensitivity to lower interest rates), high-growth and large-cap stocks in such an environment.
These tactical considerations seem ostensibly to be favouring large-caps, particularly those (such as the FAAMG stocks) which have demonstrated recent leadership.
Large-cap and tech-heavy strategies are likely to benefit on a relative basis, particularly with geared exposure, if this rally proves durable.
For investors looking to continue to weigh tactically in favour of such companies, trusts such as JPMorgan American (LSE:JAM) continue to offer exposure to leading areas. JAM currently has c.19.3% invested in Microsoft, Amazon, Alphabet and Apple, but will also have further exposure on a look-through basis via its holding in Berkshire Hathaway (NYSE:BRK.B).
With 8% gearing, reasonably high weightings to the leading mega-caps and very low costs (an OCF of c. 0.33%), we think JAM is well-positioned to potentially benefit if current market trends continue. It currently trades on a discount of c. 4.5%.
Specialist trusts such as Polar Capital Technology (LSE:PCT) and Allianz Technology Trust (LSE:ATT) have similarly sizeable weightings to the (currently) leading US large-caps, even within an ostensibly global and multi-cap mandate.
PCT at present has over 70% of its portfolio in US companies, and this is likely to continue given the US’ leadership in the tech sector.
ATT tends to have a higher weighting to mid-caps than PCT, but still has over 50% of exposure to mega and large-cap stocks, with Amazon and Microsoft currently the two biggest positions.
Perhaps reflective of the general market preference for the tech giants at this time, PCT (with its generally greater tilt towards large-caps, currently trades on a small premium, whilst the more mid-cap associated ATT trades on a slight discount.
Strategic
The longer-term strategic picture, however, is somewhat different in my view. As noted above, it does not seem suggestive of a healthy capitalist economy for large-caps to durably outperform small-caps (particularly in a rising market environment).
But shifts in investment patterns do not occur just because they should. What might drive a structural reconsideration?
Politics: there appear to be signs that the sands are shifting in both the Republican and Democratic parties at the grassroots level.
We may be moving towards the end of an epoch where both parties operated essentially the same economic policy, and allowed a trend of corporate consolidation to occur.
The current era perhaps has echoes of the late 1890s in the dynamics, where gradual changes at the grassroots level of both parties ultimately shifted from regulatory policies promoting consolidation and economic scale, to policies favouring diversity of consumer choice.
Anti-trust interpretations could shift. How long before it becomes politically attractive to forcibly spin-out Amazon Web Services (and just how severely does this loss of free cash flow impact the rest of the Amazon business model), or to forcibly separate Instagram from Facebook?
As these companies become more monolithic in the US corporate sector, this political calculus could well shift against them.
We are not there yet in our view, nor will we be in the coming election. But looking several years out, I would anticipate a cultural shift in US politics; watch for the next mid-term elections to potentially herald the shift is underway, and the possibility that at least one of the parties to choose a surprise outsider as its presidential candidate in 2024 (or, failing this, a very strong third party candidate showing).
Geopolitics, on the other hand, perhaps mitigates against this scenario. The desire to run national champions will likely remain strong, particularly assuming geopolitical tensions with China continue to ratchet higher.
If these mega-caps become perceived as harmful to the national interest, however, this factor could swing rapidly in the other direction. Chinese mega-caps are also probably more vulnerable to internal domestic politics than they appear to be.
The Chinese system is intensely political, predicated on the Stalinist doctrine of continuing revolution and identifying and fighting ‘counter-revolutionary’ forces.
When convenient, public companies will be subordinated or subject to this ‘fight’.
At some stage, the biggest companies will go ex-growth. ‘Valuing’ Amazon has long been a fool’s game, with an annualised sales growth rate of c. 28% since 2006 rendering any optical expensiveness illusory.
However, let us hypothesise and make some assumptions:
- Amazon continues to grow sales at this rate; and
- Both US and global GDP grow at c. 3% of US GDP.
By 2022 Amazon sales will be c. 0.6% of global GDP and c. 2.6% of US GDP, greater than any company currently enjoys.
By 2025 Amazon sales will be c. 1.1% of global GDP and c. 5% of US GDP.
Will governments tolerate a company enjoying this degree of influence? It would seem highly unlikely.
2022 remains some way off, and this is merely illustrative – the above figures are almost certainly wrong. But the current disparity in relative growth rates between the FAAMG stocks and the rest of the market cannot be sustained. All face their issues.
In a similar vein, the continued outperformance of large-cap stocks, and in particular the FAAMG stocks, has already seen them account for an increasing proportion of the US market, and this now stands at historically high levels.
In 2010 Amazon, Google/Alphabet, Microsoft and Apple (AAMA) had a combined market cap of c. $913bn: this was c.6% of total US stock market capitalisation.
By the beginning of 2020, these companies had generated a weighted increase in market cap of c.17% p.a., far outstripping the total stock market. They now account for c.11.6% of the total market, likely higher as these figures do not account for recent outperformance in Q1 2020.
How would they look, going forward, if this level of returns was maintained on an absolute and relative basis?
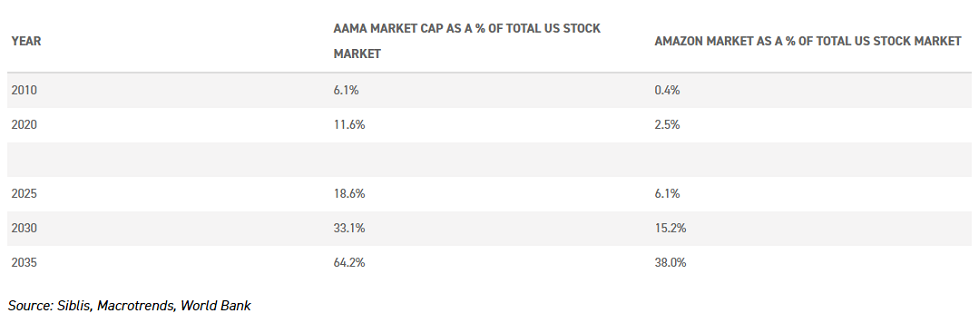
Source: Siblis, Macrotrends, World Bank
The further we run this data out, the less likely it seemingly becomes. As Amazon is the standout performer – even amongst these exalted stocks – the above table also shows what happens if you further separate out its market share trajectory on the same basis.
Bear in mind these figures will understate the dominance of these AAMA and Amazon holdings as proportional weightings, as they are measured against total market capitalisation, including what are essentially uninvestable assets. By comparison, the stocks in question currently occupy even greater weightings in the Vanguard Total Stock market ETF.
If this situation is not to transpire, these stocks will have to underperform or else be split into separate companies. It should be noted that the proportion of the stock market the leading companies currently represent is elevated but not particularly anomalous relative to history.
However, the prospective future weightings above would be essentially unprecedented. This does not necessitate mean reversion from existing underperformers in the market, but could also involve displacement by new entrants.
Re-shoring is likely, in our view, to prove a durable trend. The fragility of global supply chains has been exposed by the COVID situation, and seems likely to catalyse existing political pressures.
This trend may not just be a case of bringing manufacturing home – indeed, manufacturing tends to have benefits to scale. But supply chains may become more domestic and probably more diverse; why, as a business, would you take the operational cost of using one supplier of components from a single location when you can reduce your business risk?
This pattern is also likely to increasingly affect the ability of the largest companies to pass on pricing pressures. If they cannot simply relocate supply chains to more favourable wage jurisdictions, they may simply have to accept an incursion to their own profit margin or invest in productivity boosting equipment.
Apple looks particularly vulnerable to supply chain disruption, with a significant proportion of its component manufacturing and assembly based in China.
Valuations seemingly account for none of these issues – small-caps trade at a discount to large-caps based on historic ten year earnings. Small-caps tend to have inherently greater growth run-rates, and for this reason have generally traded on a valuation premium.
This is no longer the case, and suggests the market believes it is the largest companies that have greater growth potential.
Furthermore, research from OSAM suggests that the earnings yield spread between the cheapest small-cap decile and the most expensive large-cap decile is now over 21%. Such disparities are very rare occurrences and have – on average – been followed by annualised outperformance of small-cap value over large-cap growth of c. 16.8% p.a. over the subsequent ten years.
Although past data offers us a limited amount of insight into the future, we can see that such an extensive degree of large-cap outperformance has tended to see small-caps subsequently outperform.
On the 738 historic dates where the rolling 12 month relative performance of large-caps has been greater than it was at the end of April 2020, small-caps outperformed in 54% of the subsequent 12 month periods by a median of c.1.7%; and outperformed in 62% of subsequent 36 month periods, by a median of c.18.7%.
Over the subsequent 60 months small-caps have outperformed on c. 79% of occasions, by a median of c. 43.5%.
So the possibility of a strategic shift towards small-caps seems, on balance, attractive. Strategies such as Gabelli Value Plus+ Trust (LSE:GVP), JPMorgan US Smaller Companies (LSE:JUSC) and Jupiter US Smaller Companies (LSE:JUS) have faced market-level headwinds in recent years, from their systematic and structural positioning in small-caps.
Trading on discounts of c. 15.8% (GVP+), 7.5% (JUS), and 11.9% (JUSC), investors certainly seem not to have positioned for a rebound in small-caps. By comparison, the widest discount for any US-focussed all-cap strategy is currently c. 4.3% (JAM).
The headwinds these trusts have faced will likely ultimately reverse, but the time frame for ‘ultimately’ is far from definite. Watch for signs of durable shifts in momentum, and for qualitative evidence in line with the above for potential catalysts emerging.
Conclusion
We all know it is a fool’s errand to try and precisely time the market. But such are the dislocations in performance and valuations at this time, we need to weigh the factors which drive short-term pricing movements, and those which drive long-term share price returns.
A regime shift in US equities over the coming years seems likely, in our view, but making the switch wholly to position for this does not seem quite appropriate yet.
There are incipient signs of some of the above strategic considerations, but the true catalyst which will drive intra-market rotation remains both unknown and likely unknowable – if it was visible and obvious, repricing of the outlook would likely already be occurring in line with probability.
We would not try to predict, but perhaps it is time to start planning a migration – and ensuring portfolios are ready to respond – when the signal becomes clearer. Multi-year strategic shifts will not, by definition, be suddenly wholly priced in, but understanding the balance of tactical and strategic considerations will help us understand fund manager relative performance and portfolio risks/opportunities.
Kepler Partners is a third-party supplier and not part of interactive investor. Neither Kepler Partners or interactive investor will be responsible for any losses that may be incurred as a result of a trading idea.
Full performance can be found on the company or index summary page on the interactive investor website. Simply click on the company's or index name highlighted in the article.
Important Information
Kepler Partners is not authorised to make recommendations to Retail Clients. This report is based on factual information only, and is solely for information purposes only and any views contained in it must not be construed as investment or tax advice or a recommendation to buy, sell or take any action in relation to any investment.
This report has been issued by Kepler Partners LLP solely for information purposes only and the views contained in it must not be construed as investment or tax advice or a recommendation to buy, sell or take any action in relation to any investment. If you are unclear about any of the information on this website or its suitability for you, please contact your financial or tax adviser, or an independent financial or tax adviser before making any investment or financial decisions.
The information provided on this website is not intended for distribution to, or use by, any person or entity in any jurisdiction or country where such distribution or use would be contrary to law or regulation or which would subject Kepler Partners LLP to any registration requirement within such jurisdiction or country. Persons who access this information are required to inform themselves and to comply with any such restrictions. In particular, this website is exclusively for non-US Persons. The information in this website is not for distribution to and does not constitute an offer to sell or the solicitation of any offer to buy any securities in the United States of America to or for the benefit of US Persons.
This is a marketing document, should be considered non-independent research and is subject to the rules in COBS 12.3 relating to such research. It has not been prepared in accordance with legal requirements designed to promote the independence of investment research.
No representation or warranty, express or implied, is given by any person as to the accuracy or completeness of the information and no responsibility or liability is accepted for the accuracy or sufficiency of any of the information, for any errors, omissions or misstatements, negligent or otherwise. Any views and opinions, whilst given in good faith, are subject to change without notice.
This is not an official confirmation of terms and is not to be taken as advice to take any action in relation to any investment mentioned herein. Any prices or quotations contained herein are indicative only.
Kepler Partners LLP (including its partners, employees and representatives) or a connected person may have positions in or options on the securities detailed in this report, and may buy, sell or offer to purchase or sell such securities from time to time, but will at all times be subject to restrictions imposed by the firm's internal rules. A copy of the firm's conflict of interest policy is available on request.
Past performance is not necessarily a guide to the future. The value of investments can fall as well as rise and you may get back less than you invested when you decide to sell your investments. It is strongly recommended that Independent financial advice should be taken before entering into any financial transaction.
PLEASE SEE ALSO OUR TERMS AND CONDITIONS
Kepler Partners LLP is a limited liability partnership registered in England and Wales at 9/10 Savile Row, London W1S 3PF with registered number OC334771.
Kepler Partners LLP is authorised and regulated by the Financial Conduct Authority.
Kepler Partners is a third-party supplier and not part of interactive investor. Neither Kepler Partners or interactive investor will be responsible for any losses that may be incurred as a result of a trading idea.
These articles are provided for information purposes only. Occasionally, an opinion about whether to buy or sell a specific investment may be provided by third parties. The content is not intended to be a personal recommendation to buy or sell any financial instrument or product, or to adopt any investment strategy as it is not provided based on an assessment of your investing knowledge and experience, your financial situation or your investment objectives. The value of your investments, and the income derived from them, may go down as well as up. You may not get back all the money that you invest. The investments referred to in this article may not be suitable for all investors, and if in doubt, an investor should seek advice from a qualified investment adviser.
Full performance can be found on the company or index summary page on the interactive investor website. Simply click on the company's or index name highlighted in the article.
Important Information
Kepler Partners is not authorised to make recommendations to Retail Clients. This report is based on factual information only, and is solely for information purposes only and any views contained in it must not be construed as investment or tax advice or a recommendation to buy, sell or take any action in relation to any investment.
This report has been issued by Kepler Partners LLP solely for information purposes only and the views contained in it must not be construed as investment or tax advice or a recommendation to buy, sell or take any action in relation to any investment. If you are unclear about any of the information on this website or its suitability for you, please contact your financial or tax adviser, or an independent financial or tax adviser before making any investment or financial decisions.
The information provided on this website is not intended for distribution to, or use by, any person or entity in any jurisdiction or country where such distribution or use would be contrary to law or regulation or which would subject Kepler Partners LLP to any registration requirement within such jurisdiction or country. Persons who access this information are required to inform themselves and to comply with any such restrictions. In particular, this website is exclusively for non-US Persons. The information in this website is not for distribution to and does not constitute an offer to sell or the solicitation of any offer to buy any securities in the United States of America to or for the benefit of US Persons.
This is a marketing document, should be considered non-independent research and is subject to the rules in COBS 12.3 relating to such research. It has not been prepared in accordance with legal requirements designed to promote the independence of investment research.
No representation or warranty, express or implied, is given by any person as to the accuracy or completeness of the information and no responsibility or liability is accepted for the accuracy or sufficiency of any of the information, for any errors, omissions or misstatements, negligent or otherwise. Any views and opinions, whilst given in good faith, are subject to change without notice.
This is not an official confirmation of terms and is not to be taken as advice to take any action in relation to any investment mentioned herein. Any prices or quotations contained herein are indicative only.
Kepler Partners LLP (including its partners, employees and representatives) or a connected person may have positions in or options on the securities detailed in this report, and may buy, sell or offer to purchase or sell such securities from time to time, but will at all times be subject to restrictions imposed by the firm's internal rules. A copy of the firm's conflict of interest policy is available on request.
Past performance is not necessarily a guide to the future. The value of investments can fall as well as rise and you may get back less than you invested when you decide to sell your investments. It is strongly recommended that Independent financial advice should be taken before entering into any financial transaction.
PLEASE SEE ALSO OUR TERMS AND CONDITIONS
Kepler Partners LLP is a limited liability partnership registered in England and Wales at 9/10 Savile Row, London W1S 3PF with registered number OC334771.
Kepler Partners LLP is authorised and regulated by the Financial Conduct Authority.
These articles are provided for information purposes only. Occasionally, an opinion about whether to buy or sell a specific investment may be provided by third parties. The content is not intended to be a personal recommendation to buy or sell any financial instrument or product, or to adopt any investment strategy as it is not provided based on an assessment of your investing knowledge and experience, your financial situation or your investment objectives. The value of your investments, and the income derived from them, may go down as well as up. You may not get back all the money that you invest. The investments referred to in this article may not be suitable for all investors, and if in doubt, an investor should seek advice from a qualified investment adviser.
Full performance can be found on the company or index summary page on the interactive investor website. Simply click on the company's or index name highlighted in the article.