The UK stock market: what investors need to know before investing
Tom Bailey explains what investors need to know about the FTSE and other indices tracking the UK market.
25th August 2020 09:00
by Tom Bailey from interactive investor
Tom Bailey explains everything investors need to know about the FTSE and other indices tracking the UK market.
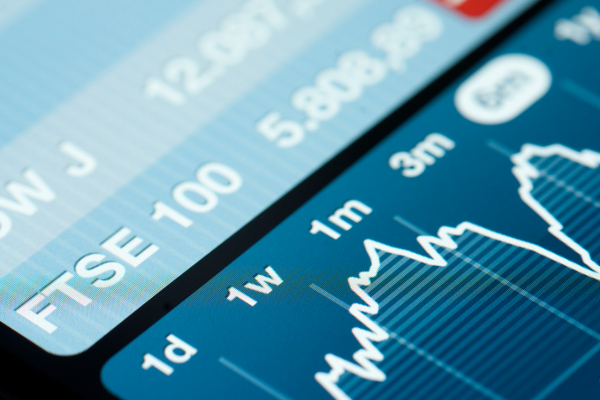
The most popular index in the UK is the FTSE 100. This index tracks the largest 100 companies listed on the London Stock Exchange (LSE) by market capitalisation weighting. This index is maintained by the company FTSE Russell and is updated every quarter.
Another index for UK equities is the FTSE 250. It is not the FTSE 100, plus an extra 150 companies. Instead, the index is the next largest 250 companies on the LSE after those in the FTSE 100.
The FTSE 350 is another popular index. It includes both the FTSE 100 and FTSE 250 (hence, having a total of 350 stocks). This index, however, has fallen out of fashion somewhat.
Also popular is the FTSE All-Share index. It is meant to include all eligible companies on the LSE, so the index contains 641 stocks. Combined, these stocks represent about 98% of all listed companies in the UK.
As you would expect, this means that it includes the same stocks that are included in both the FTSE 100 and the FTSE 250. However, owing to the sheer size of the top 100 companies, the index often resembles and behaves like the FTSE 100. It is not uncommon for people to refer to the two almost interchangeably, although there are some small differences in company and sector weightings.
In general, most investors in the UK prefer to use the FTSE Russell indices and most ETF providers offer UK investors the ability to track these major FTSE indices for very low fees. For example, the Vanguard FTSE 100 UCITS ETF (LSE:VUKE), charges just 0.09%, which works out at £9 if £10,000 was invested.
However, there are other UK equity tracking indices aside from those under the FTSE moniker. For example, there is the MSCI United Kingdom Index, which aims to track both the large- and mid-cap segments of the UK market. Curiously, it does this with just 87 constituents. The index covers approximately 85% of the free float-adjusted market capitalisation in the UK. This index is more likely to be used by oversees investors looking for UK exposure, although BlackRock does offer an ETF tracking this index: iShares MSCI UK Equity ETF (LSE:CSUK).
MSCI also provides a small-cap index. This can be easily tracked using the iShares MSCI UK Small Cap ETF. The index has 245 constituents and is supposed to capture 14% of the free float-adjusted market capitalisation in the UK.
There are several other small-cap indices, but these are rarely available to track via an ETF or index fund. For example, there is the FTSE Small Cap Index, which is made up of companies consisting of the 351st to the 619th largest companies listed on the LSE. Even smaller is the FTSE Fledgling Index, which is made up of the companies listed on the LSE that are too small to be included in the FTSE All-Share Index.
There is also the Alternative Investment Market (AIM). As a whole, the AIM includes more than 1,000 companies and has less stringent rules for listing than the main LSE. It usually attracts very small companies and investors cannot track this via an ETF or index fund.
International revenue
When it comes to UK shares, one of the key points to remember is that a lot of companies that list in the UK have little actual business on the ground in the UK. Owing to the UK’s historic and current status as a global financial capital, companies around the world choose to list in the UK. The reasoning is that the UK has a good, extensive and trustworthy regulatory regime, as well as a large liquid market.
So, for example, the FTSE 100 includes companies such as Royal Dutch Shell (LSE:RDSB), AstraZeneca (LSE:AZN), Diageo (LSE:DGE), Rio Tinto (LSE:RIO), and Unilever (LSE:ULVR). These companies are all big international companies that sell their products and services globally, not just to UK customers. In total, around 70% of the collective earnings of all FTSE 100 listed companies come from abroad.
This means that the fortunes of the FTSE 100 are not particularly tied to the overall health of the UK economy. If the companies in the index are selling globally, the propensity for UK consumers to buy their products does not matter so much. If, in theory, there was a recession in the UK but not in the rest of the world, the FTSE 100, in theory, would not experience a large decline in prices, being reliant on global demand. As a result, the index is often seen as more of a bellwether for the health of the global economy than of the UK economy.
- How to invest during a recession: top tips and tactics
- What could Tesla’s inclusion in two US indices teach ETF investors?
- What is behind the supposed death of value investing?
Counter-intuitively, it is sometimes the case that the relative poor performance of the UK economy (or expectation of such a thing) can be good for the FTSE 100. This is because when things look bad for an economy, the currency usually depreciates against other currencies. If sterling has depreciated, it means that when FTSE 100 companies convert their overseas earnings back into sterling, their profits end up looking larger in sterling terms. Higher earnings, of course, mean higher share prices and possible dividend distributions.
However, there are sometimes countervailing forces. International investors may still decline to buy FTSE 100 shares if the UK economy looks to be in bad shape, as they may fear further sterling depreciation. If a fund manager in the US buys sterling-denominated shares, a decline in the value of sterling decreases how much they are worth in dollar terms. This has, in part, been why, despite the benefit a weak pound brings to the FTSE 100, fund managers around the world have been underweight UK equities since the Brexit vote in 2016.
This whole dynamic is not massively different for the FTSE All-Share, which, as mentioned, is not hugely disparate to the FTSE 100. Thus the FTSE 250 is often touted as a better barometer of the UK domestic economy. Anyone wanting exposure to the UK economy should buy an ETF tracking the FTSE 250, it is often argued. Likewise, some UK domestic-focused fund managers use the FTSE 250 to benchmark their performance.
However, while the FTSE 250 does correlate better with the overall health of the UK economy than the FTSE 100, it is still fairly international; as of 2018 the index still had roughly half its earnings coming from abroad.
Sectors in UK indices
As mentioned, the FTSE 100 and FTSE All-Share usually resemble each other quite closely. As a result, the sector weightings are usually within a few percentage points of each other. With that in mind, I will refer primarily to the sector weightings of the FTSE 100.
One of the most important points to remember about the FTSE 100 index is that it is heavily weighted towards financials and energy. As at June 2020, financials made up 17.7% and energy around 10%.
Before the Covid-19 pandemic, the weighting towards these sectors had been even greater. At the end of 2019, these two sectors were the two largest in the index, with financials accounting for just over 20% and energy 14%.
Another characteristic of the index is its relatively smaller exposure towards technology companies. As of June, technology composed 1.2% of the index. At the end of 2019, it was just 0.92%.
The MSCI UK Equity index is only slightly different. At present, its biggest weighting is towards consumer staples with just under 20%. However, its second-largest exposure is still financials at 17.3%, while energy accounts for just under 10%. Technology also has a low exposure, at about 1.3%.
What this means is that the UK’s main indices have a particular bias towards both cyclical and value stocks.
Cyclical stocks are those tightly aligned with that of the wider economy. Banks and energy companies are prime examples of cyclical stocks. Banks face trouble in recessions due to loan defaults, while energy companies suffer from the inevitable lack of demand when economic output is lower.
Value stocks are those that trade on lower multiples to some other metric, usually either their book value or earnings.
This all matters, as any investor opting for FTSE 100, FTSE All-Share or MSCI UK Equity exposure should be aware of the exact sort of exposure they are getting. As I recently noted, the sector composition of the FTSE 100 and FTSE All-Share currently goes a long way in explaining why those two indices are underperforming those of most other developed economies.
For the FTSE 250, the sector composition is different, but somewhat similar. The biggest similarity is the bias towards financials, which account for around 30% of the index. However, the differences include a larger exposure to industrials, a higher weighting to technology (albeit only around 4%), and practically no energy exposure.
Expect income, not growth
Another core feature of the UK’s main indices is that they are full of big, established and mature companies. As a result, many of these companies do not have much growth ahead of them. They may be able to grow their future revenues somewhat, but don’t expect the rapid growth experienced by US or emerging-market companies.
As a result, the FTSE 100 has scarcely grown in recent decades and has generally swung between 4,000 and 7,000 or so points for much of the past 20 years. As of August 2020, the FTSE 100 was below the level it was in 1999.
- GRANOLAS: the new acronym for Europe’s superstar stocks
- Diversifying your portfolio is easy with these ii Super 60 recommended funds
- Take control of your retirement planning with our award-winning, low-cost Self-Invested Personal Pension (SIPP)
This may make the FTSE 100 sound like an awful investment: what’s the point in investing in an index of companies that barely grows over 20 years? The answer is dividends.
The FTSE 100, being full of mature companies, is also full of companies that produce a lot of revenues that they decide to return to shareholders. Younger companies will retain their earnings to invest in the business. For mature companies, there is often not much more to invest in, so they end up returning earnings to their owners (the shareholders) in the form of dividends. As a result, the FTSE 100 index is known as one of the best indices for investors seeking income. In recent years, its yield has been above 4%, more than twice that of the S&P 500.
The importance of dividends for returns can be seen in the chart below (using data from FE Analytics). On a price basis (that is just looking at how much share prices have gone up or down), the index has provided a negative return of around 6% over the past 20 years. However, in total return terms, in which dividends are factored in, that changes dramatically with returns standing at 92%.
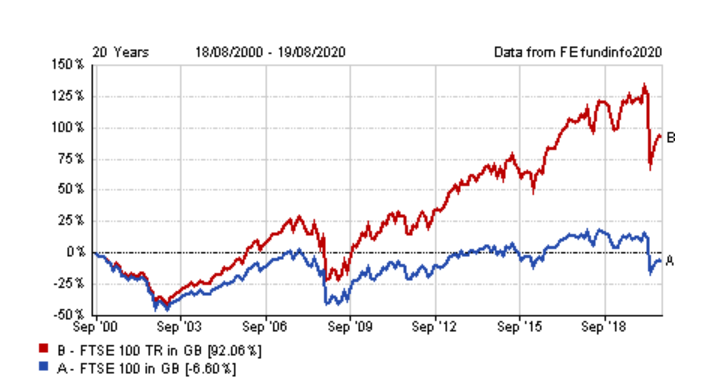
Source: FE Analytics
Full performance can be found on the company or index summary page on the interactive investor website. Simply click on the company's or index name highlighted in the article.
These articles are provided for information purposes only. Occasionally, an opinion about whether to buy or sell a specific investment may be provided by third parties. The content is not intended to be a personal recommendation to buy or sell any financial instrument or product, or to adopt any investment strategy as it is not provided based on an assessment of your investing knowledge and experience, your financial situation or your investment objectives. The value of your investments, and the income derived from them, may go down as well as up. You may not get back all the money that you invest. The investments referred to in this article may not be suitable for all investors, and if in doubt, an investor should seek advice from a qualified investment adviser.
Full performance can be found on the company or index summary page on the interactive investor website. Simply click on the company's or index name highlighted in the article.