Where’s the smart money going next?
Investment trust flow data suggests a shift in behaviour, with buyers looking beyond America. A Kepler analyst reveals the trusts in investors’ sights.
21st November 2025 14:10

This content is provided by Kepler Trust Intelligence, an investment trust focused website for private and professional investors. Kepler Trust Intelligence is a third-party supplier and not part of interactive investor. It is provided for information only and does not constitute a personal recommendation.
Material produced by Kepler Trust Intelligence should be considered a marketing communication, and is not independent research.
When the Roman Empire reached its zenith, wealth and influence radiated from every corner of its dominion. Gold from Spain, grain from Egypt, silk and spices from the East, all flowed to Rome, the beating heart of a global system built on trade, innovation and trust. Over time, however, Rome’s dominance faded, not through sudden collapse, but gradual shifts in trade routes and influence as power and prosperity found new centres elsewhere.
We think capital flows in much the same way: they rise and concentrate where opportunity feels strongest, then slowly migrate as new regions emerge. For more than a decade, global investors have channelled their wealth toward the modern empire of growth, the United States. The combination of relentless technological innovation, policy support and the network effects of scale has made US equities the cornerstone of most portfolios. But 2025 has brought signs that this tide, whilst far from crumbling, is beginning to ripple in new directions.
Global equity markets remain influenced by US events, but concentration risk among mega-cap tech firms, elevated valuations and escalating tariff uncertainty raise important questions: has recent turbulence triggered a broader reassessment among investors? Are flows genuinely shifting away from the US, or merely pausing after years of accumulation? And if capital is beginning to move, where is it going, and why?
This article explores these questions, backed by analysing Morningstar asset flows, where we look at flows into worldwide open-ended equity funds across major regions and market capitalisations. The goal is not to call time on US leadership. Its companies continue to drive innovation and growth, plus the country’s size and global reach mean its economy remains pivotal, accounting for nearly a quarter of global GDP and over a third of stock market capitalisation. Instead, what we want to do is examine whether capital may be looking beyond its shores, delving into why it might and drawing on some of the opportunities for selective diversification.
US flows, a shift in momentum?
Global portfolios remain heavily dominated by US equities. As of September 2025, the US alone accounts for nearly $20 trillion in total net assets, in global equity fund holdings, or roughly a quarter, according to Morningstar data, by far the largest pool of capital anywhere in the world.
Understanding how flows evolve there offers useful context for any shift in investor sentiment. Looking at cumulative US equity flows from 2008 to 2024, the pattern is clear: persistent outflows followed the global financial crisis, before steady inflows resumed around 2012 and continued through 2020. The pandemic initially triggered sharp withdrawals, but as digital-first behaviours took hold, high-growth technology companies soared, and inflows surged, through to 2024, supported further by ultra-loose monetary policy, fiscal stimulus and the explosive rise of AI and tech innovations such as ChatGPT.
CUMULATIVE FLOWS
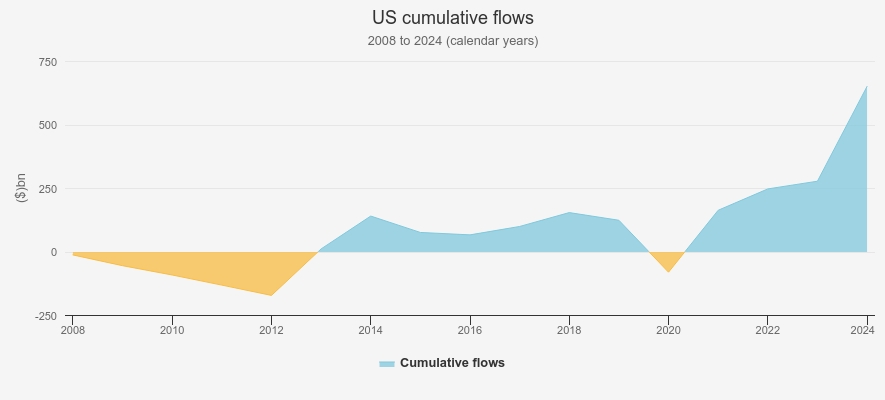
Source: Morningstar
Turning to the past year, monthly cumulative flows reveal a more nuanced picture. In the first quarter of the year, there was a lot of discussion of investors rebalancing away from the US, but the data shows that to the end of April 2025, the US continued to attract strong inflows, despite market underperformance, the emergence of China’s DeepSeek challenging US tech leadership and the Liberation Day sell-off. F
rom late May onwards, however, net outflows began to appear, likely reflecting escalating trade and tariff tensions since, with uncertainty around President Trump’s mercurial approach to tariffs weighing on sentiment. Elevated valuations among the largest US tech names, together with increasingly attractive growth opportunities overseas at lower valuations, may also have played a part.
ONE-YEAR CUMULATIVE FLOWS
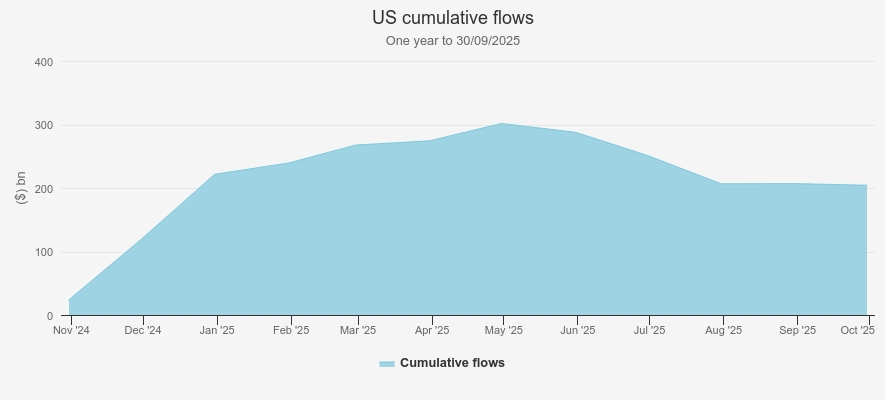
Source: Morningstar
By no means is this a rush for the exits, given how robust flows were at the start of the year, but outflows since May mark the first meaningful moderation since early 2021. Within a $19.7 trillion US asset base, a near-$100 billion swing over a few months is meaningful, and could signal an early change in sentiment.
Moreover, the shift is intriguing given the backdrop. Many major US tech names have rallied since April, yet the S&P 500 has underperformed developed peers, including the UK, Japan, and Europe, as well as broader emerging and frontier markets. Value stocks outside the US have outpaced growth, suggesting leadership may be broadening. The moderation in US inflows hints at capital rotation toward cheaper regions offering a more balanced growth/value mix, a theme explored further in our recent note on the sustained outperformance of global value stocks.
Of course, a few months of data do not define a trend, but there are reasons why this moderation could persist: elevated valuations among major US tech stocks, ongoing uncertainty around tariffs and trade policy, and increasingly compelling growth opportunities elsewhere, at much lower valuations. We also looked at flows into US money market funds, a useful gauge of broader cash movements, and the pattern is clear: steady, consistent outflows over the same period suggest some cash is being redeployed. Whilst there are no sharp spikes to indicate specific triggers, we think this could reflect two dynamics: investors rotating back into US tech earlier in Q1 or shortly after the Liberation Day sell-off, prompted some valuation corrections, and a subsequent move into other regions as global opportunities became more attractive.
Where are flows going?
To mirror the US analysis, we’ve reviewed one-year cumulative monthly flows across key regions to see how investor sentiment has evolved through 2025 and where capital might be heading. The first stop is Global Emerging (GEM) and Frontier Markets, two areas long overlooked but now seeing a sharp turnaround in both flows and relative performance.
In GEMs, the direction of travel has shifted sharply. Persistent outflows continued through the first half of 2025 before bottoming out in June. Since then, flows have surged, marking the first sustained period of net inflows for some time and pushing cumulative flows for the year back into positive territory. The timing is notable: it follows the onset of US outflows in late May, suggesting some rotation of capital into emerging markets. For investors, GEMs now offer more than just diversification; we think they’re increasingly seen as regions capable of delivering comparable growth and innovation at far more attractive valuations. Momentum has been further supported by improving governance, stronger domestic investment and re-ratings across several regions, including emerging Europe. Greece, for example, has been a standout, with the market rising just over 70% year-to-date on the back of resilient consumption, a record fiscal surplus, falling public debt and a turnaround in investment-grade sovereign ratings.
GEM ONE-YEAR CUMULATIVE FLOWS
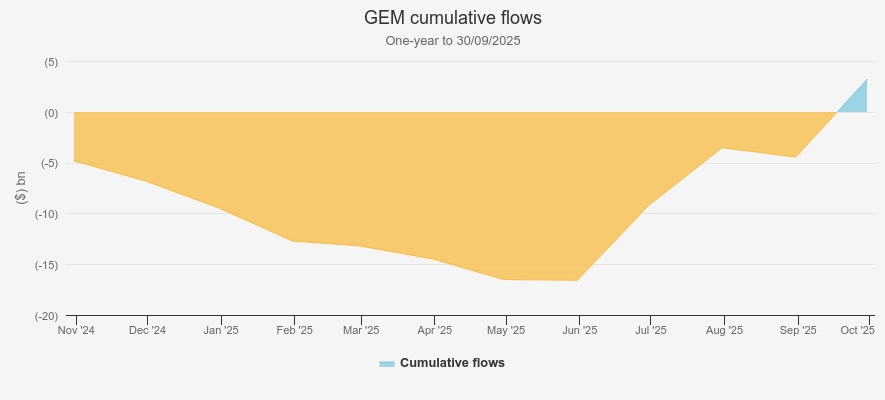
Source: Morningstar
Fidelity Emerging Markets Ord (LSE:FEML) has been a key beneficiary against this backdrop, more than doubling the returns of the MSCI EM Index. Managers Nick Price and Chris Tennant’s active long/short approach allows them to exploit both structural opportunities and balance-sheet risks across regions, from Peruvian and West African gold miners to Taiwanese tech and emerging European financials, including Greece.
Frontier markets, though smaller and less liquid, have traced a similar upward path. Flows climbed steadily through the year, with only brief pauses, and accelerated markedly from May onwards, again aligning with the broader shift out of the US. In these markets, easing rates, reform momentum and improving governance have underpinned strong performance this year, delivered with relatively lower volatility to developed market peers, trends BlackRock Frontiers Ord (LSE:BRFI) has captured well. By deliberately excluding giants like China, India and South Korea, BRFI accesses smaller emerging markets and frontier markets where orthodox policy, growing domestic strength and reform are driving returns, with strong contributions this year from Vietnam, Pakistan and parts of the Middle East.
FRONTIER ONE-YEAR CUMULATIVE FLOWS
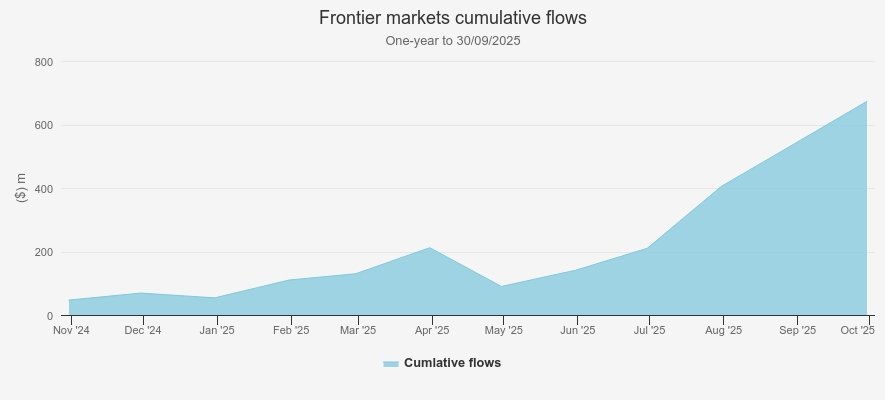
Source: Morningstar.
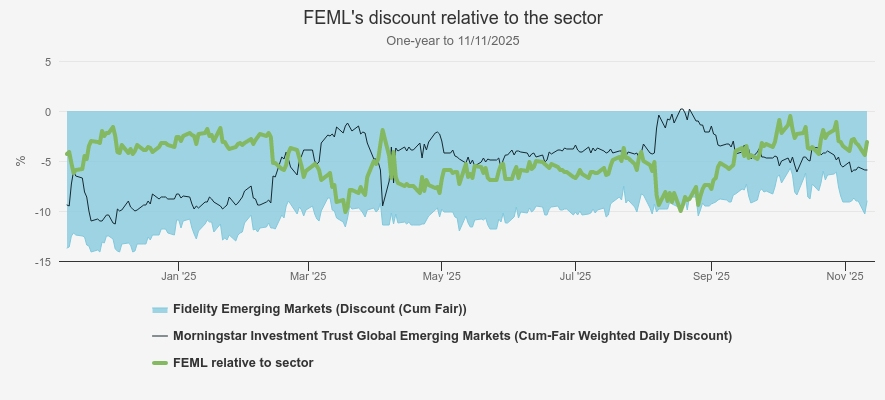
Flows only tell part of the story. Discount movements provide another lens to assess whether sentiment is shifting with the investment trust sector and its UK investor base. Signs of renewed interest are clear: the wider GEM trust universe has seen meaningful discount tightening this year, reflecting both strong performance and growing appeal. FEML stands out here, with its discount narrowing from 14.2% at its widest to 7.0% at the time of writing, and as shown below, FEML’s discount relative to the Morningstar sector has narrowed even more markedly at times. More broadly, GEMs are increasingly emerging as credible alternatives for growth and innovation at attractive valuations, often delivering returns with lower volatility than developed markets. We think the sector-wide discount tightening suggests a reappraisal of risk and opportunity, with investors recognising the combination of performance, stability and the unique potential these markets offer relative to traditional developed market allocations.
GEM SECTOR DISCOUNTS
Source: Morningstar
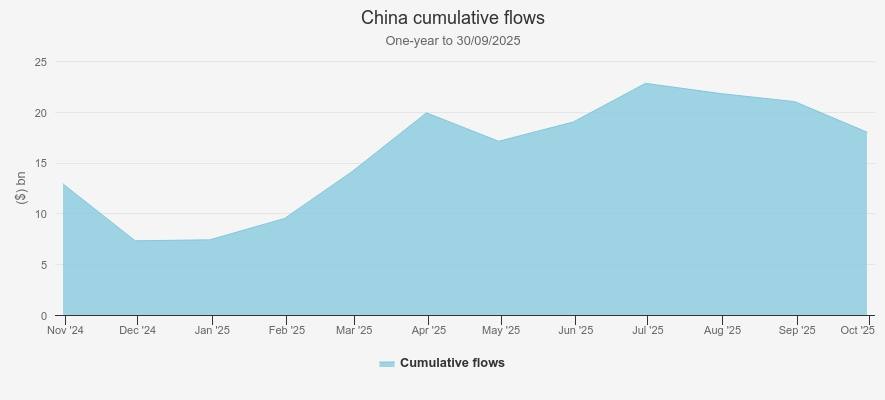
Much of the GEM indices’ success this year has been driven by the recovery in China’s stock market, reflected in strong inflows. From January through April, flows were particularly robust, buoyed by optimism around developments such as DeepSeek, targeted government stimulus, domestic strength, consumption recovery and the government policies pushing China’s independence from US supply chains or AI innovation. Naturally, there was a brief pullback in May following the Liberation Day announcements, which placed China in the crosshairs of the US tariff debate. However, strong performance persisted, outpacing most other developed markets, which coincided with another jump up in flows. Since July, however, flows have tapered again, likely reflecting ongoing trade uncertainty between China and the US. Although the two countries have recently agreed to de-escalate tensions, investors and markets remain cautious, contributing to outflows in recent months.
Source: Morningstar
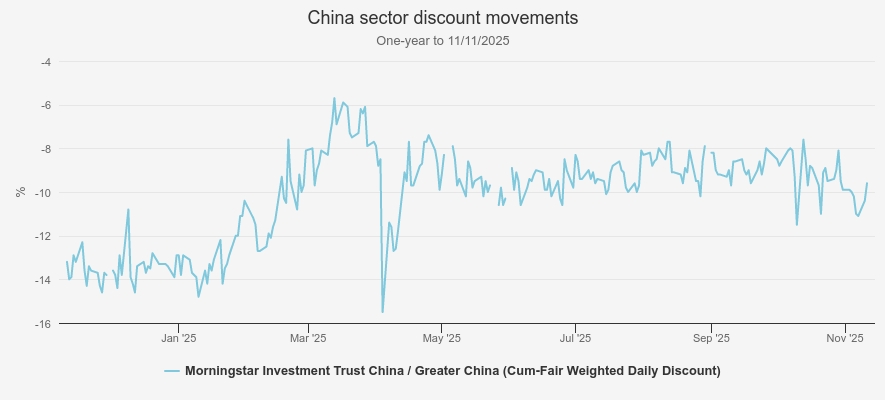
Within the trust space, Baillie Gifford China Growth Trust Ord (LSE:BGCG) has been a key beneficiary. The portfolio, anchored in domestic innovators aligned with rising consumption and government policy priorities, from tech innovation to supply chain interdependence, has helped deliver exceptional performance over the year. This, in turn, has driven a tightening of its discount from 14.8% to 9.6% at the time of writing, though still wider than its five-year average, meaning there could be further scope for narrowing if momentum persists. More broadly, the other two trusts in the China sector have also seen their discounts narrow, meaning all three trusts have experienced some tightening. Taken together, this reflects renewed investor confidence in the region and growing appetite for differentiated, active exposure to China’s evolving long-term growth story.
CHINA SECTOR DISCOUNT MOVEMENTS
Source: Morningstar
Flows regain momentum in Europe
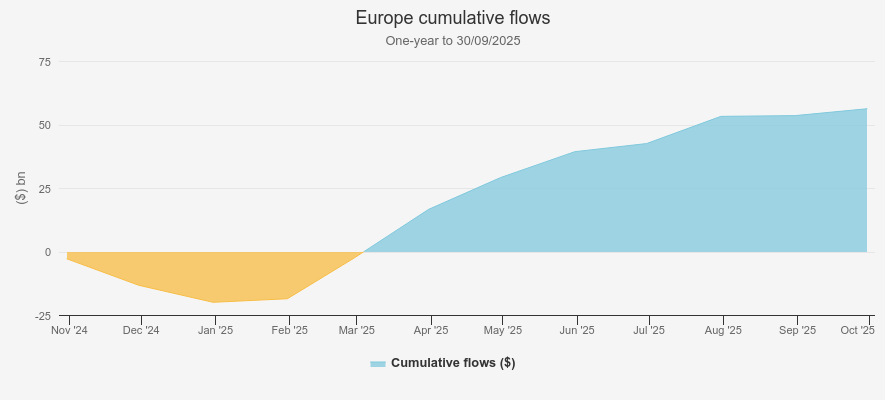
European markets have seen a meaningful resurgence in flows over the past year. For the first time in a long while, European equities have risen because of Europe. Domestically focussed sectors such as banks, engineering and construction have led the rebound, supported by fiscal spending, improving macro fundamentals and valuations that remain attractive relative to the US. This illustrates renewed confidence in a region that had lagged global peers for much of the last decade and highlights a broadening set of domestic opportunities. European markets have thus seen a meaningful resurgence in flows over the past year, which began to accelerate from January 2025 and has maintained strong momentum since, underscoring sustained investor interest in the region.
The flows data shows that both US and European equities saw strong inflows in the first few months of 2025, meaning Europe’s initial uptick cannot simply be explained as capital leaving the US. Looking at money market trends provides insight into how liquidity may have moved across regions: US money market funds experienced consistent outflows across the year, whilst broader global money markets saw inflows through April before turning to outflows from May onwards. This suggests that at least some of the cash previously parked in low-risk instruments in US money markets may have been redeployed into equities globally, with Europe among the beneficiaries.
EUROPE ONE-YEAR CUMULATIVE FLOWS
Source: Morningstar
Like in our GEMs analysis, we’ve looked at European investment trust discount movements to see whether the global fund flow trends, reflecting sentiment across all investor vehicles, are also evident within the sector. The evidence suggests they are.
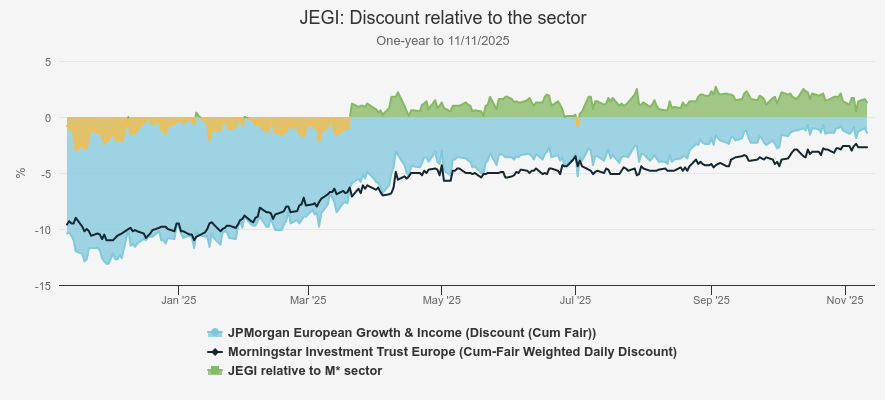
After years when optimism about Europe rarely paid off, active managers have been quick to adapt. JPMorgan European Growth & Income Ord (LSE:JEGI) identified early momentum in domestically focussed sectors whilst trimming exposure to global champions whose dominance, in their view, had waned. This approach has driven a strong record outperformance and helped narrow JEGI’s discount meaningfully over the year, but also relative to the sector, indicating investor recognition of its consistent performance, dividend delivery and ability to capture Europe’s evolving domestic story.
JEGI DISCOUNT RELATIVE TO THE SECTOR
Source: Morningstar
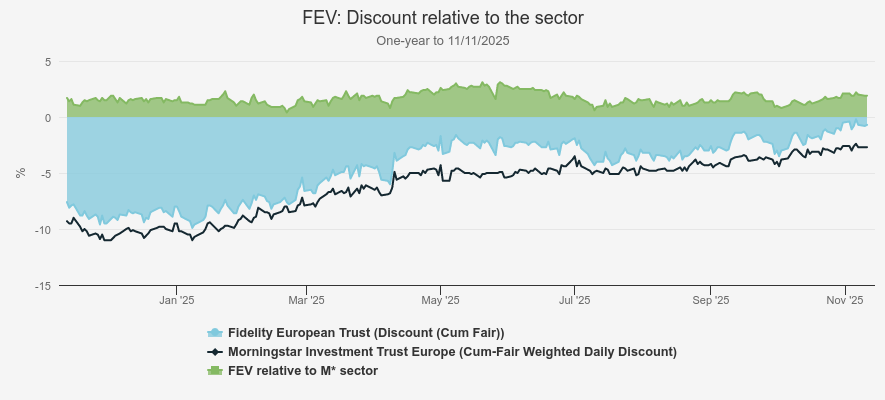
Similarly, Fidelity European Trust Ord (LSE:FEV) has been a clear beneficiary of the renewed interest in European equities this year, supported by attractive relative valuations, improving growth prospects and signs of fiscal loosening in core economies such as Germany. Its quality-focussed approach and consistent execution have kept it ahead of peers, and its discount has tightened from 9.9% to 0.7% at the time of writing, also much tighter than the sector, reflecting investor confidence in both the strategy and the region’s improving fundamentals.
FEV DISCOUNT RELATIVE TO THE SECTOR
Source: Morningstar
Together, these examples show how a combination of macro tailwinds, policy momentum and differentiated active strategies has helped lift both performance and sentiment across European equity trusts. Whilst discount tightening across the wider European sectors has been encouraging, we think the scale of tightening seen in JEGI and FEV underscores a more fundamental shift: investors are re-engaging with active European equity strategies, recognising the value of their distinct positioning and ability to capture Europe’s evolving domestic and growth story.
Some surprises with strong returns but weaker flows
Not all markets seeing strong performance have enjoyed matching inflows, however, with Japan and the UK, in particular, standing out.
Japan:
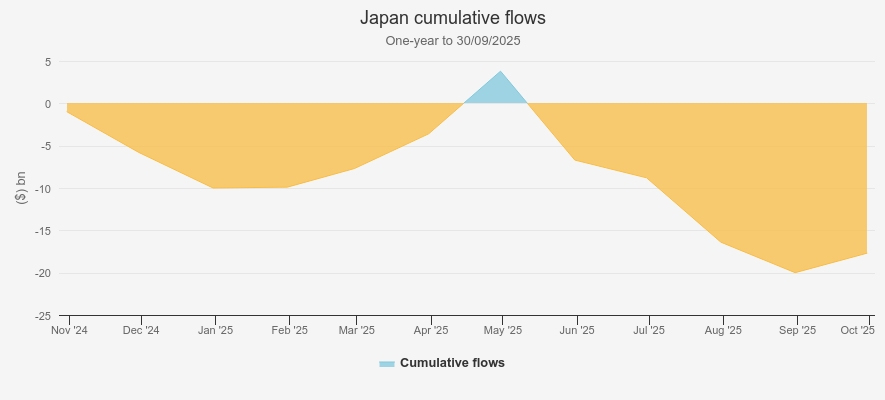
Japan’s equity flows over the past year have been surprisingly mixed. From October 2024 through February 2025, the market saw meaningful outflows despite strong performance, potentially a reflection of profit-taking after prior gains or early concerns around geopolitical and trade tensions. Inflows then surged from February through May 2025, as investors responded to improving domestic momentum, only for outflows to resume from May onwards, with a modest pickup in September.
Several factors help explain this uneven picture. Trade tensions were a key influence: when President Trump’s tariff plans first emerged, Japan appeared exposed to higher-than-anticipated tariffs. Although the final deal lowered tariffs from 25% to 15%, protecting critical sectors such as autos, the drawn-out negotiations weighed on investor confidence, and some remain cautious of future trade frictions. Domestic politics also played a role: the new prime minister’s popularity and pro-reform stance have bolstered optimism, yet many investors are waiting for tangible fiscal or structural outcomes before committing capital. Historical caution continues to shape behaviour as well, with memories of the Lost Decades keeping some long-term investors on the sidelines. Other factors likely contributed to flow dynamics. The market’s sensitivity to global risk, given Japan’s export-led economy, means broader developments, such as US monetary policy, global equity volatility and shifts in Asian growth narratives, can amplify inflow or outflow patterns.
JAPAN ONE-YEAR CUMULATIVE FLOWS
Source: Morningstar
However, we think that caution looks increasingly out of step with reality. Inflation has replaced deflation, interest rates are positive, the yen is stabilising, NISA reforms are driving domestic inflows, and corporate governance continues to unlock value, all whilst valuations remain attractive relative to other developed markets.
Against this improving backdrop, Baillie Gifford Japan Ord (LSE:BGFD), we think, could offer opportunity. Despite a stellar turnaround year of performance, it continues to trade on a discount of around 10.3%, wider than both the sector and its five-year averages. Early corporate reforms initially favoured cyclical, value-oriented names to which BGFD has less exposure, but progress has broadened. Many higher-growth companies that the trust favours are now redeploying cash-heavy balance sheets and improving capital efficiency, after seeing the impact reforms have had across the market. These developments have supported re-ratings more recently and could drive further long-term growth yet to be fully reflected in valuations.
UK:
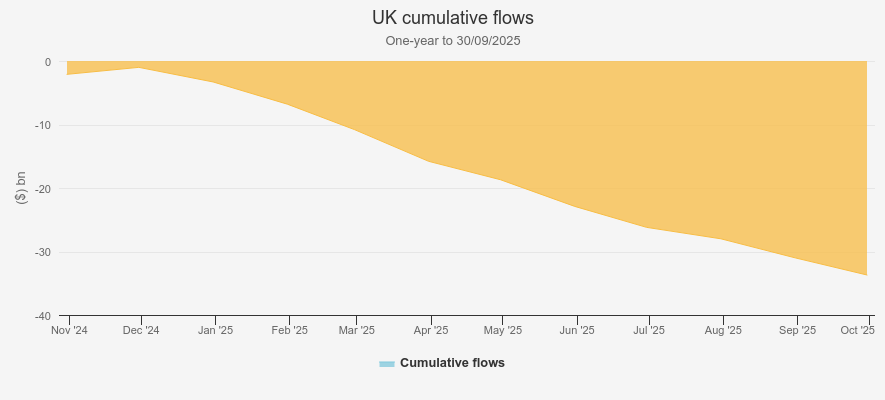
The UK tells a similar story to Japan. Despite outperforming the S&P 500 and seeing a meaningful pickup in M&A from international buyers — highlighting that the UK does, in fact, offer attractive valuations and growth potential — it has seen consistent outflows over the past year.
UK ONE-YEAR CUMULATIVE FLOWS
Source: Morningstar
In our view, this appears more sentiment-driven than fundamental. The UK continues to carry a reputation for low growth and, more recently, vast amounts of political uncertainty, with fiscal concerns ahead of the Budget keeping some investors cautious. Rates may also play a role: whilst the 4% base rate is lower than a peak of 5.25%, it still may not be low enough to lure capital away from safer cash deposits or high-yield bonds, amid a volatile global environment. At the same time, global investors searching for growth and innovation may perceive better opportunities in Europe or Asia, where access to AI, semiconductor and healthcare supply chains feels more direct.
Still, we think value persists. The UK market offers companies with robust fundamentals, global revenue exposure, and dividend yields comfortably above peers. Aberdeen Equity Income Trust (LSE:AEI) exemplifies this blend, delivering a premium dividend without sacrificing a focus on quality and diminishing the long-term capital growth potential. Its discount has narrowed from double digits to a tight 1.4%, reflecting recognition of its differentiated approach.
Further down the market-cap scale sits Rockwood Strategic Ord (LSE:RKW), a trust we think continues to challenge perceptions of the UK as a low-growth market. Its hands-on approach to small and micro caps has consistently captured highly idiosyncratic, uncorrelated alpha, with a strong performance track record reflected in its persistent premium rating.
Conclusion
2025 has been a year of nuanced dialogue in global equity markets. Despite headline turbulence in the US, with trade tensions, tech wobbles and market corrections, outflows only began to emerge in the past few months.
Emerging and frontier markets, along with China, have been the clearest beneficiaries of these shifts. Sharp inflows into GEMs and frontier markets reflect not just a search for growth alternatives, but also the appeal of structural improvements, governance reforms and valuations that remain compelling relative to developed markets. China saw strong inflows for much of the year, though they have tapered recently, highlighting how geopolitical tensions and trade uncertainty continue to shape behaviour despite ongoing domestic stimulus, innovation and investor optimism. Europe has also enjoyed a steady resurgence, supported by domestic momentum, attractive valuations and active managers capturing opportunities in long-overlooked sectors. Trust discount movements further underline renewed investor interest and recognition of differentiated strategies.
Japan and the UK provide some of the year’s most striking surprises. Japan, despite strong performance and a supportive backdrop, has experienced highly mixed flows, with early outflows potentially reflecting profit-taking, a short but sharp surge of inflows in the spring and subsequent moderation amid geopolitical and trade concerns. The UK, meanwhile, has seen consistent outflows despite solid returns and rising international M&A activity, suggesting sentiment remains constrained by political uncertainty and lingering low-growth perceptions, even as valuation opportunities appear compelling.
Taken together, global flows this year reveal a more measured, nuanced approach than first assumed. Investors are beginning to look beyond the US, but by no means in a rash exit or knee-jerk reaction, with outflows appearing to favour markets that combine structural growth, valuation appeal and differentiated opportunities, at a fraction of the cost of some of the big US tech names. One way of looking at this is to say that if so little money has come out of US equities so far, there could be plenty more to come and provide upwards pressure on other markets.
Kepler Partners is a third-party supplier and not part of interactive investor. Neither Kepler Partners or interactive investor will be responsible for any losses that may be incurred as a result of a trading idea.
These articles are provided for information purposes only. Occasionally, an opinion about whether to buy or sell a specific investment may be provided by third parties. The content is not intended to be a personal recommendation to buy or sell any financial instrument or product, or to adopt any investment strategy as it is not provided based on an assessment of your investing knowledge and experience, your financial situation or your investment objectives. The value of your investments, and the income derived from them, may go down as well as up. You may not get back all the money that you invest. The investments referred to in this article may not be suitable for all investors, and if in doubt, an investor should seek advice from a qualified investment adviser.
Full performance can be found on the company or index summary page on the interactive investor website. Simply click on the company's or index name highlighted in the article.
Important Information
Kepler Partners is not authorised to make recommendations to Retail Clients. This report is based on factual information only, and is solely for information purposes only and any views contained in it must not be construed as investment or tax advice or a recommendation to buy, sell or take any action in relation to any investment.
This report has been issued by Kepler Partners LLP solely for information purposes only and the views contained in it must not be construed as investment or tax advice or a recommendation to buy, sell or take any action in relation to any investment. If you are unclear about any of the information on this website or its suitability for you, please contact your financial or tax adviser, or an independent financial or tax adviser before making any investment or financial decisions.
The information provided on this website is not intended for distribution to, or use by, any person or entity in any jurisdiction or country where such distribution or use would be contrary to law or regulation or which would subject Kepler Partners LLP to any registration requirement within such jurisdiction or country. Persons who access this information are required to inform themselves and to comply with any such restrictions. In particular, this website is exclusively for non-US Persons. The information in this website is not for distribution to and does not constitute an offer to sell or the solicitation of any offer to buy any securities in the United States of America to or for the benefit of US Persons.
This is a marketing document, should be considered non-independent research and is subject to the rules in COBS 12.3 relating to such research. It has not been prepared in accordance with legal requirements designed to promote the independence of investment research.
No representation or warranty, express or implied, is given by any person as to the accuracy or completeness of the information and no responsibility or liability is accepted for the accuracy or sufficiency of any of the information, for any errors, omissions or misstatements, negligent or otherwise. Any views and opinions, whilst given in good faith, are subject to change without notice.
This is not an official confirmation of terms and is not to be taken as advice to take any action in relation to any investment mentioned herein. Any prices or quotations contained herein are indicative only.
Kepler Partners LLP (including its partners, employees and representatives) or a connected person may have positions in or options on the securities detailed in this report, and may buy, sell or offer to purchase or sell such securities from time to time, but will at all times be subject to restrictions imposed by the firm's internal rules. A copy of the firm's conflict of interest policy is available on request.
Past performance is not necessarily a guide to the future. The value of investments can fall as well as rise and you may get back less than you invested when you decide to sell your investments. It is strongly recommended that Independent financial advice should be taken before entering into any financial transaction.
PLEASE SEE ALSO OUR TERMS AND CONDITIONS
Kepler Partners LLP is a limited liability partnership registered in England and Wales at 9/10 Savile Row, London W1S 3PF with registered number OC334771.
Kepler Partners LLP is authorised and regulated by the Financial Conduct Authority.