Which investment trusts were out of the blocks fastest?
21st April 2023 14:01
A Kepler Trust Intelligence analyst considers top performers year to date and where value lies for investors.

This content is provided by Kepler Trust Intelligence, an investment trust focused website for private and professional investors. Kepler Trust Intelligence is a third-party supplier and not part of interactive investor. It is provided for information only and does not constitute a personal recommendation.
Material produced by Kepler Trust Intelligence should be considered a marketing communication, and is not independent research.
The year so far has seen a modest recovery in equity markets, with the FTSE All-Share Index up 5.8% and the S&P 500 Index up 4.2%, at the time of writing. This has been driven by a rebound in growth, which has outperformed value, using the respective MSCI World indices, by 14%. The US 10-year yield, a major influence on the price of other financial assets, has not actually moved much, falling slightly from 3.7% at the start of January to 3.4% at the start of April. It did rise above 4% in March as inflationary fears rose, before falling as new data suggested inflation had peaked and a banking crisis made interest rate cuts seem more likely.
- Invest with ii: Buy Investment Trusts | Top UK Shares | Open a Trading Account
To us, it is suggestive that growth equities outperformed, even in the earlier part of the period as yields rose. In our view, this may indicate that growth was being bought purely on valuation grounds, even before data suggested lower rates might be nearer, i.e. that this move in growth is not just a macro play. However, this is not the whole story. Looking at the performance of investment trusts and their discounts, we think some interesting features emerge, which may suggest where there is value.
YEAR TO DATE PERFORMANCE OF INDICES
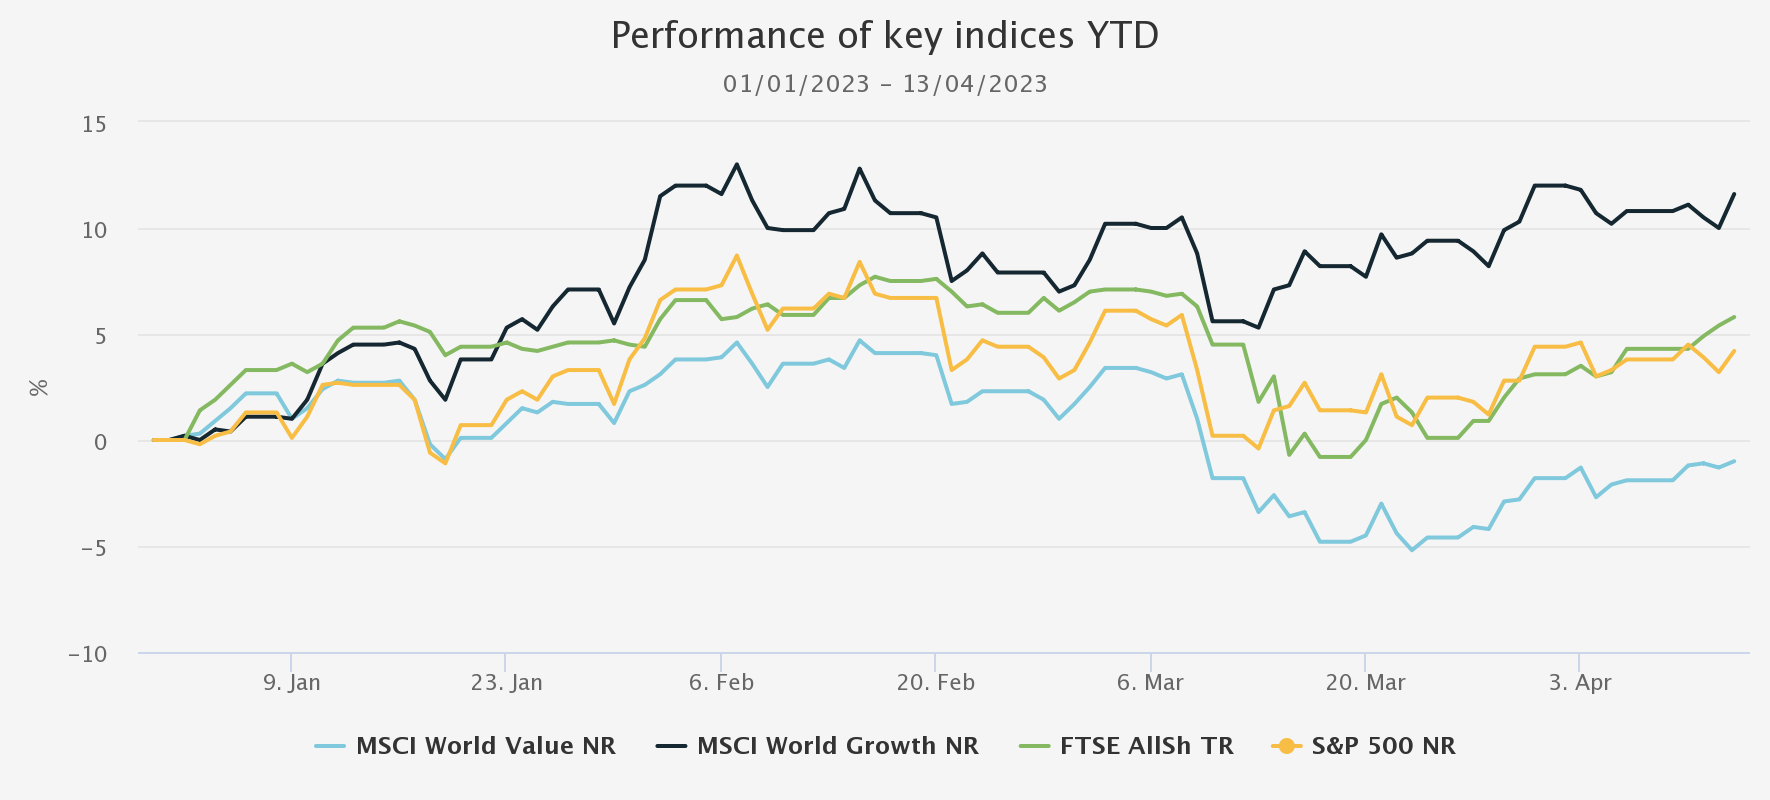
Source: Morningstar. Past performance is not a reliable indicator of future results
Performance
Technology and growth-focused trusts have been leading the pack year to date. Polar Capital Technology (LSE:PCT)and Allianz Technology Trust (ATT) are up 14.5% and 11%, respectively. Meanwhile, Martin Currie Global Portfolio (MNP) and BlackRock Greater Europe (BRGE) are among the growth-focussed all-sector portfolios to have returned double digits in NAV total return terms. European trusts, in particular, have done well, despite the wobble seen in the region’s markets when Credit Suisse (SIX:CSGN) collapsed. Henderson EuroTrust (HNE) and Fidelity European Trust (LSE:FEV)have also returned over 10%. Henderson European Focus (HEFT)and the European Opportunities Trust (EOT) have each returned over 9%.
TOP 10 TRUSTS BY NAV TR IN 2023 YEAR TO DATE
Source: Morningstar, to 12/04/2023. Past performance is not a reliable indicator of future results
However, there is certainly not a general picture of growth outperforming, which would imply a market rotation taking place based on lower interest rate expectations and a return to pre-pandemic normal. Strong performance has been concentrated in developed world, large-cap growth stocks, largely in the US and Europe. The two UK-focused portfolios to have done the best, i.e. Aurora (LSE:ARR) andDowning Strategic Micro-Cap (LSE:DSM), have more value-focused strategies, as does Canadian General Investments (LSE:CGI), if only by virtue of the structure of the Canadian market.
Looking on a share price total-return basis, perhaps unsurprisingly over such a short period, corporate action and change has been behind some of the largest movers, such as Ediston Property Investment Company (LSE:EPIC), which announced a strategic review. Majedie Investments (LSE:MAJE) is another example, as the trust produced share price returns just outside the top 10, of 12.8%. MAJE has appointed a new manager, Marylebone Partners, with a new strategy aimed at offering investors a liquid endowment-like portfolio unlike anything in the investment trust universe. Initial reaction has been positive, with the discount closing from circa 23% in January to 13.6%, at the time of writing. We analysed the new strategy in a recent note.
TOP 10 TRUSTS BY SHARE PRICE TR IN 2023 YEAR TO DATE
Source: Morningstar, to 12/04/2023. Past performance is not a reliable indicator of future results
There are also some examples of trusts and sectors that have been most out of favour rebounding, such as the aircraft leasing funds, and a similar move may be behind the uptick in the NAV of the two UK small-cap trusts referred to earlier, at the underlying holding level. Notably, however, this renewed appetite hasn’t really extended to many trusts in the illiquid asset classes, at least not at the top of the performance list. CT Private Equity Trust Ord (LSE:CTPE) is one exception but, despite strong share price gains, it is still trading at a discount of 33.7%. Tritax Big Box Ord (LSE:BBOX) has seen decent gains of 8.2%, despite not posting a new NAV, perhaps mirroring the bounce in tech and growth assets. Schroder Real Estate Invest Ord (LSE:SREI) has also seen strong share price gains of 10.4%, perhaps reflecting the market’s recognition of the strength of its balance sheet
Discounts
To us, it looks like holdings in private assets are one of the key themes determining which trusts are at wide discounts versus history. In our view, this explains why Scottish Mortgage Ord (LSE:SMT)’s discount is over 3.5 standard deviations below its five-year average. Despite holding many large-cap growth stocks and having exposure to technology in various forms, SMT’s discount is still extremely wide. There are other issues at SMT: Moderna Inc (NASDAQ:MRNA), the largest holding, has been under pressure, and there has been a boardroom bust-up, which has garnered bad press. At the heart of the disagreements among board members seems to be the unlisted portfolio, though. In our view, if confidence can be built in the valuations of the unlisted holdings in SMT, then there must be scope for the remarkable discount to narrow.
LOWEST FIVE-YEAR Z-SCORES
Source: Morningstar, to 12/04/2023. Past performance is not a reliable indicator of future results
Many of the other lowest z-scores are among renewables and infrastructure trusts, as well as among property sectors seen as bond proxies when yields were lower on government debt. This may be driven by valuations and concerns about discount rates. In that light, we find it interesting that technology and large-cap growth stocks have outperformed. This seems to us to indicate a belief that peak inflation has passed, and the pressure on equity valuations should be relieved in anticipation of rate cuts.
But surely then, infrastructure and other illiquid, high-yielding assets should also see a re-rating? Could it be that the equity market has moved first and the share prices of infrastructure, property and unlisted investments, such as the listed private equity sector or SMT, have lagged? This could make sense, as activity in the underlying markets for unlisted companies is likely to pick up more slowly – it is simpler to hit ‘buy’ on a screen and load up on listed stocks, than complete a private transaction. As such, buyers of investment trusts may be holding fire. After all, there have been other false dawns when it comes to peak inflation. If this one proves to be the real thing, we think there may be value in some of these illiquid assets.
Interestingly, the other obvious theme among trusts with the lowest Z-scores is defensives. Capital Gearing and Personal Assets are both at wide discounts versus their five-year averages. Both have discount control mechanisms, so their ratings have been pinned fairly close to par and the discounts are not wide in absolute terms. However, both have been on discounts for over a month, despite buying back shares. Given their tendency to trade on premiums, this could be an advantageous time to gain exposure for those who want to hold these for the long term.
Performance of Kepler team's picks
Finally, we turn our attention to the picks of your analyst team. Like a skull kept on a desk in the renaissance as a memento mori, our annual picks keep us humble. Our rationale for our selections was published in January. Leading the pack (in NAV and share price terms) is European Opportunities Trust (LSE:EOT). Alexander Darwall’s portfolio is made up of quality growth large-caps, and as such has benefited from growth being in favour and also perhaps the defensive qualities in the portfolio, which should mean it is relatively protected from any recession.
AVI Japan Opportunity Ord (LSE:AJOT) has also performed well. AJOT is the top-performing Japanese small-cap trust since it was launched, and second only to one Japan equity trust over the period. Its strategy sees returns generated from idiosyncratic activist opportunities, which means it is less dependent on the health of the overall market for returns. Nonetheless, Japan has started 2023 in a better place, which may aid absolute returns, as we discuss in our recent note.
Hipgnosis Songs Ord (LSE:SONG) has also seen a bounce in share price terms, although the NAV has not moved much. This may reflect the dynamic we have identified above: there has been a shift from value to growth in equities, as interest rate expectations have changed, but growth-sensitive alternatives have not repriced. Arguably, this could be an opportunity, particularly in SONG given the wide discount, but investors may be waiting to get confirmation of the NAV via sales of assets.
YEAR TO DATE PERFORMANCE OF PICKS
| LATEST DISCOUNT (CUM FAIR) | CUM FAIR NAV RETURN (CUMULATIVE) | MARKET RETURN (CUMULATIVE) | ||
| European Opportunities Trust | -14.6 | 9.3 | 7.3 | Alan Ray |
| AVI Japan Opportunities | -2.2 | 5.7 | 5.1 | Thomas McMahon |
| The Global Smaller Companies Trust Ord (LSE:GSCT) | -12.3 | 1.7 | 1.3 | Ryan Lightfoot-Aminoff |
| Hipgnosis Songs | -46.0 | 0.9 | 3.7 | William Heathcoat Amory |
| AVI Global | -9.3 | -0.1 | -0.4 | Nicholas Todd |
| Bellevue Healthcare Ord (LSE:BBH) | -4.7 | -2.0 | 2.6 | Pascal Dowling |
Source: Morningstar, to 12/04/2023. Past performance is not a reliable indicator of future results
Conclusion
Surveying the market, it looks to us as if it is tentatively beginning to price in a peak in inflation and lower interest rates to come. However, the riskier equities – i.e. small caps – and illiquid assets have not moved much yet. We think this is likely because consensus has not yet formed on whether rates will be cut in the teeth of a recession or whether the developed world economies have scraped through this inflationary spurt without triggering any serious decline in economic activity. Employment data is extremely resilient, and PMIs also looking OK.
While UK manufacturing PMIs indicate strong expected growth, the US is teetering around 50, implying no growth, beating expectations for a decline. The eurozone picture is more negative, perhaps because the fallout from the Ukraine war has a greater impact on energy supply and manufacturing. To us, many alternative asset trusts, from property to more unconventional assets, look extremely interesting on their current discounts. When it comes to small-caps, we have no greater insight to offer than the world’s economists, but taking exposure at these discounts and after a sell-off could lead to excellent returns if the optimistic scenario pans out.
Kepler Partners is a third-party supplier and not part of interactive investor. Neither Kepler Partners or interactive investor will be responsible for any losses that may be incurred as a result of a trading idea.
These articles are provided for information purposes only. Occasionally, an opinion about whether to buy or sell a specific investment may be provided by third parties. The content is not intended to be a personal recommendation to buy or sell any financial instrument or product, or to adopt any investment strategy as it is not provided based on an assessment of your investing knowledge and experience, your financial situation or your investment objectives. The value of your investments, and the income derived from them, may go down as well as up. You may not get back all the money that you invest. The investments referred to in this article may not be suitable for all investors, and if in doubt, an investor should seek advice from a qualified investment adviser.
Full performance can be found on the company or index summary page on the interactive investor website. Simply click on the company's or index name highlighted in the article.
Important Information
Kepler Partners is not authorised to make recommendations to Retail Clients. This report is based on factual information only, and is solely for information purposes only and any views contained in it must not be construed as investment or tax advice or a recommendation to buy, sell or take any action in relation to any investment.
This report has been issued by Kepler Partners LLP solely for information purposes only and the views contained in it must not be construed as investment or tax advice or a recommendation to buy, sell or take any action in relation to any investment. If you are unclear about any of the information on this website or its suitability for you, please contact your financial or tax adviser, or an independent financial or tax adviser before making any investment or financial decisions.
The information provided on this website is not intended for distribution to, or use by, any person or entity in any jurisdiction or country where such distribution or use would be contrary to law or regulation or which would subject Kepler Partners LLP to any registration requirement within such jurisdiction or country. Persons who access this information are required to inform themselves and to comply with any such restrictions. In particular, this website is exclusively for non-US Persons. The information in this website is not for distribution to and does not constitute an offer to sell or the solicitation of any offer to buy any securities in the United States of America to or for the benefit of US Persons.
This is a marketing document, should be considered non-independent research and is subject to the rules in COBS 12.3 relating to such research. It has not been prepared in accordance with legal requirements designed to promote the independence of investment research.
No representation or warranty, express or implied, is given by any person as to the accuracy or completeness of the information and no responsibility or liability is accepted for the accuracy or sufficiency of any of the information, for any errors, omissions or misstatements, negligent or otherwise. Any views and opinions, whilst given in good faith, are subject to change without notice.
This is not an official confirmation of terms and is not to be taken as advice to take any action in relation to any investment mentioned herein. Any prices or quotations contained herein are indicative only.
Kepler Partners LLP (including its partners, employees and representatives) or a connected person may have positions in or options on the securities detailed in this report, and may buy, sell or offer to purchase or sell such securities from time to time, but will at all times be subject to restrictions imposed by the firm's internal rules. A copy of the firm's conflict of interest policy is available on request.
Past performance is not necessarily a guide to the future. The value of investments can fall as well as rise and you may get back less than you invested when you decide to sell your investments. It is strongly recommended that Independent financial advice should be taken before entering into any financial transaction.
PLEASE SEE ALSO OUR TERMS AND CONDITIONS
Kepler Partners LLP is a limited liability partnership registered in England and Wales at 9/10 Savile Row, London W1S 3PF with registered number OC334771.
Kepler Partners LLP is authorised and regulated by the Financial Conduct Authority.