10 high-yielding shares in the FTSE 100: how safe are their dividends?
We update the numbers to show the 10 highest-yielding shares in the FTSE 100.
24th October 2019 10:06
by Tom Bailey from interactive investor
We update the numbers to show the 10 highest-yielding shares in the FTSE 100 at the end of the third quarter.
The FTSE 100 is expected to hand back a record amount of dividends to investors this year, according to latest figures.
According to a recent third quarter report, the blue-chip stock index is expected to see dividend payments grow by a total of 4.8% in 2019. That would bring the total amount paid out by the index to a record £92.6 billion, surpassing the previous record set last year, of just under £90 billion.
Those figures are below what expectations were six months ago, with figures released at the start of the second quarter placing the UK market on track to yield 5.8% with a £96.2 billion in total dividends paid.
Even so, the new figures, while lower, suggests the UK market is still paying out a generous amount of income.
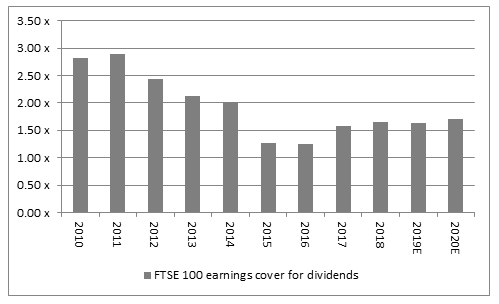
Dividend cover for the index is 1.63 times, a slight fall from mid-October when it stood at 1.74 times (the last time we updated this article). As a rule of thumb, shares with a dividend cover score of above 2 are considered reliable dividend payers.
Which FTSE 100 firms provide the highest yield?
Of the 10 highest yielding shares in the FTSE 100 three are housebuilders, with two offering yields above 10%. Persimmon (LSE:PSN) offers a yield of 11.5% and Taylor Wimpey (LSE:TW.) 11.9%. Barratt Developments (LSE:BDEV) is yielding 7.5%.
The appearance of these housebuilders at the top can be taken two ways. On the one hand, "it is testimony to the size of their capital return programmes," says one analyst.
Alternately, the high yields could be interpreted as resulting investor scepticism about the future of the industry as Help to Buy approaches its end. Both have dividend cover way below the average.
How safe are the dividends?
According to an analyst:
"Would-be buyers of UK-quoted stocks will be looking a little nervously at the degree to which company profits cover forecast dividend payments, especially after dividend cuts at Vodafone (LSE:VOD), Centrica (LSE:CNA) and – before it fell out of the FTSE 100 – Marks & Spencer (LSE:MKS)"
In particularly, dividend cover for some of the highest yielding stocks is historically low. Based on forecasted earnings, dividend cover is expected to be an average of 1.63x for 2019. That is below what it was in 2018 and significantly below the 2x seen as the minimum comfort level.
Leading this trend, however, is the expected high payouts from the aforementioned housebuilders. The generous dividend payouts from Taylor Wimpey (LSE:TW.) and Persimmon (LSE:PSN) give them a forecast dividend cover of just 1.12x and 1.15x, respectively. Barratt Development's (LSE:BDEV) cove is slightly better at 1.58x, but still way below the ideal of 2x.
However, The good news is that all three [housebuilders] have net cash balance sheets with which to reassure shareholders, even if earnings cover looks lower than ideal.
Standard Life Aberdeen (LSE:SLA) currently has the lowest dividend cover at 0.87x, meaning it will need to find an alternative source of funding to cover its forecasted dividend payments.
Why does dividend cover matter?
A key indicator of dividend sustainability is dividend cover. This is considered an important metric in assessing whether a company is in a healthy position to distribute the level of dividends it proposes to. The metric is calculated by dividing earnings per share by dividend per share.
As a rule of thumb, a low dividend cover score – of around one times or lower – suggests that dividends are vulnerable, as the company is using most, if not all, of its profits to fund its dividends. A figure of two or more times is viewed as comfortable, because it is a sign that a business is not over-distributing.
| 2019 forecast | 2019 forecast | ||
|---|---|---|---|
| dividend yield (%) | dividend cover (x) | ||
| 1 | Evraz (LSE:EVR) | 15.3% | 1.34 x |
| 2 | Taylor Wimpey (LSE:TW.) | 11.9% | 1.12 x |
| 3 | Persimmon (LSE:PSN) | 11.5% | 1.15 x |
| 4 | Imperial Brands (LSE:IMB) | 11.1% | 1.34 x |
| 5 | BT (LSE:BT.A) | 8.5% | 1.61 x |
| 6 | Aviva (LSE:AV.) | 8.3% | 1.92 x |
| 7 | Standard Life Aberdeen (LSE:SLA) | 8.1% | 0.87 x |
| 8 | Rio Tinto (LSE:RIO) | 7.8% | 1.66 x |
| 9 | Barratt Developments (LSE:BDEV) | 7.5% | 1.58 x |
| 10 | British American Tobacco (LSE:BATS) | 7.5% | 1.54 x |
Full performance can be found on the company or index summary page on the interactive investor website. Simply click on the company's or index name highlighted in the article.
This article was originally published in our sister magazine Money Observer, which ceased publication in August 2020.
These articles are provided for information purposes only. Occasionally, an opinion about whether to buy or sell a specific investment may be provided by third parties. The content is not intended to be a personal recommendation to buy or sell any financial instrument or product, or to adopt any investment strategy as it is not provided based on an assessment of your investing knowledge and experience, your financial situation or your investment objectives. The value of your investments, and the income derived from them, may go down as well as up. You may not get back all the money that you invest. The investments referred to in this article may not be suitable for all investors, and if in doubt, an investor should seek advice from a qualified investment adviser.
Full performance can be found on the company or index summary page on the interactive investor website. Simply click on the company's or index name highlighted in the article.