European trusts and ‘mirror’ funds: which is the fairest of all?
As investors reassess their Europe allocation, Kepler compares the performance of the region’s investment trusts with their open-ended sister funds.
6th June 2025 14:02

This content is provided by Kepler Trust Intelligence, an investment trust focused website for private and professional investors. Kepler Trust Intelligence is a third-party supplier and not part of interactive investor. It is provided for information only and does not constitute a personal recommendation.
Material produced by Kepler Trust Intelligence should be considered a marketing communication, and is not independent research.
There is no obvious reason why the average British person - or indeed the average European - would have heard of a German town of fewer than 200,000 inhabitants on the outskirts of Cologne. Leverkusen, however, might be an exception, for at least two reasons: it is home to the headquarters of Bayer AG (XETRA:BAYN), the EURO STOXX 50 pharmaceutical company, and to the football team it owns, Bayer Leverkusen - a club that occasionally faces British teams in UEFA Champions League or Europa League fixtures.
Bayer Leverkusen long carried the unenviable nickname 'Neverkusen,' a nod to the club’s repeated campaigns that came close to -but never won - the German top-flight football league since its founding in 1904. As such, the team often played second fiddle to the likes of Bayern Munich and Borussia Dortmund. That is until Bayer Leverkusen eventually broke the curse in the 2023-24 season.
Arguably, one could draw some parallels with European equities, which have often suffered in comparison to their US counterparts, rarely outperforming them. For instance, since calendar year 2016, the STOXX Europe 50 Index has outperformed the S&P 500 Index in only two full calendar years, as the chart below shows. However, 2025 is on track to be another year of outperformance, which has helped revive interest in the asset class.
Indices performance
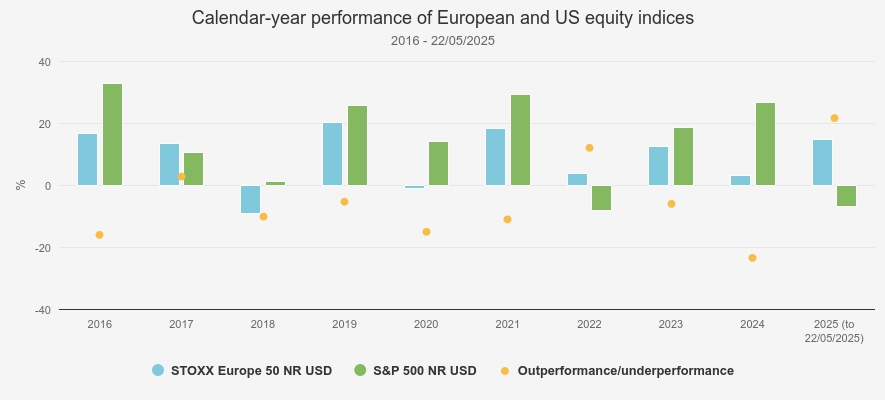
Source: Morningstar. Past performance is not a reliable indicator of future results
As investors may be reassessing their allocation to European equities, we thought now would be a good opportunity to take a step back and examine how investment trusts in the AIC Europe and European Smaller Companies sectors have performed relative to their open-ended counterparts over the past five years (to 22 May 2025). We chose five years, as it is a meaningful period, giving an investment strategy time to come to fruition.
We considered an open-ended fund to be a 'sibling' of an investment trust if the two vehicles have been managed by the same investment management company over the period, broadly follow the same investment objectives, and fall within equivalent Investment Association sectors (i.e. IA Europe Excluding UK and IA European Smaller Companies).
The table below lists the investment trusts for which we could identify open-ended counterparts, indicating their NAV total return (TR) and share price TR over five years (to 22 May 2025), as well as the TRs generated by their open-ended sibling over the same period.
Five-year performance
| Investment trust | Five-year nav tr (to 22/05/2025) (%) | Five-year share price tr (to 22/05/2025) (%) | Equivalent open-ended fund(s) | Five-year tr (to 22/05/2025) (&) |
| AIC Europe / IA Europe Excluding UK | ||||
| FTSE World Europe ex UK NR (to 22/05/2025): 72.6% | ||||
| Henderson European Trust (HET) | 81.9 | 93.8 | Janus Henderson European Selected Opportunities | 76.8 |
| Fidelity European Trust (FEV) | 79.2 | 91.7 | Fidelity European | 66.9 |
| BlackRock Greater Europe (BRGE) | 63.9 | 63.1 | BlackRock Continental European | 65.3 |
| Baillie Gifford European Growth (BGEU) | 11.9 | 9.5 | Baillie Gifford European | 9.2 |
| AIC European Smaller Companies / IA European Smaller Companies | ||||
| MSCI Europe ex UK Small Cap NR (to 22/05/2025): 59.7% | ||||
| European Smaller Companies (ESCT) | 101.7 | 140.5 | Janus Henderson European Smaller Companies | 84.4 |
| JPMorgan European Discovery Trust (JEDT) | 66.1 | 92.5 | JPM Europe Smaller Companies | 55.0 |
| European Assets (EAT) | 28.0 | 31.9 | CT European Smaller Companies | 21.5 |
Source: Morningstar. Past performance is not a reliable indicator of future results
The (almost) undefeated
The 2023-24 season of Germany’s top football league marked two historic firsts: Bayer Leverkusen’s first-ever league title and the first time a league winner completed the season undefeated. This is almost what investment trusts focussing on European equities achieved in their duels with equivalent open-ended funds, with six out of seven having outperformed the TRs of their counterparts over the past five years, and this not only a NAV TR but also a share price TR basis. Investment trusts also performed better than open-ended funds when considering returns versus the indices. Two of the four large-cap trusts outperformed the index compared to just one of the open-ended funds, with the Fidelity team delivering NAV outperformance of the index on the trust but not the fund. Two of the three small-cap trusts outperformed the small-cap index compared to just one of the funds, with investors in the JPM small cap trust outperforming in NAV terms while the open-ended peer underperformed.
Of particular note in the large-cap sector is Fidelity European Trust Ord (LSE:FEV), which has outperformed the TR of Fidelity European by 12.3 percentage points on a NAV basis and by 24.8 in share price terms. Both vehicles are managed by Sam Morse and Marcel Stötzel, who aim to provide core exposure to European equities, focussing on companies that can generate higher returns on capital and with a preference for those that have a proven ability to grow their dividend over time (although FEV is not an income strategy).
FEV’s share price performance has been particularly significant, which is an important consideration, given that it is what investors ultimately receive, and has led its discount to narrow from circa 11% to circa 2%. While the share buybacks pursued by the board may have helped, we think it is also reflective of the strategy’s strong track record, which may have attracted more investors. This is further reinforced, in our view, by the fact that FEV has a sizeable market capitalisation (c. £1.7 billion at the time of writing), making its shares liquid enough for a wide range of investors, including institutional investors. Finally, investors have been moving away from the US since the beginning of the year, notably to Europe, which may have accelerated the narrowing of the discount (the trust traded at an 8% discount on 31 December 2024). Given its core strategy, FEV has likely been viewed by investors as a foundation stone for building exposure to European equities.
While FEV is now trading close to par, we believe that another feature of the investment trust structure could continue to make it a more appealing option than its open-ended sibling: its use of gearing. In fact, we believe that gearing has played an important role in FEV’s NAV outperformance of Fidelity European, with FEV’s gearing having averaged c. 12% over the past five years (to 30 April 2025), which may also help explain why it outperformed the FTSE World Europe ex UK Index, whereas its open-ended sibling did not. As the chart below shows, the use of gearing boosted FEV’s NAV returns in rising markets, sometimes by more than five percentage points such as in 2021. While it may also exaggerate drawdowns in falling markets—as it did in 2022—we believe that gearing could contribute to FEV continuing to outperform its open-ended sibling over the long term, with gearing currently standing at 11.7% (as of 30 April 2025).
Calendar-year performance
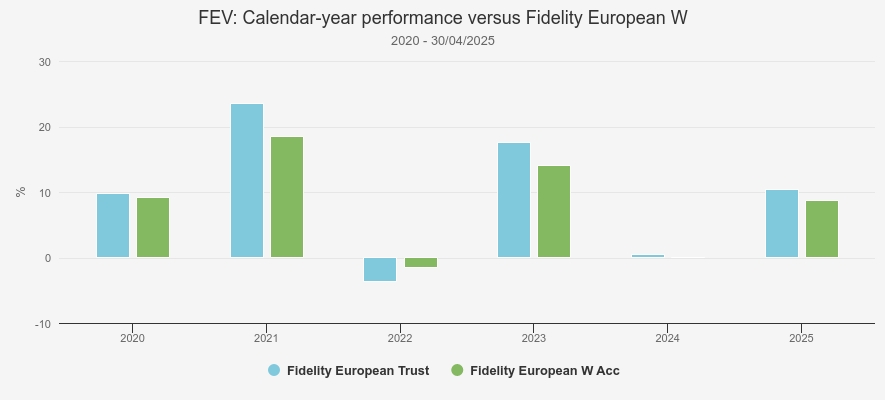
Source: Morningstar. Past performance is not a reliable indicator of future results
Henderson European Trust Ord (LSE:HET)and Janus Henderson European Selected Opportunities have both outperformed the FTSE World Europe ex UK Index. However, HET has delivered stronger results, with both its NAV and share price outperforming the TR of its open-ended sibling. That said, it is worth noting that HET is the product of a combination of Henderson European Focus Trust (HEFT) and Henderson EuroTrust (HNE), completed in July 2024.
As such most of HET’s track record reflects the one of HEFT, which absorbed the assets of HNE, and followed a style-agnostic strategy blending growth and value stocks. This has proven beneficial over the past five years, as factor rotations have been frequent, and this is an approach HET has initially followed. However, Tom O’Hara and Jamie Ross, who managed HEFT and HNE respectively, and then co-managed HET left Janus Henderson in early 2025 and the trust is currently undergoing a strategic review.
Like FEV and HET, Baillie Gifford European Growth Ord (LSE:BGEU) outperformed its open-ended sibling, Baillie Gifford European. However, neither vehicle has managed to outperform the FTSE World Europe ex UK Index, with the strategy notably facing stylistic headwinds in the period under review. We take a closer look at BGEU in the next section alongside European Assets Ord (LSE:EAT), a constituent of the AIC European Smaller Companies sector.
In contrast to the previously mentioned investment trusts, BlackRock Greater Europe Ord (LSE:BRGE) has not outperformed its open-ended counterpart, BlackRock Continental European, although the difference in performance has been marginal. Moreover, neither vehicle has outperformed the FTSE World Europe ex UK Index in the period under review. That said, we think the strategy could be well positioned for the long term, offering exposure to structural growth themes through holdings such as semiconductor leader ASML Holding NV (EURONEXT:ASML), digital automation specialist Schneider Electric SE (EURONEXT:SU), and aerospace & defence company Safran SA (EURONEXT:SAF).
However, we believe BRGE could have more upside potential than its open-ended sibling, as it currently trades at a 5.9% discount (as of 22/05/2025). In addition, certain liquidity mechanisms may enhance shareholder returns relative to the open-ended version. For instance, alongside ongoing share buybacks, the board has the authority to implement a tender offer twice a year for up to 20% of the trust’s issued share capital. BRGE also employs gearing, currently at 5.4% (as of 31/03/2025), which could boost long-term returns.
In the AIC European Smaller Companies sector, The European Smaller Companies Trust PLC (LSE:ESCT) was the standout, outperforming the total returns of Janus Henderson European Smaller Companies by 17.3 percentage points on a NAV basis and 56.1 in share price terms. While the two funds are managed by the same team—consisting of Ollie Beckett, Rory Stokes, and Julia Scheufler—who focus on companies at different stages of their life cycle, such as early-stage, quality growth, mature, and turnaround, the two portfolios are not entirely identical.
For instance, ESCT has held more in mid-caps than its open-ended sibling over the past five years, as the bar chart below shows. This may have played an important role, as European mid-caps have significantly outperformed their small-caps in the period under review. In addition, ESCT’s gearing has averaged c. 11% over the past five years, which is likely to have boosted the trust’s NAV performance.
Market-cap allocation

Source: Morningstar
ESCT’s share price outperformance has been even more pronounced, reflected in the trust’s discount narrowing significantly from 21.9% to 5.6% over the past five years. While the board has been actively repurchasing shares since 2023, a key factor has been the involvement of activist investor Saba, which built a large position in the trust last year. Following negotiations between the two parties, a tender offer was announced in mid-April 2025, resulting in 42.2% of shares being tendered when the offer closed on 16/05/2025.
Although this will reduce ESCT’s size, we believe the agreement with Saba should enable the trust to move forward without this overhang and it remains an attractive vehicle for European small-cap exposure with a strong performance track record. For instance, ESCT has been the top performer over five years in the peer group and also significantly outperformed the MSCI Europe ex UK Small Cap Index over the same period.
Similarly, JPMorgan European Discovery Ord (LSE:JEDT)was confronted with Saba, although the activist investor has not taken any action against the trust and reduced its position in recent weeks, holding just c. 4.55% of JEDT’s voting rights as of (16/05/2025). Nonetheless, the board implemented a tender offer for 15% of shares in September 2024 and has actively bought back shares over the past 12 months—repurchasing c. 33% of the shares in issue (as of 28/05/2025). These measures have supported the share price, and as a result, JEDT has outperformed its open-ended counterpart, JPM Europe Smaller Companies, in terms of both NAV and share price TR.
Unlike ESCT and Janus Henderson European Smaller Companies, there has been no material difference in market capitalisation exposure between JEDT and its open-ended sibling. However, we believe JEDT’s use of gearing has likely contributed to its relative NAV outperformance, which may also explain why the trust outperformed the MSCI Europe ex UK Small Cap Index while its open-ended sibling did not. It is also worth noting that the trust underwent a management change on 01/03/2024 following a strategic review between the board and JPMorgan Asset Management (JPMAM). The new team—Jules Bloch, Jack Featherby, and Jon Ingram—replaced Francesco Conte and Ed Greaves. While the new managers have introduced some nuanced changes to portfolio construction, the trust continues to follow JPMAM’s established value, momentum, and quality investment process.
Starting with an edge
The 2000-01 season perhaps best exemplifies Bayer Leverkusen’s Neverkusen moniker. The team suffered a 2–1 defeat to Real Madrid in the UEFA Champions League final, lost 4–2 to Schalke 04 in the German Cup final, and finished second in the domestic league—just one point behind Borussia Dortmund. If we imagine, for a moment, that Bayer Leverkusen had started those crucial matches or the league season with a goal or point advantage, they might have secured three titles in a single season.
While such a head start is hardly possible in football, investment trusts can offer something comparable. Their discounts can arguably be seen as a built-in advantage over open-ended counterparts, as a narrowing discount can enhance share price performance. Although discounts in the AIC Europe and European Smaller Companies sectors have narrowed over the past five years—as the chart below illustrates—we believe the argument still holds, as all investment trusts in these two sectors continue to trade at discounts. To avoid distortion and ensure consistency, we have used arithmetic averages rather than weighted averages. This approach minimises the outsized influence of larger trusts on the average.
Discounts
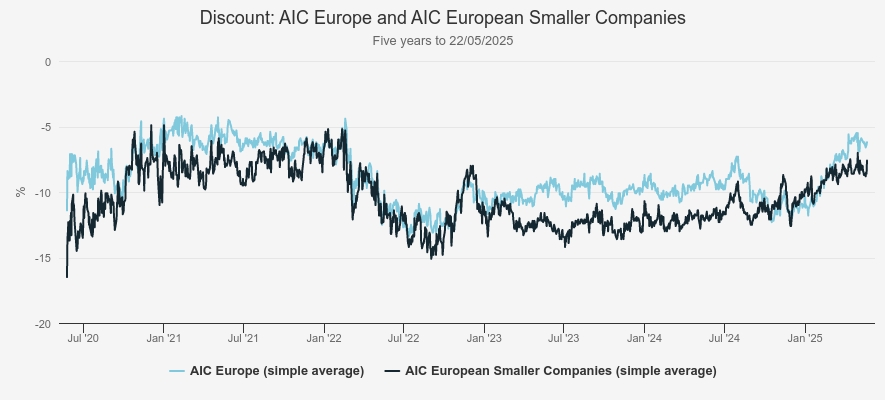
Source: Morningstar
Interestingly, only one trust in each sector is currently trading at a discount wider than their respective sector’s simple average (as of 22/05/2025). In the AIC Europe sector, for example, Baillie Gifford European Growth Ord (LSE:BGEU) trades at a 9.7% discount, compared to the sector’s arithmetic average of 6.2%. The strategy maintains a strong growth bias and a tilt toward mid-cap stocks—an area of the market that has fallen out of favour since 2022, largely due to rising interest rates.
However, the current macroeconomic backdrop in Europe could become increasingly supportive of BGEU’s approach. Notably, Eurozone interest rates were cut to 2.25% in April, and there are expectations that the European Central Bank may need to lower rates below 2%. A lower-rate environment would likely benefit the types of companies BGEU targets. In addition, fiscal stimulus efforts—particularly in Germany, the eurozone’s largest economy—could help boost regional growth. Given these developments, we believe there is a plausible pathway for BGEU’s holdings to come back into favour, potentially driving a narrowing of its discount. The trust’s use of gearing—currently at 13% (as of 30/04/2025)—also adds to its upside potential in a rising market. Taken together, BGEU’s wider discount and leverage suggest it could offer greater upside in a recovery of growth and mid-cap stocks than its open-ended sibling, Baillie Gifford Europe, which it has already outperformed over the past five years.
BGEU: discount
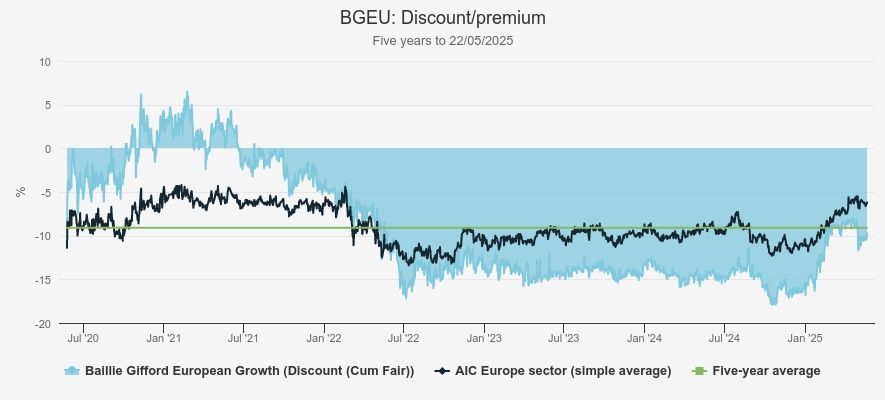
Source: Morningstar
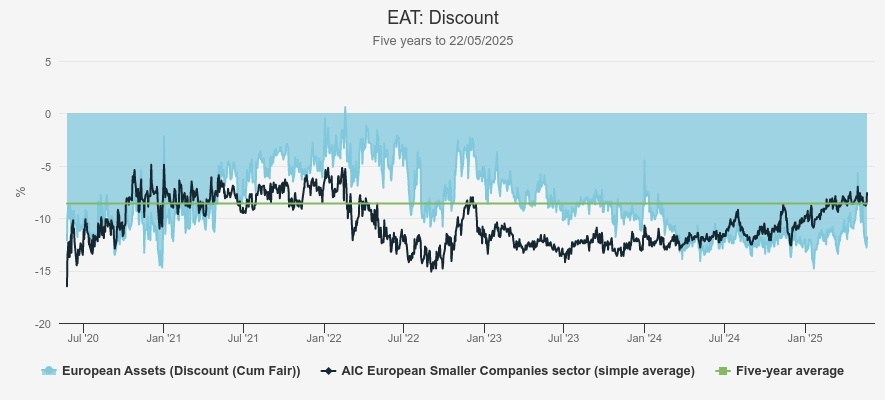
With a discount of 11.8%, European Assets (EAT) is the only investment trust in the AIC European Smaller Companies sector trading below the sector’s average discount of 7.6%. However, it’s important to note that this sector includes just four constituents, and in two cases, discounts have narrowed significantly over the past 12 months partly due to Saba’s involvement. As such, we would argue that EAT’s wider discount is more indicative of the persistently weak investor sentiment toward European smaller companies since 2022. That said, as discussed earlier, we believe the macroeconomic backdrop in Europe could be conducive to a recovery in European small- and mid-cap equities. Furthermore, the strong performance of European large-caps since the beginning of the year has widened the valuation gap between them and the lower tiers of the market, potentially enhancing the appeal of small-cap opportunities. EAT also employs modest gearing, at 3.2% (as of 30/04/2025), which could provide a performance boost in a rising market. As such, we believe EAT could represent a compelling opportunity to gain exposure to a potential recovery in European small-caps—particularly relative to its open-ended counterpart, CT European Smaller Companies. In addition, EAT aims to pay annual dividends equal to 6% of the previous year’s closing NAV, paid from both revenue and distributable reserves—a feature not available in open-ended funds. Based on this policy, we estimate EAT currently offers a prospective yield of 6.4%, the highest in the AIC European Smaller Companies sector and well above the c. 1.2% yield offered by CT European Smaller Companies.
EAT: discount
Source: Morningstar
Conclusion
We think that unique features of the investment trust structure—such as discount narrowing and the use of gearing—have played a significant role in the overall NAV and share price outperformance of closed-ended funds relative to their open-ended counterparts. However, sometimes differences in strategy have had an impact too. For example, ESCT has generally allocated meaningfully more to mid-caps than Janus Henderson European Smaller Companies, while EAT has historically had significant differences in sector exposure compared to CT European Smaller Companies. That said, we looked across a combined peer group of all these trusts and on a concentration, market cap, and turnover basis, couldn’t find any clear difference in how the trusts have been managed versus the open-ended funds. We do think that there is one underlying advantage that trust managers have when managing a portfolio though, and that is that they don’t have to consider outflows. This means they can stay more fully invested over time and don’t have to sell stocks to maintain certain allocations during periods of negative flows.
Looking forward, while discounts have generally narrowed across both the AIC Europe and European Smaller Companies sectors, all trusts in these sectors continue to trade at discounts, offering potential additional returns compared to their open-ended equivalents. In addition, we believe that the widespread use of gearing among constituents —albeit at varying levels—positions investment trusts more favourably than their open-ended counterparts to benefit from a continued recovery of European equities amid an improving outlook for risk assets in the region.
Finally, consensus forecasts (see table below) suggest that European equities could remain attractive, with earnings expected to grow across all market capitalisation segments. Small-caps, in particular, may be particularly compelling at this stage, as they are projected to deliver significantly stronger earnings growth than large-caps through the end of 2027. European small-caps’ earnings growth is expected to be especially potent in the 12 months leading up to the end of 2026, which may result in a near-term recovery. However, small caps tend to be more volatile and may be better suited to risk-seeking investors. More cautious investors might prefer large-caps, which are expected to offer steady—though more moderate—year-on-year earnings growth.
Earnings
| Current year forward eps (in €) | One-year forward eps (in €) | Two-year forward eps (in €) | Forecast growth to the end of 2027 (in €) | |
| EURO STOXX 50 | 347.17 | 377.94 | 409.68 | 18 |
| STOXX Europe Mid 200 | 41.82 | 46.17 | 51.01 | 22 |
| STOXX Europe Small 200 | 24.09 | 31.37 | 34.64 | 44 |
Source: Bloomberg, as of 28/05/2025
Kepler Partners is a third-party supplier and not part of interactive investor. Neither Kepler Partners or interactive investor will be responsible for any losses that may be incurred as a result of a trading idea.
These articles are provided for information purposes only. Occasionally, an opinion about whether to buy or sell a specific investment may be provided by third parties. The content is not intended to be a personal recommendation to buy or sell any financial instrument or product, or to adopt any investment strategy as it is not provided based on an assessment of your investing knowledge and experience, your financial situation or your investment objectives. The value of your investments, and the income derived from them, may go down as well as up. You may not get back all the money that you invest. The investments referred to in this article may not be suitable for all investors, and if in doubt, an investor should seek advice from a qualified investment adviser.
Full performance can be found on the company or index summary page on the interactive investor website. Simply click on the company's or index name highlighted in the article.
Important Information
Kepler Partners is not authorised to make recommendations to Retail Clients. This report is based on factual information only, and is solely for information purposes only and any views contained in it must not be construed as investment or tax advice or a recommendation to buy, sell or take any action in relation to any investment.
This report has been issued by Kepler Partners LLP solely for information purposes only and the views contained in it must not be construed as investment or tax advice or a recommendation to buy, sell or take any action in relation to any investment. If you are unclear about any of the information on this website or its suitability for you, please contact your financial or tax adviser, or an independent financial or tax adviser before making any investment or financial decisions.
The information provided on this website is not intended for distribution to, or use by, any person or entity in any jurisdiction or country where such distribution or use would be contrary to law or regulation or which would subject Kepler Partners LLP to any registration requirement within such jurisdiction or country. Persons who access this information are required to inform themselves and to comply with any such restrictions. In particular, this website is exclusively for non-US Persons. The information in this website is not for distribution to and does not constitute an offer to sell or the solicitation of any offer to buy any securities in the United States of America to or for the benefit of US Persons.
This is a marketing document, should be considered non-independent research and is subject to the rules in COBS 12.3 relating to such research. It has not been prepared in accordance with legal requirements designed to promote the independence of investment research.
No representation or warranty, express or implied, is given by any person as to the accuracy or completeness of the information and no responsibility or liability is accepted for the accuracy or sufficiency of any of the information, for any errors, omissions or misstatements, negligent or otherwise. Any views and opinions, whilst given in good faith, are subject to change without notice.
This is not an official confirmation of terms and is not to be taken as advice to take any action in relation to any investment mentioned herein. Any prices or quotations contained herein are indicative only.
Kepler Partners LLP (including its partners, employees and representatives) or a connected person may have positions in or options on the securities detailed in this report, and may buy, sell or offer to purchase or sell such securities from time to time, but will at all times be subject to restrictions imposed by the firm's internal rules. A copy of the firm's conflict of interest policy is available on request.
Past performance is not necessarily a guide to the future. The value of investments can fall as well as rise and you may get back less than you invested when you decide to sell your investments. It is strongly recommended that Independent financial advice should be taken before entering into any financial transaction.
PLEASE SEE ALSO OUR TERMS AND CONDITIONS
Kepler Partners LLP is a limited liability partnership registered in England and Wales at 9/10 Savile Row, London W1S 3PF with registered number OC334771.
Kepler Partners LLP is authorised and regulated by the Financial Conduct Authority.