Four ‘cheap’ trusts amid the head-turning highs of FTSE 100
With the blue-chip index rising 13.8% over the last 12 months, Kepler Trust Intelligence highlights pockets of opportunity where value is still on offer.
7th June 2024 13:50

This content is provided by Kepler Trust Intelligence, an investment trust focused website for private and professional investors. Kepler Trust Intelligence is a third-party supplier and not part of interactive investor. It is provided for information only and does not constitute a personal recommendation.
Material produced by Kepler Trust Intelligence should be considered a marketing communication, and is not independent research.
The FTSE 100 is often perceived as a home for out-of-favour, downtrodden sectors that have struggled over the last decade. It has trailed other major indices such as the S&P 500 and the Nikkei 225 during this period, largely due to the underwhelming performance of heavyweight sectors such as banking and energy, which have failed to keep pace with the rapid growth of technology stocks.
Moreover, a slew of economic issues and political uncertainty has dampened investor sentiment, amplified by things like the overhang from Brexit and a somewhat revolving door of the country’s political leaders.
- Invest with ii: Trade Investment Trusts | Cashback Offers | Open a Trading Account
However, we think the FTSE 100 has been unfairly maligned. The index is home to a well-diversified list of exciting businesses that have stood the test of time and in cases, have a strong global presence. While it continues to be branded the “Jurassic Park” of indices, the FTSE 100 has defied sceptics of late, surpassing the psychological barrier of 8,000 in mid-April and then reaching an all-time market high of 8,474 in May.
This milestone may have captured the attention of global investors, potentially reigniting their interest in the UK market and the value on offer. As with any stock market rally, though, there are arguments to be made regarding its future.
The FTSE 100 seldom sets new highs, though when it does, history shows us that sizeable market declines have tended to follow, something we detail later. Given the nature and speed of its ascent, questions have therefore risen regarding its sustainability, with the pessimists out there questioning whether current equity valuations are now too high, if the market is approaching bubble territory, or if the so-called equity “discounts” are warranted.
Conversely, the optimists are arguing that the UK market remains attractively priced, both against its own history and international peers, viewing its rise with enthusiasm and proclaiming now is a compelling time to buy.
In this note, we’ll delve into the factors behind the recent surge of the FTSE 100, weighing up the merits of both perspectives to better understand whether we’re in bubble territory or in the presence of an undervalued market that’s ready to let the bull run.
We have lift-off, but what’s driving things?
The UK’s economic outlook has improved in the past year, buoyed by expectations of interest rate cuts, which would be the first since March 2020, and easing tensions in the Middle East. Combined with steadily falling inflation, the UK economy has returned to a state of growth, escaping a shallow recession at the end of 2023 and posting a 0.6% growth in GDP in the first quarter of 2024. UK shares rallied in response.
This may be one factor behind the FTSE 100 Index scaling to fresh highs. While some of the index’s highest sector weights are in internationally facing stocks, the UK banking sector benefits from a strengthening UK economy and the UK banks have done particularly well this year.
Barclays (LSE:BARC), for example, is up over 40% so far this year, benefiting from high rates, as well as boasting a healthy balance sheet and offering investors a good yield. Despite this, it trades at a price-to-earnings ratio (P/E) of around 8x, much lower than its decade average of 14.7x, indicating potential undervaluation.
While there is concern that banks might pull back as rates decline, projections suggest interest rates will remain higher than previously anticipated, providing a tailwind for banks. Moreover, this should also bolster the FTSE 100’s relative performance compared to markets containing fewer sectors that typically thrive in such an environment.
Additionally, lower forecasts for borrowing costs this year have also helped which, in theory, when borrowing becomes less expensive due to falling interest rates, it should discourage people from saving, and in turn stimulate borrowing activity for things such as home purchases and business investments, helping to breathe life back into the economy.
The FTSE 100 has also benefited from a string of robust earnings results in a variety of sectors recently, such as credit data firm Experian (LSE:EXPN), whose shares jumped 7.6% in May after forecasting annual organic revenue growth of 6% to 8% for fiscal year 2025. Similarly, Standard Chartered (LSE:STAN) experienced a share price increase of 8.8% in May following strong first-quarter results. Ultimately, these positive developments have propelled the FTSE 100 index to an all-time high, marking a significant milestone in its 40-year history. Over the last 12 months (to 30/05/2024), the index has delivered returns of 13.8%.
Why the worry?
Having grasped the recent dynamics driving the FTSE 100 ascension, it’s now important to understand why some investors out there are worrying about its sustainability moving forward. As mentioned earlier, the FTSE 100 seldom reaches new highs, but when it does, it has often experienced significant declines shortly after. For example, it peaked at nearly 7,000 in December 1999, only to plummet by approximately 50% during the dot-com crash, and, spoiler alert, it took 15 years to reclaim such levels.
It came close in 2007, reaching 6,700, but this momentum was short-lived as the 2008 financial crisis decimated markets, including the FTSE 100. It bounced back, finally surpassing its December 1999 peak in 2015 by reaching around 7,100. However, this market high was quickly eroded, thanks in part to the “Brexit effect”. The FTSE 100 rose once more, climbing to around 7,900 in 2018, only to face another sharp decline due to the coronavirus pandemic, which played havoc with global markets.
Looking back over the last two decades helps highlight why there are sceptics out there. The FTSE 100 has experienced plenty of volatility over the years, and its future remains relatively uncertain, especially if the UK economy continues to contend with multiple headwinds, including the Brexit overhang, geopolitical tension in the Middle East, Russia, and China, and stubbornly high inflation to name but a few. Consequently, new highs are treated with much suspicion.
How discounted are we talking?
Valuations provide helpful context to the question of whether there is the danger of a pullback. To help decipher this question, we’ll examine various valuation methods, starting with everyone’s favourite, price-to-earnings (P/E). This metric compares the market value of companies to their earnings, offering an indication of how cheap or expensive things are. Currently, the FTSE 100 has a P/E ratio of 11.8x, lower than its average of 13.8x from 2005, implying that it’s technically “undervalued”.
FTSE 100 PRICE-TO-BOOK

Source: Bloomberg (‘2024’ data point as of 30/05/2024)
Additionally, there’s been a significant reduction in leverage within the index, suggesting companies have been reducing debt and bolstering their balance sheets. According to forecasts by Goldman Sachs, the UK market is expected to experience a notable increase in return on equity (ROE) in 2025. Despite currently trailing the average ROE from 2005 to present, this projected rise to 14.0% signals that companies are becoming more profitable.
MARKET METRICS: FTSE 100
| CURRENT RETURN ON EQUITY (%) | AVERAGE | CURRENT NET DEBT/EBITDA (X) | AVERAGE | |
| FTSE 100 Index | 11.3 | 11.8 | 0.7 | 2.8 |
Source: Bloomberg (‘Current’ data point as of 30/05/2024. Average covering period of 31/12/2005 to 30/05/2024).
Despite the FTSE 100 being just 20% higher today than it was in 1999, businesses are now in notably stronger positions, and its price relative to earnings has fallen dramatically, suggesting there could be more room to run. Based on our analysis, one could argue the FTSE 100 index is therefore “undervalued”. However, the challenge lies in pinpointing genuinely attractive, undervalued areas of the market that offer genuine upside potential without inflated price tags, distinguishing them from sectors that are cheap for valid reasons or expensive with limited upside left.
We recently spoke with David Moss of CT UK High Income Ord (LSE:CHI), who noted that over the last decade, some “older industry” heavyweights in the energy and financial sectors have been hit hard, falling out of favour with many investors. However, he currently sees potential value in UK banks, which have rebounded recently, reporting robust results supported by a higher interest rate environment. He highlighted particularly strong performances from Barclays and NatWest Group (LSE:NWG), both seeing their share prices climb around 40% year-to-date. David added NatWest to the portfolio last year after some bad press led to a derating, seeing an opportunity to invest in a company with a strong business model, healthy finances, and a good dividend yield at a more attractive price. In contrast, he believes the consumer staples sector, while seemingly “cheap” in absolute terms with a P/E of 13.2x, is expensive relative to its earnings profile and offers less upside than banks.
In general, UK banks are now in much stronger capital positions compared to the financial crisis, allowing them to better absorb shocks, increase dividends, and return cash to shareholders through buybacks. Despite this recovery, they are currently trading on a P/E of 10.1x, much lower than the ten-year average of 19.6x, suggesting banks could be potential pockets of undervalued opportunities. Furthermore, banks are generally in much stronger positions now compared to 2008, sitting at stronger capital levels and boasting healthier balance sheets, for example. They must now meet more clear-cut capital requirements than they did in 2008, including a common equity tier 1 (CET1) ratio of around 6%. This ratio covers liquid bank holdings such as cash and stock and is a good indicator of banks’ liquidity and capital levels. HSBC Holdings (LSE:HSBA), for example, boasts a CET1 ratio of 14.8% suggesting it has the capability to absorb shocks, grow the loan book, and offer scope for shareholder returns.
Imran Sattar, manager of Edinburgh Investment Trust (LSE:EDIN), also believes that the UK currently offers value at present. In his view, there are many diversified businesses in the UK boasting robust economic moats, proven and transparent management, healthy balance sheets, and promising dividend and capital growth, while sitting at attractive valuations compared to historical standards. Consequently, he has one of the lowest allocations to overseas holdings for the last decade, reflecting the abundance of opportunities he sees on home soil.
Imran's current portfolio is comprised of diversified UK stocks well-positioned to deliver strong total returns. For example, he has increased his position in retailer Dunelm Group (LSE:DNLM) and initiated a new position in Auto Trader Group (LSE:AUTO). Dunelm trades at a forward P/E ratio of 14x earnings, has strong cashflows, 10% annual sales growth over the last decade, and offers a consistent dividend yield of 4%, with the potential for a 4% special dividend on top. AutoTrader, with a 23x forward P/E, expects low teens of EPS growth and benefits from a strong economic moat protecting its earnings, high margins, and a large market share, aligning with Imran’s focus on total returns.
Another way to capitalise on opportunities in UK large caps is through JPMorgan Claverhouse Ord (LSE:JCH). The team is optimistic about the UK, citing an improving domestic economic outlook and historically low valuation levels. They believe UK equities offer an attractive entry point to long-term investors, remaining focussed on investing in high-quality, resilient companies primarily within the FTSE 100 that demonstrate the capabilities of investing capital at high returns to drive strong and maintainable earnings growth. Last year, they purchased Marks & Spencer Group (LSE:MKS) and Rolls-Royce Holdings (LSE:RR.), both of which rebounded with strong operational performance, owing largely to effective management changes that enhanced a focus on streamlining parts of the business and improved capital allocation. Marks & Spencer recently rejoined the FSE 100 after a long slump and continues to perform well.
Charles Luke and Iain Pyle of Murray Income Trust (LSE:MUT)are also taking advantage of UK equity valuations. The managers prioritise an emphasis on quality, blending appealing aspects of both growth and value strategies, seeking companies with strong business models, robust balance sheets, and attractive income profiles. For instance, they view Smurfit Kappa Group (LSE:SKG), a packaging company, as an opportunity, largely owing to the potential upside they see from its proposed acquisition of WestRock Co (NYSE:WRK) (another packaging company).
Based on our analysis, it’s clear that the FTSE 100 is cheap compared to historical levels and unlike some periods in the past, its market rise has been supported by good underlying fundamentals, suggesting that there could still be room to run. Three out of the four trusts we’ve highlighted above are trading at wider discounts than their five-year averages, posing attractive entry points for investors wanting exposure to the UK, in our view. CHI, trading slightly narrower than its average, may also experience a further narrowing of its discount if its performance run persists and the economic outlook strengthens.
TRUST DISCOUNTS OVER FIVE YEARS
| INVESTMENT TRUSTS | CURRENT DISCOUNT (%) | FIVE-YEAR AVERAGE |
| CT UK High Income (CHI) | 6.3 | 7.9 |
| Edinburgh Investment Trust (EDIN) | 10.2 | 9.3 |
| JPMorgan Claverhouse (JCH) | 4.9 | 2.6 |
| Murray Income Trust (MUT) | 10.4 | 6.1 |
| Morningstar Investment Trust UK Equity Income | 6.2 | 3.5 |
Source: Morningstar.
Discount versus international peers
Having now analysed the UK, we have also included a chart below, depicting how the UK's P/E ratio stacks up against various other global markets. Currently, the UK stock market boasts a P/E of 12.5 (specifically, the FTSE 100 has a P/E of 13.9), indicating it’s cheap versus many peers, including Europe and the emerging markets (excluding China), Japan, and China itself. The comparison is even more stark when compared to the US, which boasts a P/E of 25.1.
PRICE-TO-EARNINGS MARKET COMPARISONS
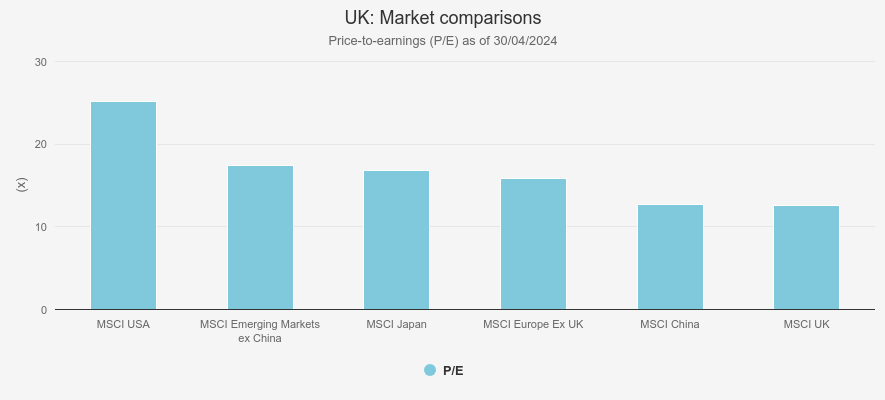
Source: MSCI Factsheet as of 30/04/2024
The UK trades at a steep discount to its international peers, notably the US. Over the years, this trend has been driven largely by the fact investors have increasingly favoured growth stocks (a preference of the US) over value stocks (a typical preference of the UK), drawn by the allure of attractive returns on offer. Additionally, investors have tended to gravitate towards the larger, more liquid stocks in the US which, on average, boast considerably higher market cap than those in the UK or FTSE 100. Consequently, it’s not hard to understand why the UK stock market, with its lack of listed tech offerings, higher exposure to struggling “value” sectors, and smaller average company size, is trading at a discount.
While the narrative of UK undervaluation compared to the US is common, it's essential to consider sector weights when analysing valuation at a macro level. The US market has greater representation in the “expensive” sector of information technology. In contrast, the UK market is more prevalent in “cheaper” sectors such as financials and energy. Naturally, the larger technology firms in the US command higher P/E ratios than big banks in the UK. This difference is illustrated in the table below, which is in order of the most expensive US sectors, highlighting the sector valuation disparity in both the US and the UK.
UK & US SECTOR VALUATIONS
| UK WEIGHTINGS (%) | US WEIGHTINGS (%) | |
| Real Estate | 0.9 | 2.2 |
| Information Technology | 1.0 | 30.6 |
| Healthcare | 12.7 | 12.0 |
| Industrials | 13.6 | 8.5 |
| Consumer Discretionary | 6.9 | 9.9 |
| Consumer Staples | 15.9 | 6.0 |
| Materials | 8.9 | 2.3 |
| Communication services | 2.5 | 9.3 |
| Utilities | 3.8 | 2.5 |
| Financials | 19.3 | 12.9 |
| Energy | 13.2 | 2.9 |
Source: S&P 500 factsheet and iShares FTSE 100 ETF factsheet, as of 30/05/2024
The UK's significant discount to the US can therefore be attributed partly to variations in sector valuations. However, it’s also true that the US competitors may offer better growth or are exposed to more catalysts of growth, even in the cheaper sectors. For example, in the energy sector. Below we show some characteristics of two companies — one from the US and one from the UK: Shell (LSE:SHEL) and Exxon Mobil Corp (NYSE:XOM). Despite Shell trading at a discount compared to its US counterpart, Exxon, the situation is more nuanced than it first appears. Shell offers less growth than Exxon, as evidenced by its lower ROE, a way to measure a corporation's profitability and return on invested capital (ROIC), which measures profitability including debt financing. Additionally, Shell carries higher leverage, indicated by its debt-to-capital ratio. Therefore, the observed discount in Shell’s valuation relative to Exxon may be justifiable considering these factors.
UK & US STOCK COMPARISON
| NAME | P/E (X) | ROE (X) | ROIC (%) | EPS | DEBT TO CAPITAL (%) | MARKET CAP (MIL) GBP |
| Shell PLC | 12.6 | 10.3 | 7.0 | 2.7 | 27.7 | 184,586.8 |
| Exxon Mobil Corp | 14.5 | 16.2 | 13.8 | 8.2 | 13.6 | 417,051.2 |
Source: Morningstar
Conclusion
The FTSE 100's turbulent journey has rightly earned it a reputation as one of the most unloved markets, but we think investors have come to overlook the growth potential and the pockets of opportunity in it.
We’ve established that the FTSE 100 is currently undervalued versus its own history, with pockets of opportunities ready to be capitalised on.
Investors can gain access to these parts of the market through the diversified investment trusts we’ve noted above that are backed by experienced management.
However, we’ve also established that in some cases there are valid reasons why the UK is often discounted, particularly compared to the US. This comes down, in part to the make-up of sectors but also the lower growth profiles of certain companies and the growth catalysts on offer.
Despite this, with the FTSE 100 rising 13.8% over the last 12 months, we think global investors are starting to take notice, potentially signalling a reversal of sentiment towards the once-unloved UK market.
The recent resurgence could mark the beginning of the UK unleashing its bullish potential.
Kepler Partners is a third-party supplier and not part of interactive investor. Neither Kepler Partners or interactive investor will be responsible for any losses that may be incurred as a result of a trading idea.
These articles are provided for information purposes only. Occasionally, an opinion about whether to buy or sell a specific investment may be provided by third parties. The content is not intended to be a personal recommendation to buy or sell any financial instrument or product, or to adopt any investment strategy as it is not provided based on an assessment of your investing knowledge and experience, your financial situation or your investment objectives. The value of your investments, and the income derived from them, may go down as well as up. You may not get back all the money that you invest. The investments referred to in this article may not be suitable for all investors, and if in doubt, an investor should seek advice from a qualified investment adviser.
Full performance can be found on the company or index summary page on the interactive investor website. Simply click on the company's or index name highlighted in the article.
Important Information
Kepler Partners is not authorised to make recommendations to Retail Clients. This report is based on factual information only, and is solely for information purposes only and any views contained in it must not be construed as investment or tax advice or a recommendation to buy, sell or take any action in relation to any investment.
This report has been issued by Kepler Partners LLP solely for information purposes only and the views contained in it must not be construed as investment or tax advice or a recommendation to buy, sell or take any action in relation to any investment. If you are unclear about any of the information on this website or its suitability for you, please contact your financial or tax adviser, or an independent financial or tax adviser before making any investment or financial decisions.
The information provided on this website is not intended for distribution to, or use by, any person or entity in any jurisdiction or country where such distribution or use would be contrary to law or regulation or which would subject Kepler Partners LLP to any registration requirement within such jurisdiction or country. Persons who access this information are required to inform themselves and to comply with any such restrictions. In particular, this website is exclusively for non-US Persons. The information in this website is not for distribution to and does not constitute an offer to sell or the solicitation of any offer to buy any securities in the United States of America to or for the benefit of US Persons.
This is a marketing document, should be considered non-independent research and is subject to the rules in COBS 12.3 relating to such research. It has not been prepared in accordance with legal requirements designed to promote the independence of investment research.
No representation or warranty, express or implied, is given by any person as to the accuracy or completeness of the information and no responsibility or liability is accepted for the accuracy or sufficiency of any of the information, for any errors, omissions or misstatements, negligent or otherwise. Any views and opinions, whilst given in good faith, are subject to change without notice.
This is not an official confirmation of terms and is not to be taken as advice to take any action in relation to any investment mentioned herein. Any prices or quotations contained herein are indicative only.
Kepler Partners LLP (including its partners, employees and representatives) or a connected person may have positions in or options on the securities detailed in this report, and may buy, sell or offer to purchase or sell such securities from time to time, but will at all times be subject to restrictions imposed by the firm's internal rules. A copy of the firm's conflict of interest policy is available on request.
Past performance is not necessarily a guide to the future. The value of investments can fall as well as rise and you may get back less than you invested when you decide to sell your investments. It is strongly recommended that Independent financial advice should be taken before entering into any financial transaction.
PLEASE SEE ALSO OUR TERMS AND CONDITIONS
Kepler Partners LLP is a limited liability partnership registered in England and Wales at 9/10 Savile Row, London W1S 3PF with registered number OC334771.
Kepler Partners LLP is authorised and regulated by the Financial Conduct Authority.