How investment trusts could help you enjoy a rich retirement
A Kepler analyst considers portfolio construction in retirement planning and examines three strategies.
22nd March 2024 14:04

This content is provided by Kepler Trust Intelligence, an investment trust focused website for private and professional investors. Kepler Trust Intelligence is a third-party supplier and not part of interactive investor. It is provided for information only and does not constitute a personal recommendation.
Material produced by Kepler Trust Intelligence should be considered a marketing communication, and is not independent research.
Wealth managers and financial advisers have been put under the cosh in recent years. Like – dare we suggest – every successful industry in the United Kingdom, it finds itself widely resented. We won’t seek to continue our unsolicited psychiatric treatment of the British patient, but we want rather to consider how difficult and valuable is one of the key services this industry provides: retirement planning.
Hopefully, we haven’t lost too many readers! “Retirement planning”, what an exciting phrase, full of promise and joy. Who doesn’t want to think about getting older and less capable, and how they will fund their retirement home? Who doesn’t want to tinker with spreadsheets and track expenses and income? What a thoroughly boring and unpleasant task, but unfortunately, really quite important. It is also a little more complicated than we might like.
Below, we consider some of the complexities of building a portfolio for retirement, which self-directed investors and advisers will all have to consider and introduce three funds presenting at our event next week.
Long-term investors can’t forget about risk
There are a few rules of thumb that investors probably follow: a key one would be to invest in equities when you are young and gradually shift into bonds as you age. An easy assumption would be that there is no need to bother with bonds or cash when you are starting your pension, as volatility doesn’t matter with a long-term time horizon and all you want to do is maximise return.
However, this overlooks the problem of sequencing risk. Anyone thinking about investing more in the hot topic of the day, AI, will probably be considering this. An investment can deliver 10% a year over the long run but still leave most investors who buy it underwater if massive gains have been made early in the story, followed by a massive sell-off. Put simply, an average return of 10% a year from an investment with high volatility can include some very big losses and very big gains, and the order you experience those gains can make a massive difference to your returns, even over the very long term.
We can use a Monte Carlo simulation to see how this works. This involves calculating hundreds of possible sequences of returns with the same average return and the same volatility. We can then look at the chances of getting results of a certain magnitude.
Let’s consider biotech, one of the sectors which tends to deliver very high long-term returns, but with some very high volatility. The table below shows the result of such an analysis on the Nasdaq Biotechnology Index. We have assumed a £50,000 initial investment, with £5,000 added each year for 20 years. We have used the average return and volatility over the past 20 years for the index and calculated 1,000 iterations. The mean size of the pot at the end is an impressive £756,509.
However, in 5% of cases, the investor ended up with a retirement fund of £151,522 or less. In 1% of cases, there was just £86,289 left. Considering £50,000 was invested at the start and £100,000 put in over the years, this is more than a little disappointing, and means in 5% of possible worlds no investment gains have been made at all, compared to a gain of 14.8% in the mean case.
These are nominal returns, of course, so take 20 years of inflation off both. We can therefore say that investing in a high-risk, high volatility portfolio leaves investors open to significant risk of financial harm. In other words, forget the caravan, and it will be supermarket-brand frozen waffles every day – at best – if you end up in one of the unlucky possible futures.
MONTE CARLO ANALYSIS: NASDAQ BIOTECHNOLOGY INDEX
| INPUTS | |
| Current investment | £50,000 |
| Average return | 11.3% |
| St Dev of return | 22.7% |
| Time to retire | 20 |
| Amount invested annually | £5,000 |
| OUTPUTS | |
| Mean outcome | £756,509 |
| Median outcome | £535,065 |
| St Dev of possible outcomes | £776,451 |
| Worst 5% | £151,522 |
| Worst 1% | £86,289 |
Source: FE Analytics, Kepler calculations. Past performance is not a reliable indicator of future results.
For this reason, we think investors need to be attentive to the risk in their investments even at an early age. It is certainly true that you have more time to make back your losses, but you also have more time to make other bad decisions, and in sticking all your wealth in the hot topic of the day you already have a track record of bad judgement.
Paul Major and Brett Darke, managers of Bellevue Healthcare Ord (LSE:BBH), argue that the broader healthcare industry is benefiting from a number of long-term secular trends, and in the Tuesday slot at our event next week, they will discuss their thesis on what is going to drive innovation in the industry over the coming years. BBH does invest in some biotechs, but has a broader remit, which is one way of moderating the risk in investing in the space and could reduce the volatility of returns. Mid-cap growth has sold off in the healthcare space over the past two years, as it has in broader indices, which means we think BBH could be an interesting rate-sensitive recovery play ahead of expected rate cuts this year, while it has the potential to deliver high long-term returns.
Income isn’t just for retirement
Equity income could easily be thought of as a sector for those in drawdown, or those looking to de-risk as they get near to that point. However, we think it could play a valuable role in a portfolio at any stage of the investment journey. Below we show the cumulative relative returns of the IA UK Equity Income sector versus the iShares ETF tracking the FTSE All Share Index. An upward-sloping line indicates a period of outperformance and vice-versa.
RELATIVE PERFORMANCE OF EQUITY INCOME
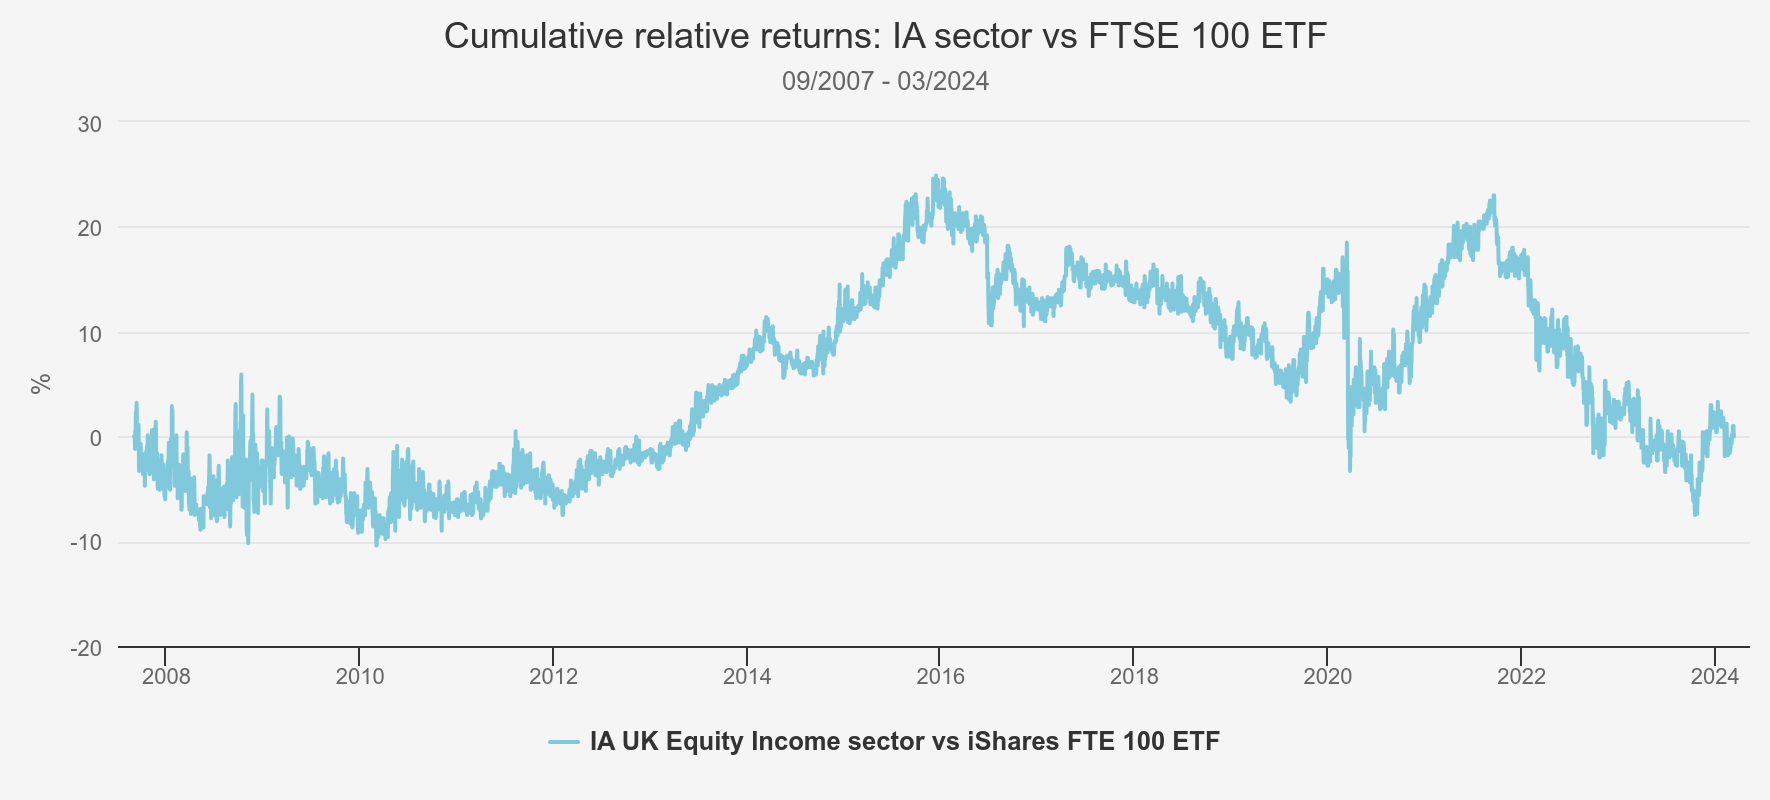
Source: FE Analytics. Past performance is not a reliable indicator of future results
Notably, the strategy has had a rough time since early 2016, having performed extremely well in the aftermath of the financial crisis. We think one factor is that active managers in the sector tend to overweight the mid-caps. This segment of the market has struggled since the Brexit referendum. We think this is likely due to it being seen as a proxy for the domestic UK economy – even though circa 50% of revenues on the 250 come from overseas – and investors being wary of the UK’s growth potential and political instability in recent years. An additional factor is likely to be the de-rating of dividend stocks in the light of a higher base rate and a stylistic preference for growth stocks.
We think equity income could play a role in a long-term growth portfolio. We calculated the return and volatility of a portfolio with 50% in the Nasdaq Biotechnology Index and 50% in the IA UK Equity Income sector, based on data from the last 20 years. As the below table shows, the mean expected return from a 20-year run was much lower than an investment in the Nasdaq Biotechnology Index. However, the gap between the median returns was much smaller, highlighting that the higher mean return reflects a small number of exceptionally good outcomes. Additionally, the diversified portfolio saw much better performances in the worst possible outcomes and increased the chances that a few more baked bean dinners could see you with enough left over to fund the cat home.
RESULTS OF MONTE CARLO SIMULATIONS
| NASDAQ | 50/50 | |
| Mean outcome | £756,509 | £523,883 |
| Median outcome | £535,065 | £436,677 |
| St Dev of possible outcomes | £776,451 | £340,284 |
| Worst 5% | £151,522 | £201,765 |
| Worst 1% | £86,289 | £123,107 |
Source: FE Analytics, Kepler calculations. Past performance is not a reliable indicator of future results
Looking forward, we think there is the potential for equity income to embark on a new cycle of outperformance. Notable the last one came after rates had been slashed to record lows. Lower rates would definitely raise the attraction of equity income, and it would highlight the fact that investing in bonds in a period of falling yields leaves a lower and lower income, compensated for by rising prices. Selling bonds for a gain and reinvesting in yielding equities could become a popular move. Another helpful factor would be an improvement in sentiment towards the UK economy. Sentiment has been so bad for so long that we think a reversal is due. A change of government might be the excuse investors need to turn the page on the last eight years, particularly if it coincides with an economy clearly out of the other side of a recession.
CT UK Capital and Income Ord (LSE:CTUK)could be one trust to benefit. CTUK has been managed by Julian Cane for over 25 years, and he will be presenting on his strategy at our event next Wednesday. Julian seeks companies further down the market-cap scale that may have a lower yield but offer stronger dividend growth prospects. This flexibility allows him to balance businesses offering a mix of more sustainable yields and attractive dividend growth potential which, over time, has contributed significantly to CTUK’s 30 consecutive years of dividend growth.
Alternatives aren’t just bond proxies
The Bank of England cut interest rates to 0.25% in March 2009. While there was a brief attempt to raise rates in 2019, it was only in April 2022 that they were decisively raised higher than this. Thirteen years of rock-bottom rates on government bonds left a lot of income-seeking investors looking for an alternative. Plenty of money went into equity income, but while this can generate an income, it is by definition very correlated to equity markets. This dynamic was a major reason for the extraordinary growth in the alternative space. The investment trust sector drew a lot of capital to invest in alts, with the closed-ended structure being well-suited to the illiquidity involved and allowing managers to gear up to build their portfolios and generate attractive yields.
BANK OF ENGLAND BASE RATE
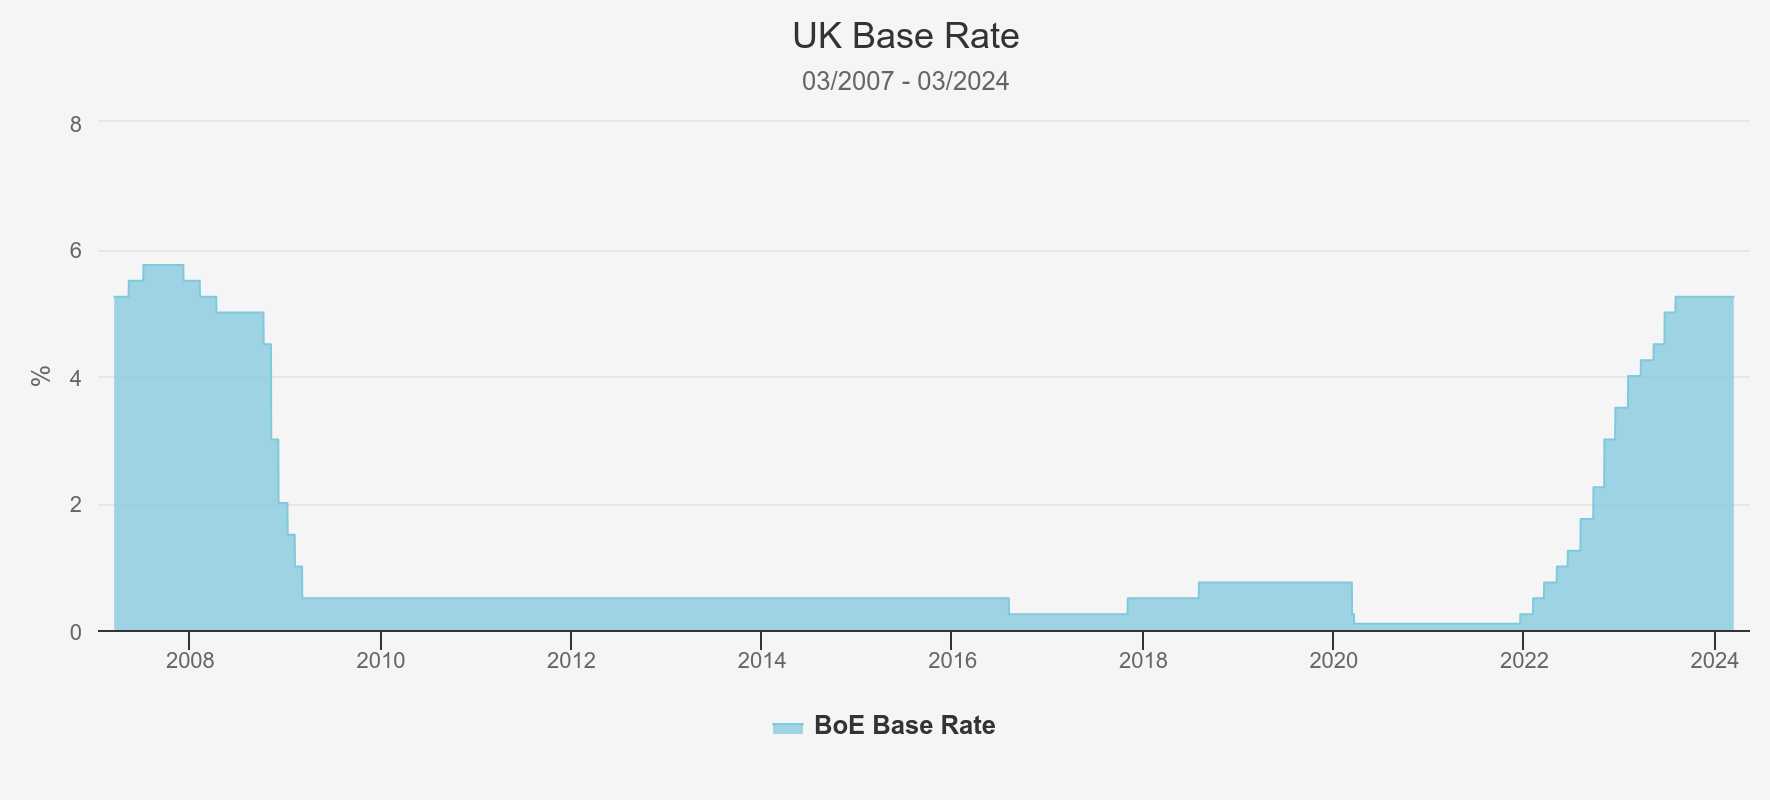
Source: Bloomberg
Alternatives are a broad category, and what we are discussing is those that invest in illiquid asset classes with high yields – i.e. private equity and hedge funds are not included. These are therefore chiefly portfolios of privately held infrastructure and renewable infrastructure assets. It is common to hear talk of these as bond proxies, and it is certainly true that they attracted plenty of capital that left low-yielding bond markets. In the light of higher interest rates, prices have adjusted to ensure yields are higher than bonds. In this way, they have proven to be somewhat correlated to bonds, which have also seen prices fall as interest rates have risen. But the numbers suggest this has not been as pronounced as might have been feared, and some alternatives at least have done a good job of offering diversification during a difficult period.
Below we show the share price returns of BBH, CTUK and Greencoat UK Wind (LSE:UKW), along with total returns to the FTSE Gilt Index. Returns are shown from the inception point of BBH. The magnitude of losses in gilts is clear, and it can be seen that while volatility has been evident in UKW’s share price, it has protected better than the gilt index. It also made considerably more money in the good years, with the NAV being driven by much more than interest rates.
SHARE PRICE RETURNS SINCE DECEMBER 2016
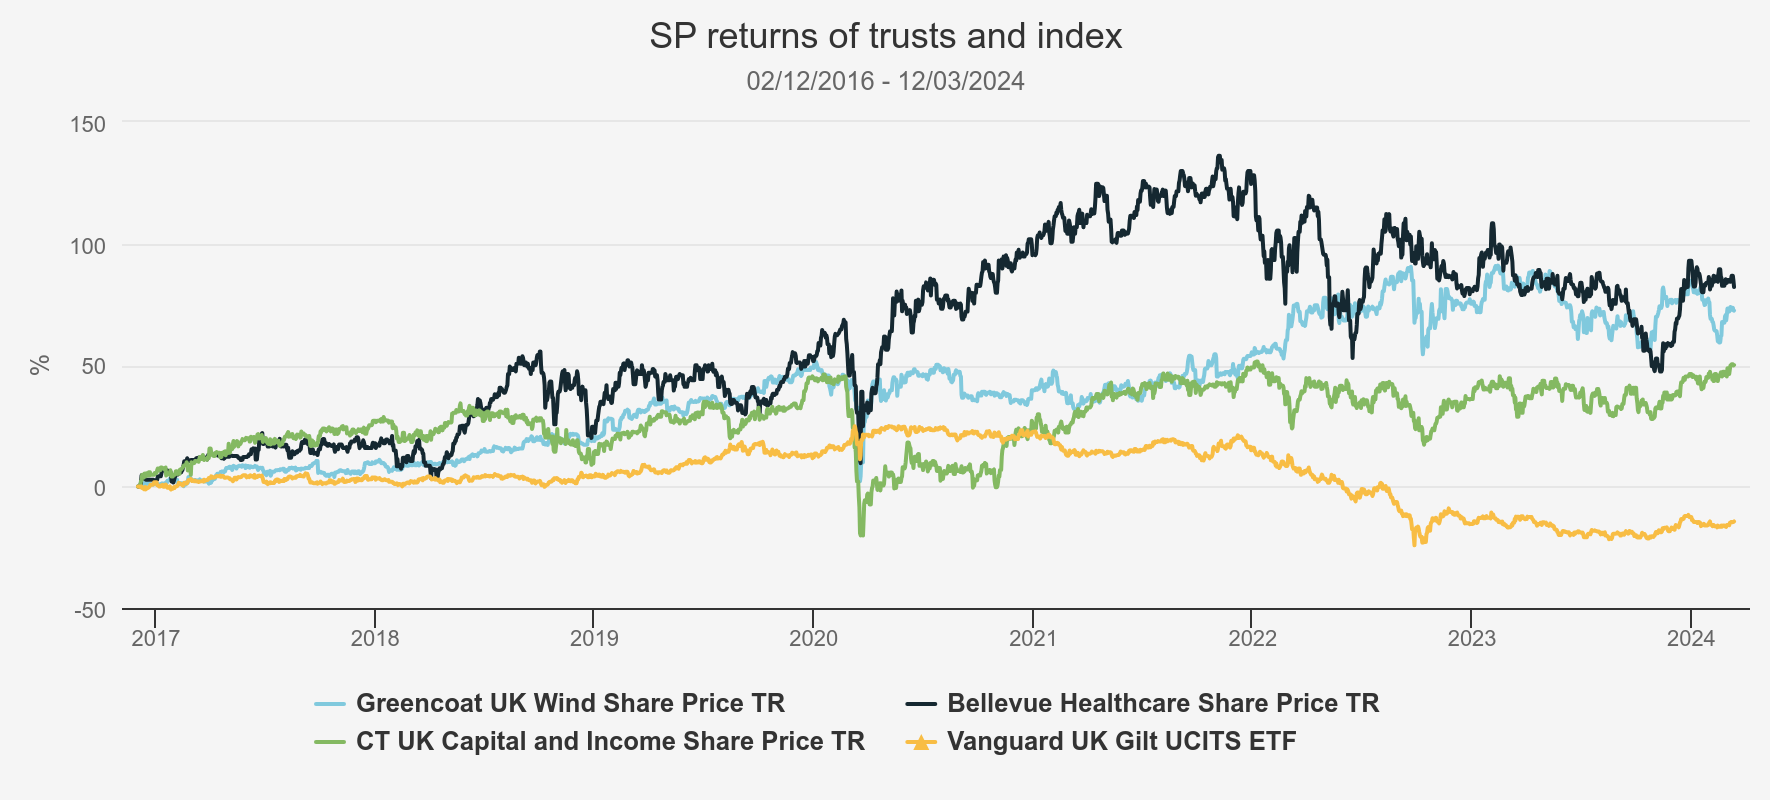
Source: Morningstar. Past performance is not a reliable indicator of future results.
We have used share price returns as one of the criticisms that can be levelled at investment trusts is that as the shares are traded on equity exchanges, lots of the correlation benefits in the NAV values are lost. There is something to this point, although it misses the fact that NAVs are estimates, so other vehicles which don’t have a daily pricing point are likely to misrepresent what the market value of a portfolio would be on a daily basis. But in fact, when we look at the historical correlation figures of share prices, not the NAV, UKW has actually displayed a low correlation to both equity and bond indices. The table below looks over five years so we can show BBH, and it shows a very low correlation of 0.26 between the share price returns of UKW and CTUK, which owns a broad portfolio of UK equities. The correlation to the gilts index is even lower, at just 0.16. This uses daily pricing and implies that just 2.6% of the variation in UKW’s daily share price returns is explained by movements in the gilt index (this is the r-squared). Looking back over 10 years, the picture is much the same, with numbers of 0.21 and 0.18 respectively.
5YR CORRELATION
| BBH | CTUK | UK GILTS | UKWE | |
| BBH | 0.52 | 0.22 | 0.28 | |
| CTUK | 0.52 | 0.09 | 0.26 | |
| UK Gilts | 0.22 | 0.09 | 0.16 | |
| UKW | 0.28 | 0.26 | 0.16 |
Source: FE Analytics. Past performance is not a reliable indicator of future results
We show below how this diversification benefit could have played out in a portfolio. We have equally weighted UKW, CTUK, and the Nasdaq Biotechnology Index (BBH does not have a 10-year track record, and the index is a purer example of the high-risk strategy we wanted to consider). To us, this shows that alternatives have the potential to significantly improve risk-adjusted returns and are more than just bond proxies. The substantially lower vol achieved by mixing in UKW means that while the median return is little changed from our 50/50 portfolio, the worst outcomes are substantially better. That said, a falling interest rate environment would undoubtedly be constructive for the sector.
RESULTS OF MONTE CARLO SIMULATIONS
| NASDAQ | 50/50 | 33/33/33 | |
| Mean outcome | £756,509 | £523,883 | £439,505 |
| Median outcome | £535,065 | £436,677 | £427,869 |
| St Dev of possible outcomes | £776,451 | £340,284 | £101,115 |
| Worst 5% | £151,522 | £201,765 | £297,920 |
| Worst 1% | £86,289 | £123,107 | £259,797 |
Source: FE Analytics. Past performance is not a reliable indicator of future results
Conclusion
Some of our readers will be intimately aware that a wealth manager’s job is not an easy one. We have talked through a number of considerations that go into creating a long-term portfolio. It is not a simple task and can soon become quite complex. And as much as we can use complicated quants to help us, the sad truth is that volatilities and correlations can change over time, so permanent vigilance is required.
Our event next week has retirement as its theme, with the idea being that for those with a long-term investment plan, growth strategies such as BBH will appeal, while those who are nearing drawdown might be looking for something like CTUK to add in, and those even further on will be looking to de-risk and focus on yield. But we hope we have shown that all three strategies, and those like them, could be useful additions to a portfolio at any stage of an investment career. While blending them may decrease the chance of retirement in Monaco, it could also decrease the chances it will be spent in a caravan near Cromer. (Having grown up near there, your author feels entitled to make this joke.)
Kepler Partners is a third-party supplier and not part of interactive investor. Neither Kepler Partners or interactive investor will be responsible for any losses that may be incurred as a result of a trading idea.
These articles are provided for information purposes only. Occasionally, an opinion about whether to buy or sell a specific investment may be provided by third parties. The content is not intended to be a personal recommendation to buy or sell any financial instrument or product, or to adopt any investment strategy as it is not provided based on an assessment of your investing knowledge and experience, your financial situation or your investment objectives. The value of your investments, and the income derived from them, may go down as well as up. You may not get back all the money that you invest. The investments referred to in this article may not be suitable for all investors, and if in doubt, an investor should seek advice from a qualified investment adviser.
Full performance can be found on the company or index summary page on the interactive investor website. Simply click on the company's or index name highlighted in the article.
Important Information
Kepler Partners is not authorised to make recommendations to Retail Clients. This report is based on factual information only, and is solely for information purposes only and any views contained in it must not be construed as investment or tax advice or a recommendation to buy, sell or take any action in relation to any investment.
This report has been issued by Kepler Partners LLP solely for information purposes only and the views contained in it must not be construed as investment or tax advice or a recommendation to buy, sell or take any action in relation to any investment. If you are unclear about any of the information on this website or its suitability for you, please contact your financial or tax adviser, or an independent financial or tax adviser before making any investment or financial decisions.
The information provided on this website is not intended for distribution to, or use by, any person or entity in any jurisdiction or country where such distribution or use would be contrary to law or regulation or which would subject Kepler Partners LLP to any registration requirement within such jurisdiction or country. Persons who access this information are required to inform themselves and to comply with any such restrictions. In particular, this website is exclusively for non-US Persons. The information in this website is not for distribution to and does not constitute an offer to sell or the solicitation of any offer to buy any securities in the United States of America to or for the benefit of US Persons.
This is a marketing document, should be considered non-independent research and is subject to the rules in COBS 12.3 relating to such research. It has not been prepared in accordance with legal requirements designed to promote the independence of investment research.
No representation or warranty, express or implied, is given by any person as to the accuracy or completeness of the information and no responsibility or liability is accepted for the accuracy or sufficiency of any of the information, for any errors, omissions or misstatements, negligent or otherwise. Any views and opinions, whilst given in good faith, are subject to change without notice.
This is not an official confirmation of terms and is not to be taken as advice to take any action in relation to any investment mentioned herein. Any prices or quotations contained herein are indicative only.
Kepler Partners LLP (including its partners, employees and representatives) or a connected person may have positions in or options on the securities detailed in this report, and may buy, sell or offer to purchase or sell such securities from time to time, but will at all times be subject to restrictions imposed by the firm's internal rules. A copy of the firm's conflict of interest policy is available on request.
Past performance is not necessarily a guide to the future. The value of investments can fall as well as rise and you may get back less than you invested when you decide to sell your investments. It is strongly recommended that Independent financial advice should be taken before entering into any financial transaction.
PLEASE SEE ALSO OUR TERMS AND CONDITIONS
Kepler Partners LLP is a limited liability partnership registered in England and Wales at 9/10 Savile Row, London W1S 3PF with registered number OC334771.
Kepler Partners LLP is authorised and regulated by the Financial Conduct Authority.