ii investment review: Q2 2021
There were significant shifts in stock markets last quarter, and other assets have moved wildly too.
9th July 2021 15:56
by Dzmitry Lipski from interactive investor
There were significant shifts in global stock markets last quarter, and other assets have moved wildly too.

Market round-up
Global markets made further gains in the second quarter as the global roll out of Covid-19 vaccines and government support continued to boost investor optimism for a global economic recovery in 2021. Concerns about inflation and US rate hikes are still on investors' minds and could contribute to market volatility going forward. Broad commodities were the best performing asset class over the three months, mainly due to strong growth in energy prices. Developed market outperformed emerging markets as emerging economies continued to lag on the vaccination front. Corporate bonds outperformed government bonds.
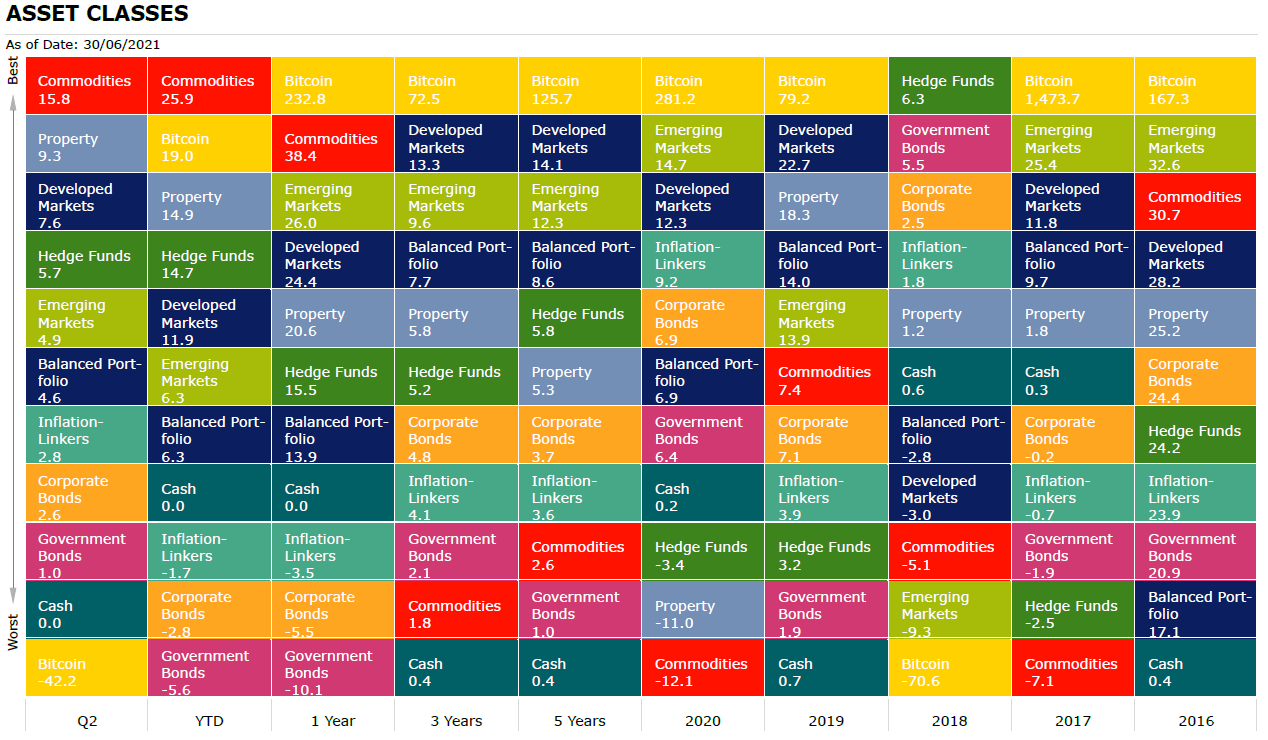
Source: Morningstar Total returns in sterling
Shares
UK equities performed well over the quarter as cyclical and economically sensitive sectors continue to recover since November.
UK smaller companies have outperformed larger counterparts as they're typically more domestically oriented and benefited from stronger sterling. Negative sentiment toward UK equities, particularly since the EU referendum in 2016, has presented a great buying opportunity.
- Top 20 most-bought UK shares in Q2 2021
- Top 20 most-bought US stocks so far this year
- Want to buy and sell international shares? It’s easy to do. Here’s how
Economic strength was encouraging – GDP grew 2.3% over April, its fastest rise since July 2020. The month’s growth more than offset the 1.5% contraction seen over the first quarter of this year. In June, Fitch Ratings revised the UK outlook to stable from negative. it argues that macro data improvements since the start of 2021 have shown the UK economy and public finances to be more resilient to the impact of the pandemic shock.
European equities ended positive, supported by a strong corporate earnings season and an acceleration in the pace of vaccine rollout in the region. According to the OECD’s latest forecasts, Europe’s economy will bounce back from the pandemic less strongly than the US and the UK this year. Economic growth in the eurozone is expected to be around 4.3% in 2021, compared with 6.9% in the US.
US equities delivered strong returns of more than 8%, with the S&P 500 reaching a new all-time high in late June. Growth stocks continued to regain ground, supported by stronger earnings growth in Q1 and more fiscal stimulus as Joe Biden reached a deal to boost infrastructure spending by $600 billion. Tech giants such as Apple (NASDAQ:AAPL), Alphabet (NASDAQ:GOOGL) and Microsoft (NASDAQ:MSFT) delivered strong returns over the quarter.
Emerging market equities posted good returns over the second quarter, despite a sell-off in May as higher-than-expected US inflation renewed concerns over the timing of global monetary policy tightening. Brazil and Russia were the best performing markets, returning almost 23% and 14% respectively. Brazil's returns, displayed below in sterling terms, benefited from a partial recovery in the value of the Brazilian Real during the quarter.
Performance (%) | |||||
Stock market | Q2 | YTD | 1 Year | 3 Years | 5 Years |
Brazil | 22.8 | 9.5 | 31.1 | 9.2 | 9.0 |
Russia | 13.9 | 18.4 | 24.0 | 13.5 | 15.6 |
FTSE Small Cap | 9.0 | 19.4 | 50.1 | 10.8 | 13.6 |
S&P 500 | 8.4 | 14.0 | 25.9 | 16.9 | 16.9 |
Europe Ex UK | 7.7 | 10.4 | 21.8 | 9.3 | 11.2 |
World | 7.6 | 11.9 | 24.4 | 13.3 | 14.1 |
India | 6.8 | 11.2 | 39.9 | 10.2 | 11.1 |
FTSE 100 | 5.7 | 10.9 | 18.0 | 1.1 | 5.6 |
FTSE All Share | 5.6 | 11.1 | 21.5 | 2.0 | 6.5 |
Emerging Markets | 4.9 | 6.3 | 26.0 | 9.6 | 12.3 |
FTSE 250 | 4.7 | 10.3 | 33.4 | 4.9 | 9.3 |
Asia Pacific Ex Japan | 3.9 | 5.7 | 24.6 | 10.2 | 13.2 |
China | 2.1 | 0.8 | 13.9 | 8.7 | 15.8 |
TOPIX Japan | -0.9 | 0.2 | 10.7 | 4.7 | 9.3 |
Source: Morningstar. *MSCI. Total returns in sterling
Sectors
“Vaccine day” on 9 November 2020 marked a turning point for cyclically sensitive stocks in the financial, energy and industrials. But growth sectors such as technology and healthcare equities still looking strong and outperformed over the quarter.
Performance (%) | |||||
Sector | Q2 | YTD | 1 Years | 3 Years | 5 Years |
Information Technology | 11.4 | 11.9 | 27.7 | 26.8 | 28.8 |
Real Estate | 10.0 | 15.6 | 15.9 | 7.2 | 6.1 |
Communication Services | 9.1 | 15.4 | 30.6 | 19.8 | 10.1 |
Health Care | 9.0 | 8.8 | 10.1 | 14.1 | 11.6 |
Energy | 8.6 | 31.0 | 26.1 | -8.6 | -1.2 |
Financials | 6.5 | 19.4 | 36.3 | 7.6 | 12.2 |
Consumer Discretionary | 6.3 | 9.1 | 32.9 | 17.6 | 18.5 |
Consumer Staples | 5.7 | 4.1 | 7.7 | 8.4 | 5.9 |
Materials | 5.2 | 10.1 | 28.8 | 10.4 | 14.0 |
Industrials | 4.0 | 11.0 | 29.3 | 10.8 | 12.5 |
Utilities | -0.8 | -1.3 | 2.1 | 7.4 | 6.1 |
Bonds
Bonds also delivered positive returns over the quarter. Corporate bonds outperformed government bonds as investors searched for yield and inflation hedges against a backdrop of low government bond yields and higher inflation. As a result, high yield and inflation linked bonds outperformed over the period.
Performance (%) | |||||
Bond | Q2 | YTD | 1 Year | 3 Years | 5 Years |
UK Inflation Linked | 3.6 | -3.0 | -4.0 | 5.0 | 4.7 |
Global Inflation Linked | 2.8 | -1.7 | -3.5 | 4.1 | 3.6 |
Global Corporate | 2.6 | -2.8 | -5.5 | 4.8 | 3.7 |
Global High Yield | 2.4 | 1.4 | 3.4 | 5.7 | 6.5 |
Sterling Corporate | 1.7 | -2.5 | 1.8 | 4.7 | 4.1 |
UK Gilts | 1.7 | -5.7 | -6.2 | 3.0 | 2.0 |
Global Aggregate | 1.2 | -4.2 | -8.2 | 2.7 | 1.7 |
EURO Corporate | 1.1 | -4.6 | -2.3 | 1.6 | 2.7 |
Global Government | 1.0 | -5.6 | -10.1 | 2.1 | 1.0 |
Commodities and alternative investments
Commodities rallied, with oil up 18% for the quarter. There is improved sentiment towards the asset class on the back of structural long-term trends. These include economic recovery from the pandemic and inflation fears, along with infrastructure spending and hence higher demand for materials. Oil prices hit levels not seen since late 2018 as demand returned and members of the OPEC oil cartel argue about supply. Property also had as strong quarter on the back of improving consumer confidence and economy reopening.
Performance (%) | |||||
Investments | Q2 | YTD | 1 Year | 3 Years | 5 Years |
Brent Crude Oil | 18.1 | 43.5 | 63.3 | -3.3 | 7.9 |
Commodities | 15.8 | 25.9 | 38.4 | 1.8 | 2.6 |
UK REITs | 7.3 | 10.7 | 22.7 | 1.6 | 4.7 |
Global Natural Resources | 7.1 | 18.7 | 33.6 | 4.5 | 10.7 |
Hedge Funds | 5.7 | 14.7 | 15.5 | 5.2 | 5.8 |
Gold | 4.2 | -8.0 | -11.2 | 10.3 | 5.3 |
Global Infrastructure | 2.2 | 4.3 | 10.2 | 4.0 | 5.5 |
Cash | 0.0 | 0.0 | 0.0 | 0.4 | 0.4 |
CBOE Market Volatility (VIX) | -18.5 | -31.1 | -53.5 | -2.0 | -0.4 |
Most-traded shares on the ii platform in Q2 2021
These articles are provided for information purposes only. Occasionally, an opinion about whether to buy or sell a specific investment may be provided by third parties. The content is not intended to be a personal recommendation to buy or sell any financial instrument or product, or to adopt any investment strategy as it is not provided based on an assessment of your investing knowledge and experience, your financial situation or your investment objectives. The value of your investments, and the income derived from them, may go down as well as up. You may not get back all the money that you invest. The investments referred to in this article may not be suitable for all investors, and if in doubt, an investor should seek advice from a qualified investment adviser.
Full performance can be found on the company or index summary page on the interactive investor website. Simply click on the company's or index name highlighted in the article.