Investment trusts: doing small things in a great way
18th February 2022 14:00
Kepler research suggests closed-ended funds are a superior way for investors to gain exposure to small companies.

This content is provided by Kepler Trust Intelligence, an investment trust focused website for private and professional investors. Kepler Trust Intelligence is a third-party supplier and not part of interactive investor. It is provided for information only and does not constitute a personal recommendation.
Material produced by Kepler Trust Intelligence should be considered a marketing communication, and is not independent research.
The conventional wisdom surrounding investment trusts is that their closed-ended structure offers clear advantages for small-cap investing, primarily via the nature of how they are traded. The closed-ended structure frees their investment managers from the painful requirements of daily liquidity, with small-cap companies often being thinly traded at the best of times.
In theory, this should mean that investment trust managers can afford to look further down the market-cap space, as well as having the option to run a more concentrated portfolio because they are able to take chunkier positions in smaller companies. But to what extent do small-cap investment trust managers actually utilise the closed-ended structure, relative to their open-ended peers?
Concentration
One of the major drawbacks of conventional small-cap investing is the need for a large number of holdings. Numerous holdings are required to both diversify the substantial idiosyncratic risks of small companies and ensure that sufficient liquidity is available to meet daily redemptions, with a greater amount of smaller position sizes being easier to sell out of than a handful of sizeable holdings. Thankfully, investment trusts need only trade their shares to ensure liquidity, with daily liquidity considerations being less of a concern for their investment managers.
AVERAGE HOLDINGS BY PEER GROUP
| AVERAGE NUMBER OF HOLDINGS | STANDARD DEVIATION | MEDIAN | MAXIMUM | MINIMUM | |
| Investment trusts | 65.2 | 39.7 | 61.0 | 144.0 | 10.0 |
| Open-ended funds | 86.6 | 49.7 | 79.0 | 357.0 | 36.0 |
Source: Morningstar
It is clear from the above table that on average investment trust managers make full use of their closed-ended structure when constructing their small-cap portfolios. Not only are their portfolios more concentrated, but they are more consistent in their concentration, as shown by their lower standard deviation and the lower range between the maximum and minimum number of holdings. abrdn Smaller Companies (LSE:ASCI) is an example of a ‘conventional’ small-cap strategy in terms of the market cap it invests in, and with a mere 52 holdings is still more concentrated than its average open-ended peer.
Managed by Abby Glennie and Amanda Yeaman, the trust aims to not only benefit from the inherent growth potential of small caps, but to also provide a high and growing dividend, with its 2.6% yield being considerably higher than that of the rest of the sector. Yet despite its income objective, ASCI has still outperformed its peers and benchmark over the last three years (with the current team having run the trust since September 2018).
Size
Morningstar conveniently classifies a strategy’s holdings into various size categories relative to its region’s market cap, and in the case of our analysis we are concerned with a strategy’s exposure to mid-, small- and micro-cap companies. As the below table shows, investment trusts actually display a larger average market cap than open-ended funds, even if the difference is not huge.
AVERAGE MARKET CAP (£M)
| AVERAGE MARKET CAP | STANDARD DEVIATION | MEDIAN | MAXIMUM | MINIMUM | |
| Investment trusts | 724.1 | 476.7 | 711.4 | 1523.2 | 7.6 |
| Open-ended funds | 675.5 | 433.9 | 660.5 | 2339.1 | 105.1 |
Source: Morningstar, as at 31/12/2021
The slightly larger average market cap of investment trusts seems to be thanks to a slightly higher allocation to mid- and large-cap companies at the sector level. However, there is a far greater range and variety of market caps within the investment trust sector: three trusts have an average market cap of less than £100m, while there are other much larger trusts with a larger average market cap.
AVERAGE ALLOCATION BY MARKET-CAP STYLE
| MICRO (%) | SMALL (%) | MID (%) | LARGE (%) | |
| Investment trusts | 40.6 | 44.0 | 14.9 | 0.5 |
| Open-ended funds | 40.7 | 47.2 | 12.1 | 0.0 |
Source: Morningstar. Rebased to percentage of the fund covered. As at 31/12/2021.
One reason for this is the success of the closed-ended funds. Four of the 10 largest strategies across both peer groups are investment trusts, meaning they now face some issues in getting meaningful positions in micro caps. Given that most fund managers do not intend to become owners of the companies they invest in, large investment trusts still need to avoid owning too much of a particular micro-cap company so that they can sell out if they want to.
Nevertheless, investors who are seeking genuinely micro-cap exposures will find that the investment trust space does contain strategies with the greatest focus on smaller smalls in the UK equity sectors, if not always beyond. This should come as no surprise, as the advantages of using a closed-ended structure are greatest when investing in the most illiquid of assets, such as companies with market caps below £100m.
Examples of this include Miton UK Microcap (LSE:MINI)and Downing Strategic Micro-Cad (LSE:DSM), both of which have an average market cap which is lower than any open-ended fund in the IA sector.
Run by Gervais Williams and Martin Turner, MINI typically invests in AIM-listed stocks with a market cap of less than £150m, focusing on companies that are positioned to generate substantial surplus cash in excess of market expectations over the near term. Gervais and Martin have formed much of their investment views around their predictions of a reversal in prevailing decades-long trends in globalisation, declining interest rates and the expansion of cheap credit, which they think will lead to small value stocks outperforming the highly rated mega-cap stocks which have long dominated equity market returns.
DSM follows a similarly value-biased approach to micro-cap investing, albeit with a very high-conviction approach: it is currently invested in a mere 16 holdings. Lead manager Judith Mackenzie and co-manager Nick Hawthorn also aim to enhance DSM’s returns by taking an active approach to investing, which can involve them proactively engaging with a company’s senior management or board to effect a catalyst to boost the valuation.
Dispersion
We think it interesting that trusts are more consistent in their market-cap allocations, and are more likely to concentrate on a specific market-cap style – be that micro or mid cap – rather than be spread across varying sizes. This supports our contention that the trust managers who want to focus on micro caps can and do, and that trusts contain more focussed and disciplined strategies on average. The table below shows the Morningstar size dispersion statistics, which measure how the range of market capitalisation varies within a portfolio. A lower score means the portfolio is more clustered around a particular point in the market cap spectrum.
SIZE DISPERSION SCORE BY PEER GROUP
| AVERAGE SIZE DISPERSION | STANDARD DEVIATION | MEDIAN | MAXIMUM | MINIMUM | |
| Investment trusts | 43.0 | 15.8 | 42.7 | 72.8 | 14.7 |
| Open-ended funds | 46.7 | 9.2 | 45.7 | 80.8 | 22.5 |
Source: Morningstar, as at 31/12/2021.
The lower dispersion of market caps within investment trusts means that investors can have greater confidence that their investment trusts will stick to a single style. However, there is a greater degree of volatility in the dispersion of investment trusts compared with open-ended funds, which is due in part to the greater number of outliers. These include the aforementioned dedicated micro-cap trusts, which see substantially lower dispersion in the market cap of their investments. Another way to visualise the consistency of investment trusts is to plot their weightings to each market-cap style, as can be seen in the below graphs.
We plotted histograms for the two sectors, showing the percentage of the number of funds in each sector which have a given allocation to specific market cap bands. For example, in the first table, we can see that around 17% of closed-ended funds have an allocation of 0-10% to micro caps. The small- and micro-cap graphs show closed-ended funds have fatter tails in their distributions compared to open-ended funds. This means that the investment trust universe contains more strategies with extreme allocations, which are more likely to have either large or negligible allocations to micro- and small-cap companies, indicating more focussed strategies. This fact explains the lower size dispersion metric of investment trusts. However, we note that open-ended funds have a more consistently high allocation to mid-caps, which could be a reflection of the inherent need for large strategies to seek out more liquid companies, something which is common between both closed- and open-ended funds.
PERCENTAGE ALLOCATIONS BY MARKET-CAP STYLE - MICRO-CAP ALLOCATION
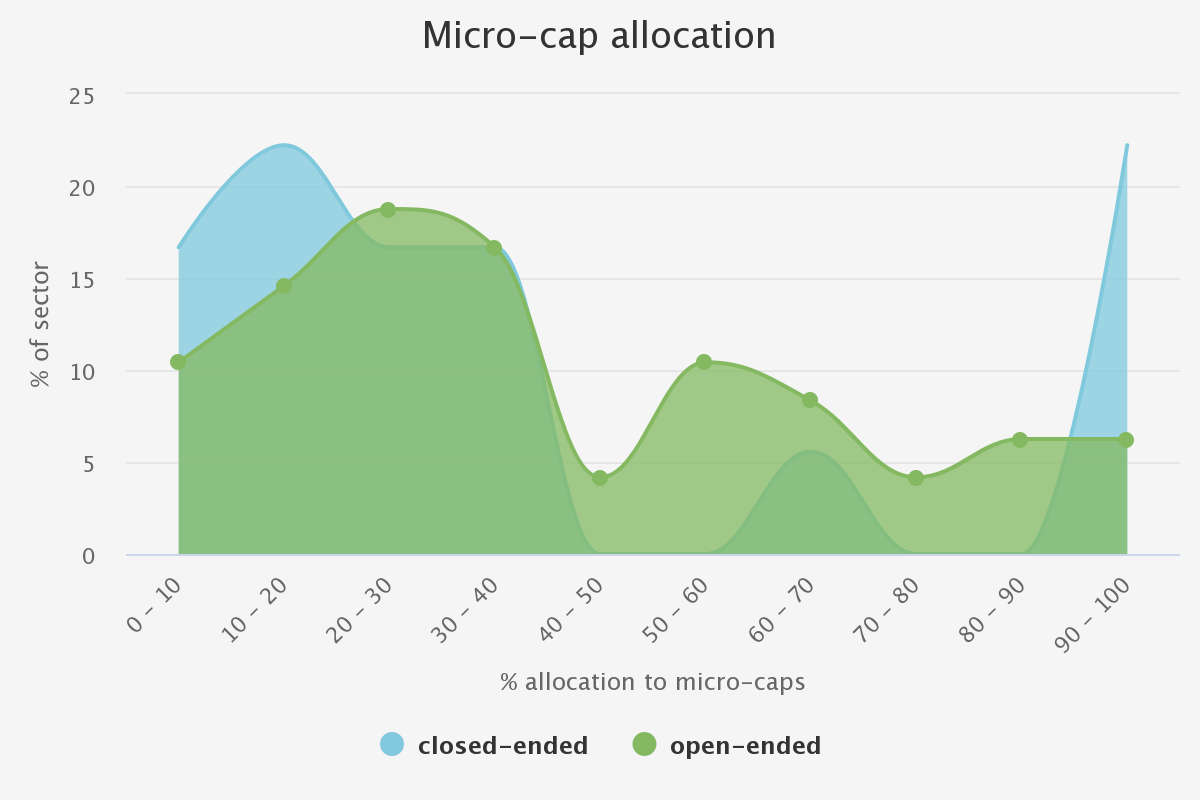
Source: Morningstar, most recent data as of 31/01/2022
PERCENTAGE ALLOCATIONS BY MARKET-CAP STYLE - SMALL-CAP ALLOCATION
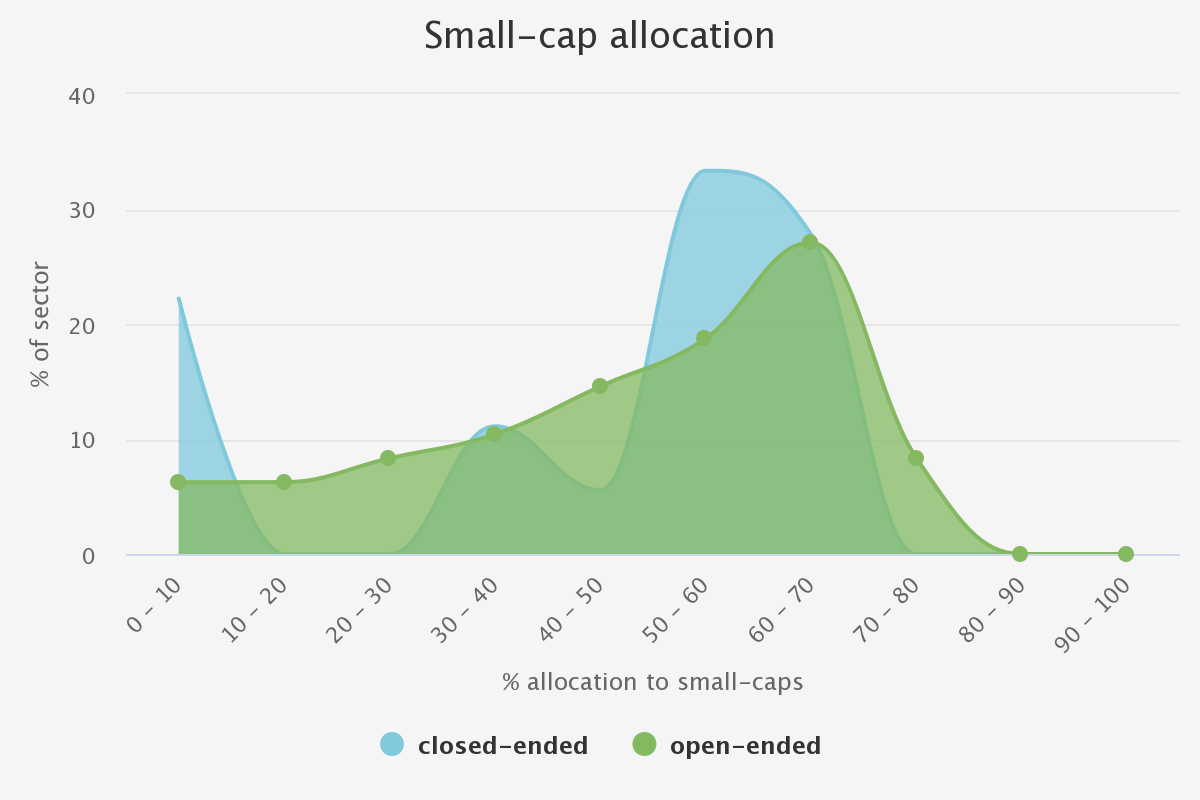
Source: Morningstar, most recent data as of 31/01/2022
MID-CAP ALLOCATION
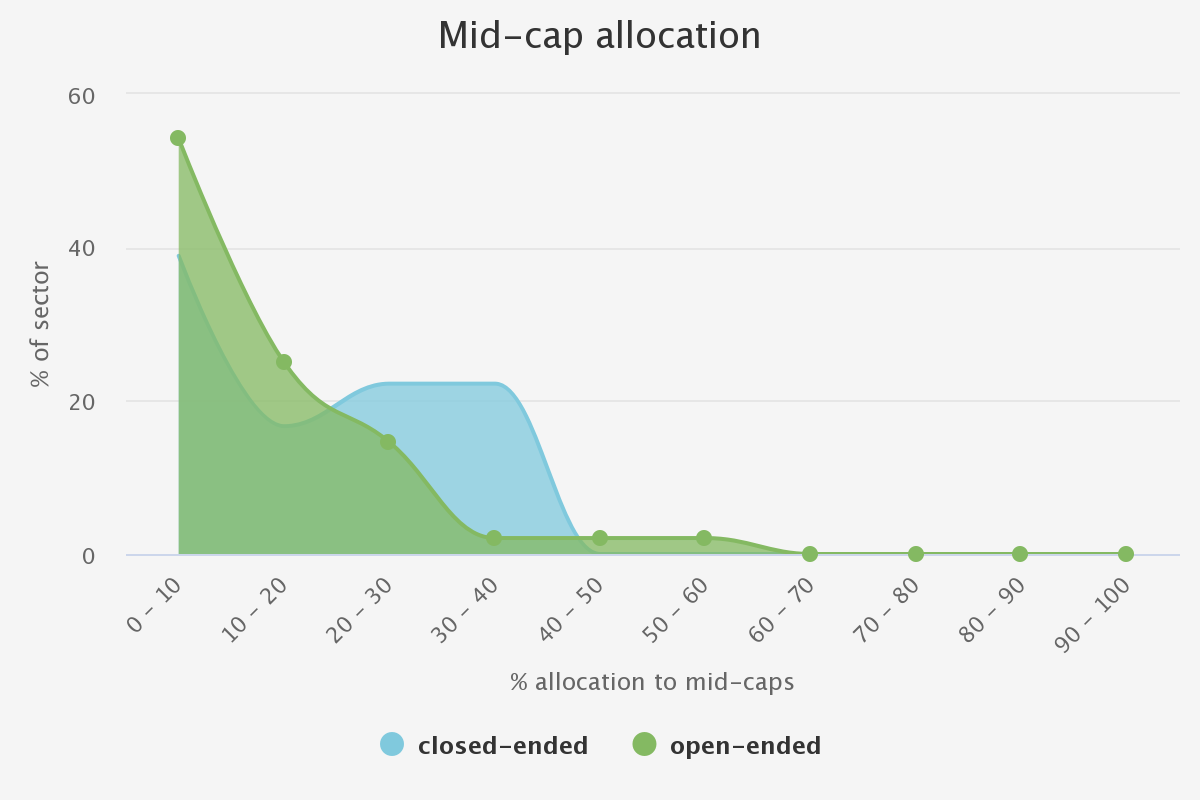
Source: Morningstar, most recent data as of 31/01/2022
Conclusion
We think we have shown how the investment trust space includes a variety of focused, disciplined strategies. Some trusts use the ability of the closed-ended structure to focus entirely on the micro-cap and smaller small segments which are largely out of play for open-ended funds. Others are more focused on other market cap segments. In any case, overall trusts are more consistent in the size of company they look for.
It is notable that open-ended funds are much more likely to have heavier mid-cap allocations though. We think this is a potential negative point for two reasons: first, we think the decision may be driven by liquidity. Holding more mid-caps gives managers more liquid stock to trade to satisfy daily liquidity, allowing some smaller smalls to be held. Second, it could indicate lower strategic discipline by the managers, a potential impact of the lack of an independent board. Allowing stocks in the portfolio to grow into mid and large caps will help increase fees earned by the manager and can make performance look good if the FTSE 250 is rallying, but it is unlikely to be the approach expected and desired by an investor looking for small-cap exposure.
Kepler Partners is a third-party supplier and not part of interactive investor. Neither Kepler Partners or interactive investor will be responsible for any losses that may be incurred as a result of a trading idea.
These articles are provided for information purposes only. Occasionally, an opinion about whether to buy or sell a specific investment may be provided by third parties. The content is not intended to be a personal recommendation to buy or sell any financial instrument or product, or to adopt any investment strategy as it is not provided based on an assessment of your investing knowledge and experience, your financial situation or your investment objectives. The value of your investments, and the income derived from them, may go down as well as up. You may not get back all the money that you invest. The investments referred to in this article may not be suitable for all investors, and if in doubt, an investor should seek advice from a qualified investment adviser.
Full performance can be found on the company or index summary page on the interactive investor website. Simply click on the company's or index name highlighted in the article.
Important Information
Kepler Partners is not authorised to make recommendations to Retail Clients. This report is based on factual information only, and is solely for information purposes only and any views contained in it must not be construed as investment or tax advice or a recommendation to buy, sell or take any action in relation to any investment.
This report has been issued by Kepler Partners LLP solely for information purposes only and the views contained in it must not be construed as investment or tax advice or a recommendation to buy, sell or take any action in relation to any investment. If you are unclear about any of the information on this website or its suitability for you, please contact your financial or tax adviser, or an independent financial or tax adviser before making any investment or financial decisions.
The information provided on this website is not intended for distribution to, or use by, any person or entity in any jurisdiction or country where such distribution or use would be contrary to law or regulation or which would subject Kepler Partners LLP to any registration requirement within such jurisdiction or country. Persons who access this information are required to inform themselves and to comply with any such restrictions. In particular, this website is exclusively for non-US Persons. The information in this website is not for distribution to and does not constitute an offer to sell or the solicitation of any offer to buy any securities in the United States of America to or for the benefit of US Persons.
This is a marketing document, should be considered non-independent research and is subject to the rules in COBS 12.3 relating to such research. It has not been prepared in accordance with legal requirements designed to promote the independence of investment research.
No representation or warranty, express or implied, is given by any person as to the accuracy or completeness of the information and no responsibility or liability is accepted for the accuracy or sufficiency of any of the information, for any errors, omissions or misstatements, negligent or otherwise. Any views and opinions, whilst given in good faith, are subject to change without notice.
This is not an official confirmation of terms and is not to be taken as advice to take any action in relation to any investment mentioned herein. Any prices or quotations contained herein are indicative only.
Kepler Partners LLP (including its partners, employees and representatives) or a connected person may have positions in or options on the securities detailed in this report, and may buy, sell or offer to purchase or sell such securities from time to time, but will at all times be subject to restrictions imposed by the firm's internal rules. A copy of the firm's conflict of interest policy is available on request.
Past performance is not necessarily a guide to the future. The value of investments can fall as well as rise and you may get back less than you invested when you decide to sell your investments. It is strongly recommended that Independent financial advice should be taken before entering into any financial transaction.
PLEASE SEE ALSO OUR TERMS AND CONDITIONS
Kepler Partners LLP is a limited liability partnership registered in England and Wales at 9/10 Savile Row, London W1S 3PF with registered number OC334771.
Kepler Partners LLP is authorised and regulated by the Financial Conduct Authority.