Six trusts for every investment outcome this year
We discuss three possible scenarios for the US over the next year and the trusts poised to prosper.
7th June 2019 16:43
This content is provided by Kepler Trust Intelligence, an investment trust focused website for private and professional investors. Kepler Trust Intelligence is a third-party supplier and not part of interactive investor. It is provided for information only and does not constitute a personal recommendation.
Material produced by Kepler Trust Intelligence should be considered a marketing communication, and is not independent research.
We discuss three possible scenarios for the US over the next year and the trusts poised to prosper.

2018 saw the first negative calendar year for the S&P 500 and the Dow Jones since 2008 and, despite a subsequent rally, sentiment remains divided between those who believe the US market has more room to run, and those who think the longest bull market in history will soon come screeching to a halt.
Instinctively, it feels like a correction must be due and, indeed, a recent survey of Kepler Trust Intelligence readers showed the majority feel that there are choppy waters ahead.
Among those who felt that the outlook was negative, the concern raised most often was the impact of any escalation in the 'trade-war' talk between China and the United States, while the national 'black dog' that is Britain's constant companion – Brexit – continues to weigh on investor spirits closer to home.
However, there are many other indicators which suggest the bull market could continue, making this a difficult time for investors wondering which way to jump. Against this confusing backdrop we look at three different scenarios for the US over the next year, and identify a number of trusts which are positioned well for each.
America's great, still!
We are in the midst of the longest bull run in US history, and markets don’t appear to be slowing down. The S&P 500 and the Dow Jones Industrial index have delivered net asset value (NAV) returns of 116% and 125.8% respectively over the past five years, and both have delivered double-digit returns since the start of the year. Only one trust out of the 15 in the AIC North American (including smallers) sectors has not generated positive returns over the past 12 months.
Whether this can continue into 2019/20 largely hinges on two key areas: the trade war and the Federal Reserves' interest rate policy. The former, particularly, is difficult to look past; for a conclusion to be reached, either China or the US must come out on top eventually, which means the other must suffer.
On the latter, we have recently seen a pivot in the Fed's policy, which is vital in adding further fuel to the fire. The FED rate-setters have announced that they now aim to keep interest rates unchanged, even if there is an improvement in global economic conditions, and there has now been talk of an interest rate cut this year. CME Fed Watch, which examines the Fed fund future contract prices, showed earlier in the month a 73% likelihood of a rate cut by the end of 2019.
Along with the Fed's change in stance, much of the economic data coming out of the US is robust. For example, payroll employment growth has remained strong, since June 2018 averaging 224,000 per month (ending February 2019) and the unemployment rate is at particularly low levels, more than halving since 2010.
As a result, the jobs market continues to be strong and we are witnessing rising worker pay and cycle-high consumer confidence. Additionally, there have been improved retail sales and durable goods orders, while the Institute for Supply Management (ISM) reports continue to demonstrate healthy growth rates.
United States employment rate
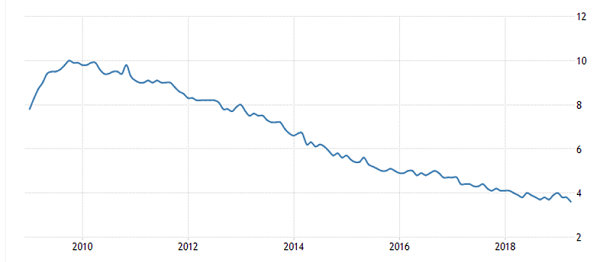
Source: Trading Economics
In this context Baillie Gifford US Growth (LSE:USA) is an obvious beneficiary. Gary Robinson and Helen Xiong are at the helm of the portfolio, searching for exceptional growth companies, where their innovations are likely to offer significant contributions to society.
In order to fully expose investors to the highest growth opportunities, the managers also have latitude to invest in unlisted companies. In their view, the most compelling growth companies are choosing to stay private for longer, which they believe gives the trust a unique edge over its peers. On a sector basis, the trust is dominated by the consumer discretionary (26%), information technology (19.6%) and health care (17%) sectors.
As one would expect from a high growth focused company, the trust has seen its ups and downs. However, since inception the trust has NAV returns of almost 30%, and 19% since the start of 2019.
Alongside USA, Allianz Technology Trust (LSE:ATT) is another trust that is likely to stand out in a bullish US equity market. Few trusts have generated the returns that ATT has, with annualised NAV increases of 26.94% per annum generated over the past five years.
The trust is managed by one of the most experienced technology investment teams in the world, with Walter Price at the helm. The team at ATT specifically look for areas where there is 'innovative disruption' and invest in the businesses best placed to exploit it – the vast majority of which are headquartered and listed in the US.
Walter's biggest theme in the portfolio is to cloud and SaaS businesses, which together amount to around 40-50% of the portfolio (including Microsoft (NASDAQ:MSFT), Google (NASDAQ:GOOGL) and Amazon (NASDAQ:AMZN)), but mainly represented by holdings in 15 or 20 mid-cap cloud software companies.
In Walter's view, 2019 is the best environment we have so far seen for selling cloud software, with many companies set to achieve exceptionally strong sales and earnings growth. Many companies have already started this multi-year process of moving to the cloud, and Walter believes it is very difficult for any of them to turn back halfway through.
As such, cloud businesses should have several years of good growth ahead of them irrespective of the wider economy. Whilst the portfolio is valued more highly than the wider market, Walter believes that the underlying companies growth characteristics are very rare when compared to the wider equity market. As such, he believes investors will continue to pay up for that growth.
Star spangled car crash?
All good things come to an end and for many, 2019 is the year that the US' historic bull run ends. Once more the inversion of the yield curve has been thrust into the spotlight, when towards the latter end of March, for the first time since 2007, the 10-year Treasury note yield fell as low as 2.42%, below the three-month T-bill yield at 2.455%.
The yield curve inverted once more at the start of May. According to the National Bureau of Economic Research (NBER), an inverted yield curve indicates a recession within the next year, and yield curve inversions have been seen before each of the last seven recessions.
This can be seen below in the chart, where the most recent recession, in 2007, was predicted by the yield curve, as was the tech bubble recession in the 2000s, albeit being a few years early.
US yield curve and previous US recessions
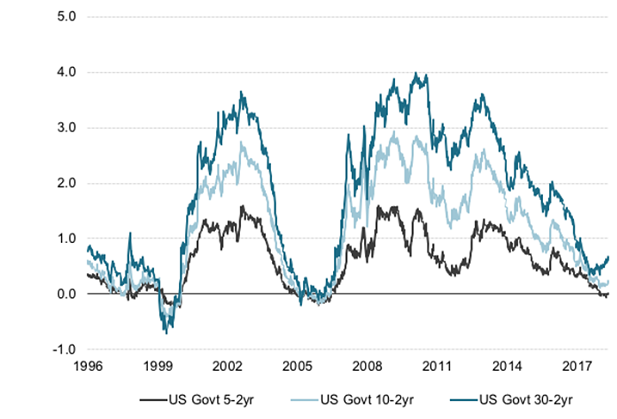
Source: Data Stream - 10 May
This inversion of the US yield curve was caused by the US and China trade war. Oxford Economics, a global forecasting and quantitative analysis company, estimated that the most recent tariffs would reduce US GDP by 0.3% in 2020, or the equivalent of $62 billion in lost output relative to the expected level of GDP. At the other end the tariffs will reduce China's output by 0.8% and the global economy by 0.3%, or more than $360 billion.
US-China 25% tariffs impact on global activity
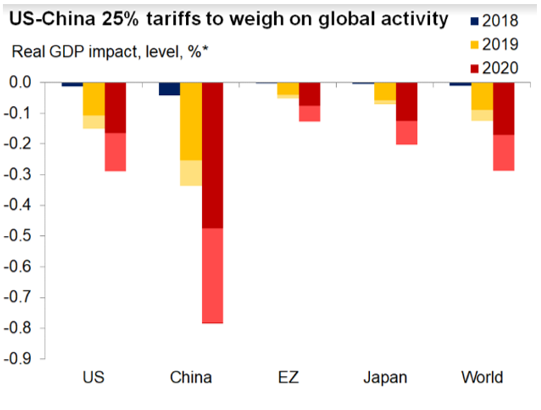
Source: Oxford Economics
The report goes on to illustrate the effects of any further increases in tariffs. If we see a tariff increase to 25% on all imports from China, and Beijing responds with the same, the U.S. GDP would take a hit of around 0.5%.
That would put real GDP growth (growth reduced for the effects of inflation) worrying close to the 1% mark by 2020. China’s GDP growth would be hit harder, reducing by close to 1.5% in 2020, slowing to an unseen low of 5% annually.
World GDP would suffer a significant 0.5% loss. As can be seen below, if the end result is an all-out trade war, the result would almost certainly lead to a full-blown recession.
Impact of rising trade tensions
Source: Oxford Economics
One of the areas that the tariffs were supposed to aid was the rising level of government and corporate debt, which is also worth mentioning in passing.
The government's public debt is now at over $22 trillion, the highest level ever seen. The key worry regarding the rising level of government debt is that it obscures the actual growth of the economy.
For example, if the U.S. Treasury had not increased its debt over the past five years, then nominal GDP would have actually been negative, according to Reuters.
This can often be overlooked when GDP growth figures are announced and illustrates that a lot of the impressive growth the US economy has shown has actually been based on debt.
Along with government debt, corporate debt has risen over the past decade, as companies have tried to take advantage of the interest rate environment.
Leveraged lending, which involves offering loans to companies already with outstanding debt, grew by 20% in 2018 according to the Fed's most recent Financial Stability Report.
In the report, the Fed recognised that the dangers associated with leveraged loans have intensified and any weakening of economic activity could boost default rates and lead to credit-related contractions to employment and investment among these businesses.
If the yield curve inversion is accurately forecasting a US recession, Gabelli Value Plus+ (LSE:GVP) is a trust that we would anticipate continuing to perform strongly.
Historic figures for the strategy show the managers have done well in down markets. Over the past 44 down quarters, the strategy employed by the trust has lost -13% on average, whilst the S&P has lost on average -23%.
The trust offers a highly differentiated portfolio with a high active share and a wide-ranging all-cap approach focused on identifying undervalued companies, including those with strategic value to trade buyers. The team, led by Mario and Marc Gabelli, utilise the proprietary "Private Market Value (PMV) with a Catalyst" methodology.
This involves understanding the value that an informed buyer would be willing to pay. Currently the portfolio is made up of 87 holdings, with the top ten holdings equating to only 30% of the portfolio.
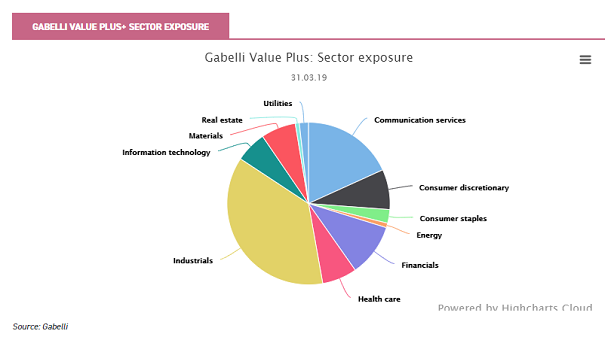
At a sectoral level, the largest absolute exposures are to industrials (37.1%), information technology (21.2%) and communication services (18.2%). The managers are firmly in the 'positive' camp on the outlook; seeing slower, but robust economic conditions.
They believe that eventually the US will come to a trade agreement with China, and the Fed's pivot in policy will help to continue the bull run. With this said, they are very much aware that risks remain but their PMV model should help deliver strong returns throughout the year.
Gabelli Value Plus+ Sector Exposure
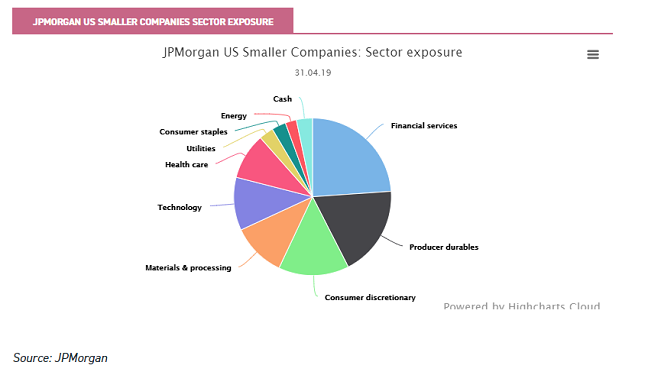
Another trust that we believe could perform well on a relative basis in a recessionary environment is JPMorgan US Smaller Companies (LSE:JUSC).
At the helm of the trust is Don San Jose who, along with the rest of his team, use bottom-up investment analysis to identify high quality companies that demonstrate balance sheet strength and solid cashflows.
Through constantly assessing the underlying company's 'pathway' for earnings into the future, and the impact of the wider market, the trust is able to maintain low levels of beta, despite boasting high levels of alpha. Although it initially appears to have a cyclical tilt, the portfolio is considerably more defensive than one might anticipate.
For example, the largest overweight position, materials and processing, has no exposure to commodities and instead the largest majority of the companies are in packaging. These stocks are far more like consumer staples stocks, offering reliable and recurring revenues.
Likewise, in the second-largest sector overweight position - producer durables - one might expect the trust to have industrials exposure, but instead it has a bias towards leisure companies. The team at JPMorgan recognise that we are late cycle, and that in their view, there is likely to be a US recession in the next 18-24 months. As such, they believe that now is not a time to take risks and the best place for international investors to be is in the US where there is an abundance of high quality and cash generative companies.
JPMorgan US Smaller Companies Sector Exposure
Source: JPMorgan
More of the same
In a final scenario, we could see absolutely nothing change and we have more of the same. In this situation the trade talks continue to fester in the background, without a resolution or a full-blown trade war.
Economic data continues to be reasonably strong, however there are worries over government debt and the lateness of the cycle.
In this situation, volatility will continue to be a feature, as we have seen over the past few months. There have been countless sessions over the past few weeks in which the Dow Jones Industrial Average has suffered triple-digit losses - including 10 May when the U.S. market benchmark shed more than 600 points and then, jumped by more than 500 points over the following three days.
The most common measure of volatility the VIX, also known as the market's "fear index", hit its highest levels since the first week of 2019 this month.
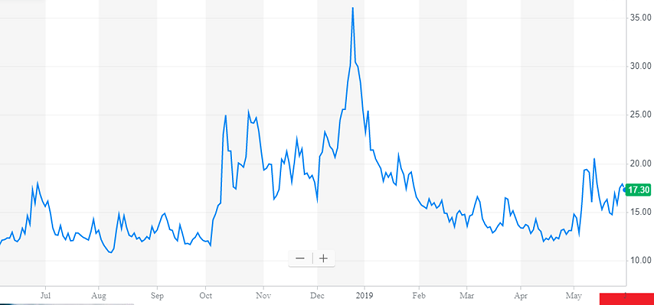
VIX Volatility Index – One Year Graph
Source: Yahoo finance
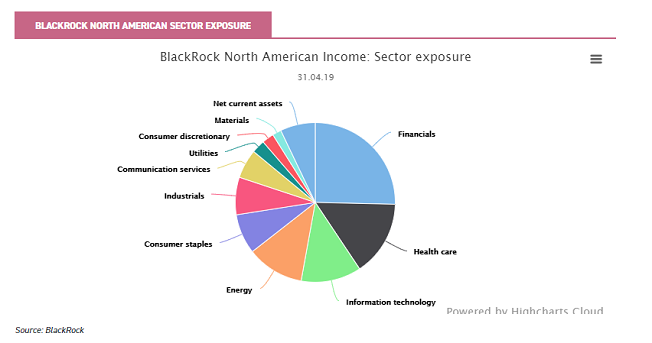
In this type of environment BlackRock North American (LSE:BRNA)* is a likely stand out performer. Over the past year the trust has the second-lowest beta of the two AIC North American sectors, sitting at just 0.82.
This is also reflected over five years where the beta is just 0.9, relative to the average of 1.03 across both the AIC North American sectors. Looking at the annualised standard deviation, the trust boasts the lowest volatility in the two sectors over both one (16.31) and five years (10.46), where the average is 23.3 and 14.03 over the respective periods.
BRNA focuses on the 500 largest stocks by market cap in the US, looking to provide an attractive and growing level of income return with capital appreciation over the long term.
The managers have a low-turnover approach, and a strong focus on valuation, aiming for well-established cash generative companies with clear revenue streams and the potential for dividend growth.
Around 75% of the portfolio sits within the US, however 5% sits in the UK and 7.1% of NAV is held as cash. The largest sector exposures come from financials (25.4%), healthcare (15.3%) and information technology (12.1%). At the other end of the spectrum the trust has very little exposure to the likes of utilities (2.7%), materials (1.8%).
Exposure to the US through alternative routes...
A left-field choice for investors seeking exposure to US equities – and certainly not a route to broad US exposure – is International Biotechnology (LSE:IBT). Whilst it may seem like a somewhat oddball choice in a report on investing in the US, a recent conversation with the managers found that the trust, which is almost wholly invested in US companies, found that biotech is by a very wide margin the cheapest S&P subsector in PE terms.
Biotech stocks currently trade on a PE of 9.9%, less than half their average PE over the last 25 years, and well below the average of 16% for the 11 other major subsectors.
Alongside IBT, Third Point Offshore Investors is perhaps a less than obvious candidate to get exposure to the US. However, the manager – led by Dan Loeb - is best known for it's event driven, value-oriented approach, which the management team apply opportunistically and dynamically across asset classes.
The team blends bottom-up security selection with macroeconomic insights layered on top, aiming to deliver strong risk-adjusted returns over the longer term. The majority of the fund’s assets are currently invested in long and short equities positions, but it also has exposure to corporate and sovereign credit, asset-backed securities, venture investments, risk arbitrage, and macroeconomic events. The trust has net exposure to equities (predominantly US) of 50.5% as at the end of April 2019. The shares trade on a discount of over 20%, which is wide in absolute and relative terms.
Kepler Partners is a third-party supplier and not part of interactive investor. Neither Kepler Partners or interactive investor will be responsible for any losses that may be incurred as a result of a trading idea.
Full performance can be found on the company or index summary page on the interactive investor website. Simply click on the company's or index name highlighted in the article.
Important Information
Kepler Partners is not authorised to make recommendations to Retail Clients. This report is based on factual information only, and is solely for information purposes only and any views contained in it must not be construed as investment or tax advice or a recommendation to buy, sell or take any action in relation to any investment.
This report has been issued by Kepler Partners LLP solely for information purposes only and the views contained in it must not be construed as investment or tax advice or a recommendation to buy, sell or take any action in relation to any investment. If you are unclear about any of the information on this website or its suitability for you, please contact your financial or tax adviser, or an independent financial or tax adviser before making any investment or financial decisions.
The information provided on this website is not intended for distribution to, or use by, any person or entity in any jurisdiction or country where such distribution or use would be contrary to law or regulation or which would subject Kepler Partners LLP to any registration requirement within such jurisdiction or country. Persons who access this information are required to inform themselves and to comply with any such restrictions. In particular, this website is exclusively for non-US Persons. The information in this website is not for distribution to and does not constitute an offer to sell or the solicitation of any offer to buy any securities in the United States of America to or for the benefit of US Persons.
This is a marketing document, should be considered non-independent research and is subject to the rules in COBS 12.3 relating to such research. It has not been prepared in accordance with legal requirements designed to promote the independence of investment research.
No representation or warranty, express or implied, is given by any person as to the accuracy or completeness of the information and no responsibility or liability is accepted for the accuracy or sufficiency of any of the information, for any errors, omissions or misstatements, negligent or otherwise. Any views and opinions, whilst given in good faith, are subject to change without notice.
This is not an official confirmation of terms and is not to be taken as advice to take any action in relation to any investment mentioned herein. Any prices or quotations contained herein are indicative only.
Kepler Partners LLP (including its partners, employees and representatives) or a connected person may have positions in or options on the securities detailed in this report, and may buy, sell or offer to purchase or sell such securities from time to time, but will at all times be subject to restrictions imposed by the firm's internal rules. A copy of the firm's conflict of interest policy is available on request.
Past performance is not necessarily a guide to the future. The value of investments can fall as well as rise and you may get back less than you invested when you decide to sell your investments. It is strongly recommended that Independent financial advice should be taken before entering into any financial transaction.
PLEASE SEE ALSO OUR TERMS AND CONDITIONS
Kepler Partners LLP is a limited liability partnership registered in England and Wales at 9/10 Savile Row, London W1S 3PF with registered number OC334771.
Kepler Partners LLP is authorised and regulated by the Financial Conduct Authority.
Kepler Partners is a third-party supplier and not part of interactive investor. Neither Kepler Partners or interactive investor will be responsible for any losses that may be incurred as a result of a trading idea.
These articles are provided for information purposes only. Occasionally, an opinion about whether to buy or sell a specific investment may be provided by third parties. The content is not intended to be a personal recommendation to buy or sell any financial instrument or product, or to adopt any investment strategy as it is not provided based on an assessment of your investing knowledge and experience, your financial situation or your investment objectives. The value of your investments, and the income derived from them, may go down as well as up. You may not get back all the money that you invest. The investments referred to in this article may not be suitable for all investors, and if in doubt, an investor should seek advice from a qualified investment adviser.
Full performance can be found on the company or index summary page on the interactive investor website. Simply click on the company's or index name highlighted in the article.
Important Information
Kepler Partners is not authorised to make recommendations to Retail Clients. This report is based on factual information only, and is solely for information purposes only and any views contained in it must not be construed as investment or tax advice or a recommendation to buy, sell or take any action in relation to any investment.
This report has been issued by Kepler Partners LLP solely for information purposes only and the views contained in it must not be construed as investment or tax advice or a recommendation to buy, sell or take any action in relation to any investment. If you are unclear about any of the information on this website or its suitability for you, please contact your financial or tax adviser, or an independent financial or tax adviser before making any investment or financial decisions.
The information provided on this website is not intended for distribution to, or use by, any person or entity in any jurisdiction or country where such distribution or use would be contrary to law or regulation or which would subject Kepler Partners LLP to any registration requirement within such jurisdiction or country. Persons who access this information are required to inform themselves and to comply with any such restrictions. In particular, this website is exclusively for non-US Persons. The information in this website is not for distribution to and does not constitute an offer to sell or the solicitation of any offer to buy any securities in the United States of America to or for the benefit of US Persons.
This is a marketing document, should be considered non-independent research and is subject to the rules in COBS 12.3 relating to such research. It has not been prepared in accordance with legal requirements designed to promote the independence of investment research.
No representation or warranty, express or implied, is given by any person as to the accuracy or completeness of the information and no responsibility or liability is accepted for the accuracy or sufficiency of any of the information, for any errors, omissions or misstatements, negligent or otherwise. Any views and opinions, whilst given in good faith, are subject to change without notice.
This is not an official confirmation of terms and is not to be taken as advice to take any action in relation to any investment mentioned herein. Any prices or quotations contained herein are indicative only.
Kepler Partners LLP (including its partners, employees and representatives) or a connected person may have positions in or options on the securities detailed in this report, and may buy, sell or offer to purchase or sell such securities from time to time, but will at all times be subject to restrictions imposed by the firm's internal rules. A copy of the firm's conflict of interest policy is available on request.
Past performance is not necessarily a guide to the future. The value of investments can fall as well as rise and you may get back less than you invested when you decide to sell your investments. It is strongly recommended that Independent financial advice should be taken before entering into any financial transaction.
PLEASE SEE ALSO OUR TERMS AND CONDITIONS
Kepler Partners LLP is a limited liability partnership registered in England and Wales at 9/10 Savile Row, London W1S 3PF with registered number OC334771.
Kepler Partners LLP is authorised and regulated by the Financial Conduct Authority.
These articles are provided for information purposes only. Occasionally, an opinion about whether to buy or sell a specific investment may be provided by third parties. The content is not intended to be a personal recommendation to buy or sell any financial instrument or product, or to adopt any investment strategy as it is not provided based on an assessment of your investing knowledge and experience, your financial situation or your investment objectives. The value of your investments, and the income derived from them, may go down as well as up. You may not get back all the money that you invest. The investments referred to in this article may not be suitable for all investors, and if in doubt, an investor should seek advice from a qualified investment adviser.
Full performance can be found on the company or index summary page on the interactive investor website. Simply click on the company's or index name highlighted in the article.