Stockwatch: Big benefits for patient shareholders
There is scope for upgrades at this company as Brexit and credit stress take their toll on corporate UK.
5th February 2019 10:30
by Edmond Jackson from interactive investor
There is scope for upgrades at this company as Brexit and credit stress take their toll on corporate UK.

Financial stocks punished in Q4 2018 included £68 million AIM-listed corporate recovery services group Begbies Traynor (LSE:BEG) – ironically, because it is able to capitalise on financial stress as creditors tighten lending in a climate of uncertainty.
Its corporate advisory and estate agency services dovetail well in administrations, and independent data shows a 6% rise in UK corporate insolvencies for the year to end-September 2018 (Begbies' year is to 31 October).
Moreover, Begbies' own research shows the number of businesses in critical financial distress up 25% year-on-year to 2,183 for 2018 as a whole.
Inflection point as prospects rise
The Begbies share price held at around 75p for about a year to end-October 2018, falling to 58p earlier this January. The stock has perked up to 63p after the 30 January release of the company's latest "red flag alert report" for Q4 2018, also the 1 February acquisition news of a property advisory business giving transport planning/design advice to corporate clients – deemed to enhance the group's professional services.
While this add-on looks logical, the stock has more likely risen 9% in realisation it was low relative to UK corporate distress rising and medium-term earnings forecasts made before this news.
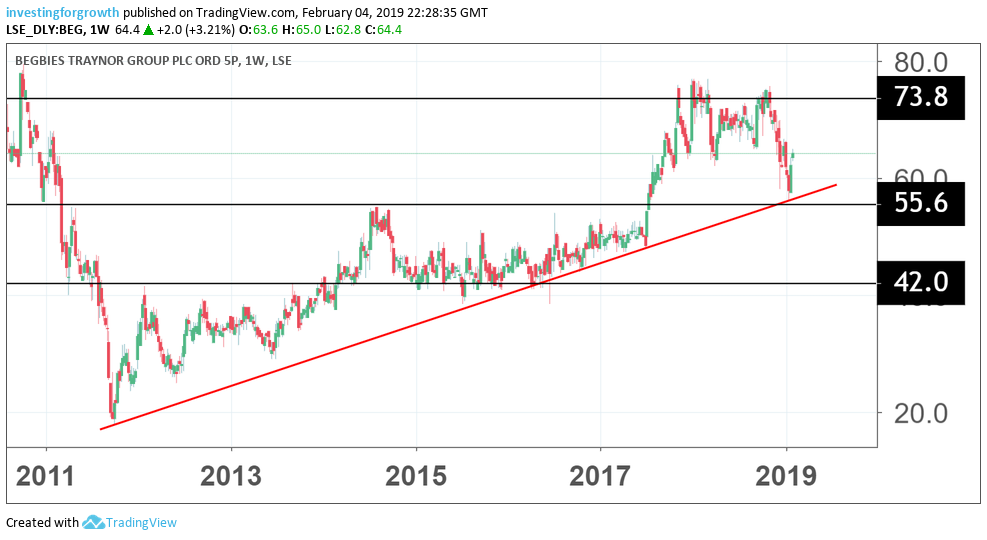
Source: TradingView (*) Past performance is not a guide to future performance
Assuming consensus in the table below for earnings per share (EPS) of 4.3p, rising to 4.5p, the prospective price/earnings (PE) is about 14 times, though I have seen another target for about 5p EPS on a 12 month-forward basis, which looks like an upgrade.
The context is not just the Brexit fiasco; I've suggested in previous macro articles how the credit cycle may be broadly rolling over and is a harbinger of the wider business cycle. From latest data, not only has January factory output slowed in the UK, it only just achieved growth in the eurozone and slumped to a three-year low in China.
Property and 'zombie' firms are being worst hit
At a UK companies level, Begbies' red flag report cites property as making the most squeals: in terms of significant financial distress, up 3,134 or 7% in Q4 2018 (on Q3) and by 4,013 or 9% on a year-on-year basis. It tallies with property firms tending to be more debt-reliant, getting caught out after years of cheap money as banks now tighten terms and retail occupiers of high street commercial property fail.
Overall, the rise in UK firms in significant financial distress in Q4 2018 on Q3 was only 3.2%, or by 15,000 to 481,000. The 25% rise for those in critical financial distress sounds ominous but may be explained by the "zombie" theory: how central bank stimulus kept enough over-borrowed and weakly-positioned firms on life-support instead of the 2008/09 recession killing them off.
While this mitigated stress to banks (writing off loans) also the depth of recession (by way of job losses), it guaranteed a sub-sector of "zombies" – firms incapable of earning a fair return on assets – to persist. On such a view it is logical to see a sharper rise initially in critical financial distress levels, than those of a significant nature.
Begbies also cites, in terms of Q4 significant distress, a 4% increase in support services to 4,245; likewise a 4% increase in construction to 2,599; and a 4% increase in professional services, to 1,027. Retail saw only a 2% increase, although Q4 is typically a strong cash trading period.
Thus, the profile of firms affected is as to be expected: those most indebted also cyclical.
| Begbies Traynor Group - financial summary | Consensus estimates | ||||||
|---|---|---|---|---|---|---|---|
| year ended 30 Apr | 2014 | 2015 | 2016 | 2017 | 2018 | 2019 | 2020 |
| Turnover (£ million) | 44.1 | 45.4 | 50.1 | 49.7 | 52.4 | ||
| IFRS3 pre-tax profit (£m) | 4.3 | -0.7 | 0.9 | 0.6 | 2.3 | ||
| Normalised pre-tax profit (£m) | 5.2 | 2.2 | 0.8 | 0.7 | 2.3 | 1.6 | 2.3 |
| Operating margin (%) | 14.3 | 7.2 | 3.4 | 2.6 | 5.1 | ||
| IFRS3 earnings/share (p) | 3.7 | -0.6 | 0.4 | 0.2 | 0.2 | ||
| Normalised earnings/share (p) | 4.8 | 2.4 | 0.3 | 0.2 | 1.3 | 4.3 | 4.5 |
| Price/earnings multiple (x) | 48.5 | 17.7 | 14 | ||||
| Annual average historic P/E (x) | 9.4 | 16.8 | 98.3 | 210 | 138 | 50.6 | |
| Cash flow/share (p) | 6.1 | 3.9 | 6.4 | 5.2 | 6.6 | ||
| Capex/share (p) | 0.4 | 1.3 | 0.5 | 0.3 | 0.4 | ||
| Dividends per share (p) | 2.2 | 2.2 | 2.2 | 2.2 | 2.3 | 2.6 | 2.7 |
| Yield (%) | 3.7 | 4.1 | 4.3 | ||||
| Covered by earnings (x) | 2.2 | 1.2 | 0.2 | 0.1 | 0.6 | 1.7 | 1.7 |
| Net tangible assets per share (p) | 8.6 | 3.1 | 1.7 | -0.4 | 0.1 | ||
Source: Company REFS
Second half bias could mean EPS beats consensus
Strong comparators were blamed for modest numbers for the six months to end-October 2018: revenue was up 7.7% to £28 million, benefiting from acquisitions, and normalised pre-tax profit up 10.3% to £3.2 million if you disregard £1.4 million acquisition costs and £1.2 million amortisation. Otherwise, headline profit fell 40% to £0.6 million.
Acquirers' habit of stripping out costs to assert "true" profit/earnings creates a dilemma for interpreting accounts. Yes, you want to see through to underlying performance, but costs are involved to achieve this.
A similar like-for-like interim finance charge took 29% of operating profit leaving £0.6 million pre-tax, and the company's liability for £0.5 million tax shows HMRC taking a more positive view of intrinsic profit than headline reporting. Adjusted EPS rose 10% to 2.2p and the interim dividend by 14% to 0.8p.
Operating cash flow eased 35% to £3.2 million and by 45% to £2.4 million on a net basis, chiefly due to higher tax paid. It was still possible to spend £0.8 million on dividends and £1 million repaying loans such that net debt fell 9% to £6.3 million. That's in context of a £25 million committed facility and a £5 million uncommitted acquisition facility, although the latest buy has involved cash and a modest issue of shares.
- 10 shares to generate £10,000 income in 2019
- Must-watch dates for investors in February 2019
- Shares in this industry leader rated a 'buy'
So, the stock is more likely up 9% due to the January effect as the US Federal Reserve's dovish tones helps virtually all equities, and a perception about how Begbies is well placed as uncertainties multiply around UK firms.
Management cited a second-half bias, aware of contingent fees to kick in, especially on the business recovery/financial advisory side which saw its interim profit ease from £4.1 million to £3.6 million like-for-like. An operating margin slip of 9% to 18% was due to fees phasing.
The property side saw profit rise from £1.3 million to £2.1 million as activity increased and a first-time contribution was made by the February 2018 acquisition of CJM Asset Management, the margin rising 31.5% to 25.9%.
Both divisions are expected to benefit from higher activity in the second half as insolvency appointments rise and capitalising on organic investments made across service lines. If the market shares the company's sense for 2.2p of normalised interim EPS, the full-year outcome to 30 April may therefore be at least 5p and trending higher.
Development affirms a sense of 'long-term buy'
I first drew attention at 44p in April 2014, although the financial trend thereafter (see table) was uninspiring as the economy did well, the stock only rising from the second half of 2016. More recently, in September 2018, I've felt a 'hold' stance appropriate at 71p which I would still say is justified intrinsically; the stock being taken down in Q4 2018 by the wider bear market.
Aside from the challenge to figure what Begbies' red flag alert reports really mean for its profitability, and what normalised view is justified while acquisitions continue, there's no doubt the group is shaping itself into a unique combination of services of long-term strategic value.
This should benefit patient shareholders, especially now that the financial climate cools after a decade of debt expansion; my drawing attention could have been premature but "now's the time". In the long run the group should also be attractive to an accountancy services group, and the executive chairman will need to decide the future of his £25.3 million stake, whether placed with institutions or sold with the business. Buy.
*Horizontal lines on charts represent levels of previous technical support and resistance. Trendlines are marked in red.
Edmond Jackson is a freelance contributor and not a direct employee of interactive investor.
These articles are provided for information purposes only. Occasionally, an opinion about whether to buy or sell a specific investment may be provided by third parties. The content is not intended to be a personal recommendation to buy or sell any financial instrument or product, or to adopt any investment strategy as it is not provided based on an assessment of your investing knowledge and experience, your financial situation or your investment objectives. The value of your investments, and the income derived from them, may go down as well as up. You may not get back all the money that you invest. The investments referred to in this article may not be suitable for all investors, and if in doubt, an investor should seek advice from a qualified investment adviser.
Full performance can be found on the company or index summary page on the interactive investor website. Simply click on the company's or index name highlighted in the article.
Disclosure
We use a combination of fundamental and technical analysis in forming our view as to the valuation and prospects of an investment. Where relevant we have set out those particular matters we think are important in the above article, but further detail can be found here.
Please note that our article on this investment should not be considered to be a regular publication.
Details of all recommendations issued by ii during the previous 12-month period can be found here.
ii adheres to a strict code of conduct. Contributors may hold shares or have other interests in companies included in these portfolios, which could create a conflict of interests. Contributors intending to write about any financial instruments in which they have an interest are required to disclose such interest to ii and in the article itself. ii will at all times consider whether such interest impairs the objectivity of the recommendation.
In addition, individuals involved in the production of investment articles are subject to a personal account dealing restriction, which prevents them from placing a transaction in the specified instrument(s) for a period before and for five working days after such publication. This is to avoid personal interests conflicting with the interests of the recipients of those investment articles.