Stockwatch: is this FTSE 100 share’s 9% yield worth the risk?
Sat within the FTSE 100’s highest-yielding sector, this share got cheaper following recent results. Analyst Edmond Jackson investigates the dividend and investment potential.
9th September 2025 11:13
by Edmond Jackson from interactive investor

How can a FTSE 100 share price drop nearly 8% - when already yielding more than 8% - in response to 2025 half-year results proclaiming that the business is on course to become the UK leader in a mass market?
- Invest with ii: SIPP Account | Stocks & Shares ISA | See all Investment Accounts
Such is the dilemma for many individual holders of Phoenix Group Holdings (LSE:PHNX), the £6 billion savings and retirement group changing its name next March to Standard Life, to better convey its main operation.
On the face of it, yesterday’s drop can appear to be mean-reversion from this and other financial shares which have been on a sharp rally from early April when US President Donald Trump unveiled – then paused – his “reciprocal tariffs”:
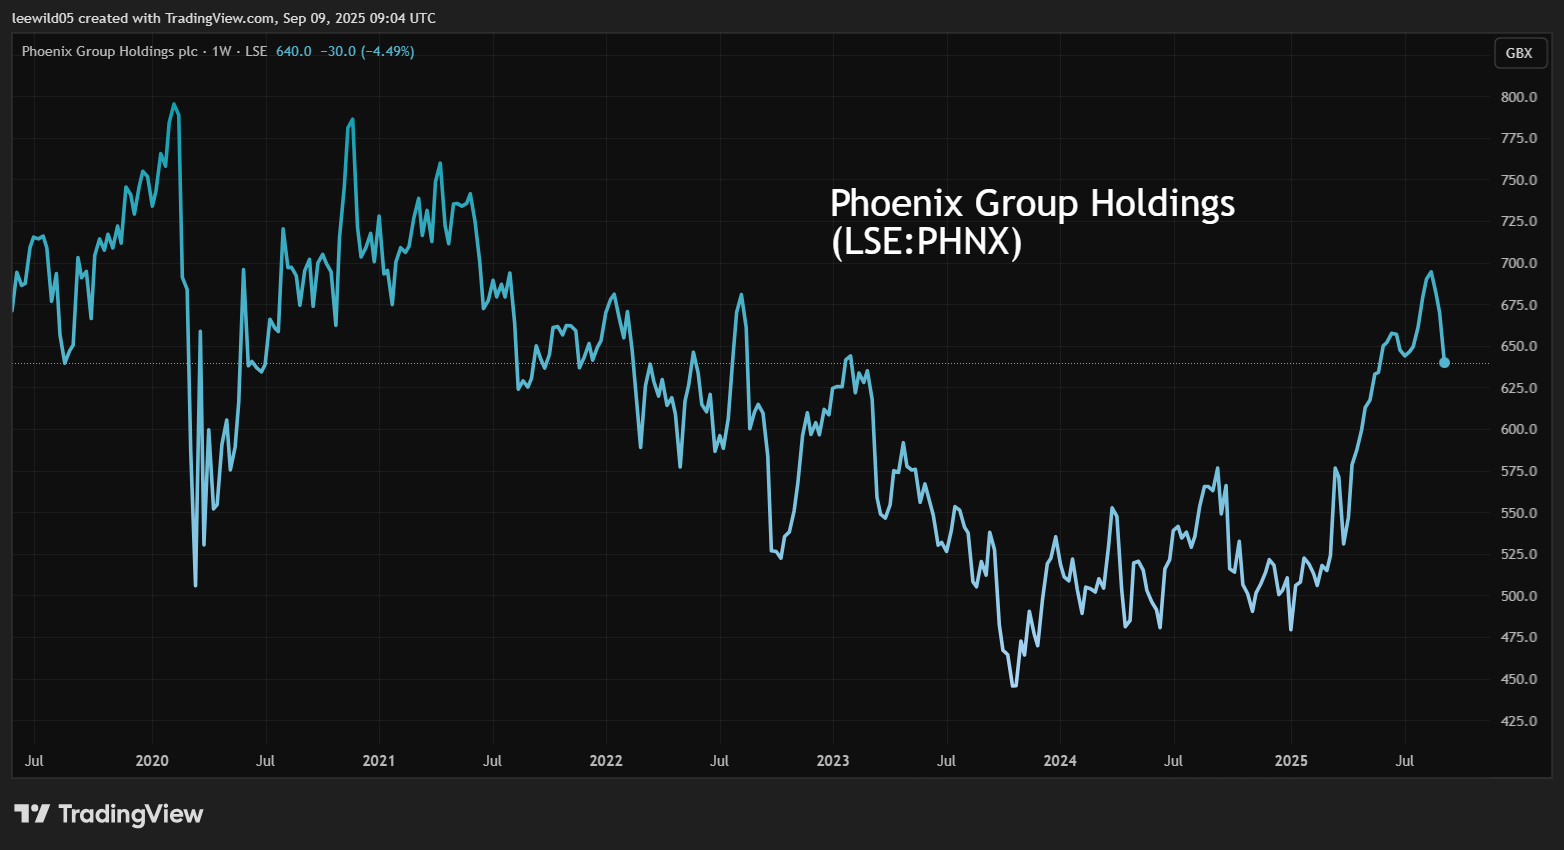
Source: TradingView. Past performance is not a guide to future performance.
Yet Aviva (LSE:AV.) (admittedly more an insurer) and M&G Ordinary Shares (LSE:MNG) are holding on to their 2025 gains.
Meanwhile, Legal & General Group (LSE:LGEN) has actually dropped 11% from mid-August, as if the market is being more cautious as to fluctuations in underlying assets and liabilities for the big pension groups. These shares respectively yield 6.2%, 8.2% and 9.5% based on consensus forecasts.
A tricky task to decipher underlying trend in cash flow
At 635p, and assuming consensus forecasts, Phoenix offers an 8.7% dividend yield in respect of 2025 and 9.0% for 2026, with earnings cover of 1.1x rising to 1.3x. There has been a consistent record of dividend growth even if small at 2-3% annually. While tricky to decipher from a cash entry what is available to shareholders rather than ring-fenced for a financial business, the 30 June balance sheet shows that it rising 5.5% over six months to £9,977 million. The business has almost no capital spending needs, so a good cash-flow performance from the operations ought to be reassuring.
The latest results are pitched as “a strong first-half performance with progress against all key financial metrics we use...”, but on cash flow shareholders are bowled quite a googly. Management seizes on operating cash generation up 9% to £705 million like-for-like, which does not reconcile with the statement on page 24 showing a fall from £3,094 million to £1,059 million.
- Insider: chief backs Aviva with big share purchase
- eyeQ: why L&G and Aviva shares are now cheap
- ii view: income play L&G remains ‘firmly on track’
Scrolling down a vast array of detail in the full interim release, in search of note 17 for clarity, there are some big swings – a three-fold jump in “decrease in liabilities classified as held for sale” which are treated negatively, and a halving of “increase in investment contract liabilities”. You could not want for a better introduction to the complexity of financial groups like this.
The market reportedly took fright at the headline “total cash generation down 17% to £784 million” and, yes, in terms of the overall dynamic, the cash-flow statement shows a greatly reduced net increase in cash of £491 million versus £2,463 million in the first half of 2024.
Yet management proclaims Phoenix as generating at least £300 million excess cash annually after its dividend and financing needs. The current objective is to apply this for deleveraging although debt was only £3,414 million at the end of June.
It’s not clear whether a six-month snapshot of cash-flow dynamics reflects more than inherently big fluctuations in assets and liabilities for major pension groups, although this period has not exactly seen a financial crisis such as eurozone debt in 2011, partly explaining why the market tends to price big pensions and insurance groups for high yield.
Management insists, however, that being “firmly on track” includes a three-year total cash generation target of £5.1 billion from 2024-26.
A reasonable conclusion here is to respect that since you cannot predict events impacting pension/insurer cash flows, best diversify among them or just avoid the sector. Understandably for people at or approaching retirement, they are potentially very useful shares to have accumulated for income. For younger investors, perhaps there are better opportunities for total return.
Net profit/asset value also jolt near-term perception
While Phoenix’s adjusted operating profit jumped 25% to £451 million, its reported after-tax loss was £156 million, although an improvement on a £646 million this time last year. There was a 41% negative swing in investment contract liabilities to £5,756 million, although higher tax charges chiefly explain this loss. You have to be very superficially attracted to headline numbers to be swayed by it.
More starkly, net asset value (NAV) is down 20% to £1,792 million in the first six months of 2025 having been £3,326 million at the end of 2023. As of 30 June, it implied net assets per share of 170p albeit where 93% constitute intangibles, chiefly as a result of acquisitions where a premium was paid to intangible assets.
Phoenix Group Holdings - financial summary
Year-end 31 Dec
| 2019 | 2020 | 2021 | 2022 | 2023 | 2024 | |
| Turnover (£ million) | 28,866 | 21,435 | 24,089 | -10,589 | 19,369 | 20,768 |
| Operating profit (£m) | 351 | 1,270 | -430 | -4,089 | 262 | -1,107 |
| Net profit (£m) | 85.0 | 798 | -837 | -2,724 | 56.0 | -1,090 |
| Operating margin (%) | 1.2 | 5.9 | -1.8 | 1.4 | -5.3 | |
| Reported earnings/share (p) | 8.6 | 91.6 | -86.2 | -275 | 3.4 | -112 |
| Normalised earnings/share (p) | 24.5 | 68.6 | -75.8 | -266 | 12.3 | -90.0 |
| Operational cashflow/share (p) | 9.4 | 798 | -110 | 83 | -91.4 | 334 |
| Capital expenditure/share (p) | 0.0 | 0.0 | 0.0 | 0.0 | 0.0 | 2.9 |
| Free cashflow/share (p) | 9.4 | 798 | -110 | 83 | -91.4 | 331 |
| Dividend per share (p) | 46.8 | 47.5 | 48.9 | 50.8 | 52.7 | 54.0 |
| Covered by earnings (x) | 0.2 | 1.9 | -1.8 | -5.4 | 0.1 | -2.1 |
| Return on total capital (%) | 0.1 | 0.4 | -0.1 | -1.5 | 0.1 | -0.4 |
| Cash (£m) | 4,466 | 10,998 | 9,112 | 8,839 | 7,168 | 9,453 |
| Net debt (£m) | -2,263 | -6,347 | -4,788 | -4,767 | -3,202 | -5,767 |
| Net assets (£m) | 5,279 | 7,531 | 6,261 | 3,705 | 3,236 | 2,246 |
| Net assets per share (p) | 732 | 754 | 626 | 370 | 323 | 224 |
Source: company accounts.
This puts the shares at 2.7x NAV, although it is a similar story at Aviva on 2.4, Legal & General on 5.5x even, and M&G on 1.9x.
It might have been a factor in the market feeling discombobulated by these results, but is more the swing factor than the shares trading on a multiple of NAV, per se. More concerning is this being part of a trend since the end of 2020 when book value was £7,531 million and fell especially hard – down 41% from 2021 to 2022. Yet Aviva, Legal & General and M&G are similarly guilty over the last four years or so.
Unlike near-term profitability measures, however, a deterioration in asset-backing lowers the company’s ability to shoulder risk generally, hence it is appropriate how the share has fallen because risk has risen.
Page 11 of the full interim release says (within a section on shareholders’ equity) “economic variations in the first half reflect the outcome of our hedging programme, designed to protect our cash and Solvency II capital, and supports our progressive and sustainable dividend policy...the resulting IFRS loss after tax drove shareholders’ equity lower...”
We therefore quite oddly see a hedging programme in support of dividends, helping push a financial group into net loss and compromised NAV. Some investors may feel such a situation implies the share is off-limits.
- The Income Investor: an appealing cyclical dividend stock
- Sign up to our free newsletter for investment ideas, latest news and award-winning analysis
- Dividend play M&G suffers profit miss but inflows surprise
As I was writing this article, an opinion piece by strategist Joachim Klement was published, arguing that “the UK and Europe stand a fair chance of halting the rise in bond yields in 2026, the US not so much”.
If that is a fair scenario, what might it imply for profit and loss and underlying asset values in these big pension/insurance liability managers? Good for UK government bonds (gilts) but a hairy ride for US Treasury bond returns perhaps.
Trust Phoenix’s attractive macro context?
Supposedly, only 14% of UK people are on track for the retirement they require. Our long-term savings and retirement market is estimated at £3.6 trillion and growing by £280-300 billion annually across workplace, retail and annuity sales due to demographics and people taking more responsibility for their pensions.
Phoenix is mid-way through a three-year objective from March 2024 to become the UK’s leading retirement savings and income business. Presently, it has one-fifth of UK adults as customers, and management claims that it is well-positioned to take further share.
- Is the 4% rule still reliable as a safe withdrawal strategy?
- What to consider before gifting your pension to swerve IHT
Mind you, such arguments have applied in recent years when asset manager shares got hammered by net client outflows, although in principle, decades-long pension planning involves stickier revenues. In practice, Phoenix’s last five-year revenue profile has a way to go to establish a growth trend.
Puts emphasis on a teasing dividend yield
This kind of share is not good for people who think you get snared on unpredictable, unquantifiable risks that make for earnings volatility and the market pricing for high yield as compensation.
But for investors less concerned by total return (for inheritance perhaps) and seeking reasonable assurance of material dividend income, a case certainly exists for examining Phoenix. Its projected earnings cover is slightly better than Legal & General, where the 2025 number is expected just shy of the payout and 1.1x covered in 2026. As I have explained, however, such finessing is quite daft considering the scope for big swings within income statements.
Otherwise in price/earnings (PE) terms, Phoenix trades on a forward multiple around 9x, similar to Legal & General and M&G, while the more respected Aviva is over 11x.
What makes me wary to assert a “Buy” rating right now is the propensity for the UK fiscal situation to worsen if we really are in the proverbial “debt doom loop” where the 26 November Budget raises taxes that crimp activity and HMRC’s tax take.
The gilt market also has more than two months to fret further, which helps explain volatility among big pension providers given their large gilt portfolios, although they could rebound once there’s clarity.
A near-term “hold” on Phoenix and the sector generally for income-seekers is a bit of a cop-out, but you should recognise why yields are up at 9%.
Edmond Jackson is a freelance contributor and not a direct employee of interactive investor.
These articles are provided for information purposes only. Occasionally, an opinion about whether to buy or sell a specific investment may be provided by third parties. The content is not intended to be a personal recommendation to buy or sell any financial instrument or product, or to adopt any investment strategy as it is not provided based on an assessment of your investing knowledge and experience, your financial situation or your investment objectives. The value of your investments, and the income derived from them, may go down as well as up. You may not get back all the money that you invest. The investments referred to in this article may not be suitable for all investors, and if in doubt, an investor should seek advice from a qualified investment adviser.
Full performance can be found on the company or index summary page on the interactive investor website. Simply click on the company's or index name highlighted in the article.
Disclosure
We use a combination of fundamental and technical analysis in forming our view as to the valuation and prospects of an investment. Where relevant we have set out those particular matters we think are important in the above article, but further detail can be found here.
Please note that our article on this investment should not be considered to be a regular publication.
Details of all recommendations issued by ii during the previous 12-month period can be found here.
ii adheres to a strict code of conduct. Contributors may hold shares or have other interests in companies included in these portfolios, which could create a conflict of interests. Contributors intending to write about any financial instruments in which they have an interest are required to disclose such interest to ii and in the article itself. ii will at all times consider whether such interest impairs the objectivity of the recommendation.
In addition, individuals involved in the production of investment articles are subject to a personal account dealing restriction, which prevents them from placing a transaction in the specified instrument(s) for a period before and for five working days after such publication. This is to avoid personal interests conflicting with the interests of the recipients of those investment articles.