Stockwatch: is this the latest chart pattern to back?
After encouraging annual results, this company has extended its recovery to new multi-year highs. Analyst Edmond Jackson likes the look of this small-cap share.
28th November 2025 11:03
by Edmond Jackson from interactive investor

On 3 October, I drew attention to pub shares trading cheaply relative to tangible net asset value, in particular Marston's (LSE:MARS) at 0.6x at 39.5p a share and Aquis-listed Shepherd Neame Ltd (AQUIS:SHEP) at 0.4x.
From May to early June, Marston’s had achieved a like-for-like uptick in trading and recovered operating profitability of £19.0 million over 31 weeks. The consensus normalised earnings per share (EPS) expectation implied a near-doubling to 7.8p and, if realistic, a rise to 8.8p for the September 2026 year, a 12-month forward price/earnings (PE) ratio of just 4.5x.
- Invest with ii: Top UK Shares | Share Tips & Ideas | Open a Trading Account
A chief reason for this rating was £1,254 million of net debt accumulated in expansionary years, relative to a £250 million market capitalisation, the interim results showing net interest swiping 68% off operating profit. While this made me cautious about a “buy” stance, I drew attention to a trading update due on 8 October as a possible [source for] firming up of conviction and noted historic director share buying.
The situation is also interesting in terms of the validity of “bowl” chart patterns, where Marston’s has exhibited this classic bullish form in the last three years:
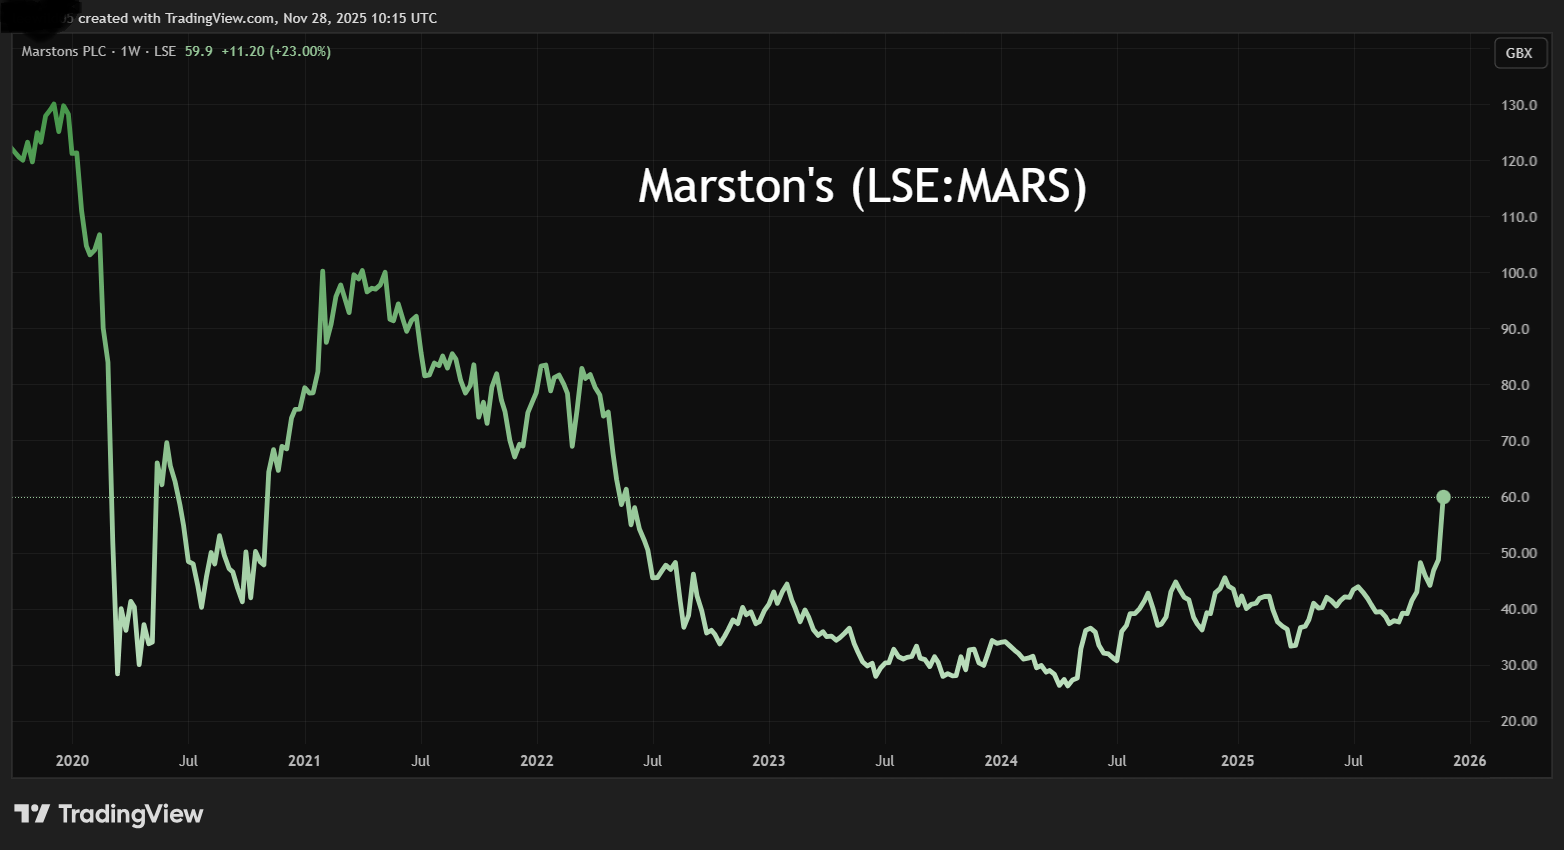
Source: TradingView. Past performance is not a guide to future performance.
The 8 October update in respect of the financial year to 27 September, elicited underlying pre-tax profit ahead of market expectations and free cash flow past a £50 million target, ahead of schedule.
However, like-for-like sales were up only 1.6%, barely matching inflation. Year-end net debt was not cited, just a comment that it was below 5x EBITDA (earnings before interest, tax, depreciation and amortisation).
Is this a tell-tale sign of decent Christmas trading statements ahead?
The shares had advanced steadily from 39p to 48p by the end of October, slipped to 44p in November, but enjoyed a 20% spike on Tuesday. They are currently 60p after this week’s annual results were essentially in line with October’s update but included a tease about how Christmas bookings were up 11% year-on-year.
- Autumn Budget 2025: everything you need to know
- These dividend stocks will deliver £7.3bn Christmas windfall
This is interesting – with wider relevance – given that it hints that UK consumers may be less strapped and willing to spend. Might it be a tell-tale for decent-enough Christmas trading statements, hence new-year upside in selective retail shares?
It also appears to validate my feeling about how Marston’s marketing position is a good one for straightened times, offering good value food and drink for people trading down from restaurants. At least this could imply enough revenue resilience to generate cash both to fund refurbishments and steadily pay down debt.
Reducing financial risk is an essential driver
While Marston’s is no growth share, my sense is that if the company can grind down its debt in the years ahead, this will improve the share price discount to net assets.
Annual operating profit is up a modest, if decent, 9% to £160 million, with an amply respectable 20% margin up from 17%. At the pre-tax level, profit is up 71% to £72 million, marking “a second consecutive year of significant profit growth driven by our progress on like-for-like sales, contribution from new formats, cost control and lower interest costs”.
This helped recurring free cash flow rise 22% over £53 million, ahead of target and schedule.
The nine-year table shows a strong record of operating cash flow being maintained despite pre-2022 involving relatively high levels of capital expenditure. More recently, and especially this last financial year, free cash flow per share has been 2.6x normalised EPS.
Marston’s - financial summary
Year-end 29 Sep
| 2017 | 2018 | 2019 | 2020 | 2021 | 2022 | 2023 | 2024 | 2025 | |
| Turnover (£ million) | 992 | 1,140 | 784 | 516 | 402 | 800 | 872 | 899 | 898 |
| Operating margin (%) | 17.0 | 11.7 | 10.3 | -55.7 | -26.6 | 18.2 | 10.3 | 16.9 | 20.0 |
| Operating profit (£m) | 168 | 133 | 80.3 | -287 | -107 | 146 | 90.2 | 152 | 180 |
| Net profit (£m) | 84.7 | 45.0 | -17.7 | -360 | 163 | 137 | -9.3 | -18.5 | 71.6 |
| EPS - reported (p) | 14.1 | 7.0 | -5.9 | -55.1 | -20.3 | 21.4 | -3.0 | 2.8 | 11.1 |
| EPS - normalised (p) | 16.7 | 15.3 | 6.0 | 3.3 | -0.4 | 13.1 | 4.8 | 4.0 | 8.3 |
| Operating cashflow/share (p) | 35.5 | 28.5 | 30.9 | 24.7 | 5.5 | 20.9 | 22.3 | 32.7 | 30.9 |
| Capital expenditure/share (p) | 32.6 | 25.4 | 21.2 | 10.1 | 7.4 | 10.9 | 10.3 | 7.3 | 9.5 |
| Free cashflow/share (p) | 2.9 | 3.1 | 9.8 | 14.7 | -1.9 | 10.0 | 12.0 | 25.4 | 21.4 |
| Dividends per share (p) | 7.5 | 7.5 | 7.5 | 0.0 | 0.0 | 0.0 | 0.0 | 0.0 | 0.0 |
| Covered by earnings (x) | 1.9 | 0.9 | -0.8 | 0.0 | 0.0 | 0.0 | 0.0 | 0.0 | 0.0 |
| Return on total capital (%) | 6.6 | 5.2 | 3.3 | -13.0 | -4.9 | 6.5 | 4.1 | 7.7 | 8.7 |
| Cash (£m) | 175 | 161 | 39.6 | 36.6 | 29.8 | 25.1 | 24.0 | 40.0 | 35.9 |
| Net debt (£m) | 1,329 | 1,386 | 1,399 | 1,639 | 1,610 | 1,600 | 1,574 | 1,266 | 1,206 |
| Net assets (£m) | 931 | 919 | 774 | 249 | 406 | 648 | 640 | 655 | 791 |
| Net assets per share (p) | 147 | 145 | 122 | 39.3 | 64.1 | 102 | 101 | 103 | 125 |
Source: company accounts.
The headlined reduction in net debt excluding leases is modest - down 5% to £838 million – which marks a slowing in context of more than a 30% reduction since the September 2022 year. From the balance sheet, total net debt was £1,206 million, down barely 4% year-on-year.
Net gearing remains ostensibly high at 157% but is improving, helped by a 5% upwards revaluation in the freehold estate to £2,181 million. Net tangible assets per share up over 20% to 120p, are probably also helping the shares rise, given a 50% discount currently, while the operations narrative sounds encouraging.
Useful initiatives to attract and retain customers
Management proclaims a “record reputation” score up from 800 to 816 based on guest satisfaction. Thirty-one format conversions during the financial year achieved specific revenue uplifts of 23% (if implying falls elsewhere and/or a reduction in falls given group revenue is near static). When pub groups say this kind of thing it seems vague as to whether the expenditure/initiatives were required chiefly to remain competitive, or if there is upshot for growth.
Anyway, there is an accelerated capital expenditure programme for the September 2026 year, with a significant step-up in refurbishments, so perhaps this can help group revenue growth beat inflation.
Marston’s also talks of a “demand-driving event programme”, which older drinkers might associate with bingo nights but now includes Trivial Pursuit “win a wedge”, Paddington in Peru and Cool Hand Cup darts. An enhanced order and pay platform is said to have helped a 10% increase in spend per guest. It’s hard to assume improvements are all linked to this but, if so, it is impressive.
All this appears to affirm the appointment of Justin Platt as CEO from early 2024, with more than 30 years of experience in hospitality and consumer-facing businesses, most recently as strategy chief of Merlin Entertainments.
Background of continued rising costs under Labour
The share price strength is intriguing given the context this week of a 4.1% rise in the UK minimum wage to £12.71 an hour. The hospitality trade has frequently complained about higher costs.
Yet Marston’s results proclaim a “Right People, Right Time” labour model offsetting National Insurance and minimum wage increases, demonstrating an ability to absorb external cost pressures and protect margins, with further opportunity ahead.
Other pub bosses have warned, however, of sharp increases in business rates payments going into 2026, where a new system from April will see rate multipliers for retail, hospitality and leisure firms set 5p lower than the standard rate with no cap as currently applies at £110,000 per business.
But one tax advisory firm has suggested the change, plus an increase in rateable values for most pubs, will result in a sharp annual increase – two-thirds for the average pub to near £15,400. An inflation-linked increase in alcohol duty will also make running pubs more expensive.
- Why Shell shares have just been downgraded
- Sign up to our free newsletter for investment ideas, latest news and award-winning analysis
Marston’s emphasises being “well-positioned for a strong festive period” with, as a mid-year teaser, the 11 June to 19 July FIFA World Cup.
As ever in retail, the question is what happens to consumer demand when bills start landing in January. However, such fears proved generally overdone in early 2025.
No short selling, instead a new disclosed private shareholder
On 28 October, it was disclosed that US private investor Bradley Louis Radoff had accumulated a 3.0% stake (this being the threshold for disclosure), which seems encouraging in terms of how he perceives value.
On the short selling side, there is nothing nowadays over the 0.5% threshold. From 2013 to 2023, disclosed shorting varied from 1% up to 5% of issued share capital, but then petered out. It shows how attention to shorting can be useful for long-only investors given that Marston’s fell from around 160p some 10 years ago, bottoming out at 27p in April 2024. Since then, it has been in a volatile, gently upward trend until this spike from around 45p.
Marston’s micro-economic credentials therefore look promising, with a steady reduction in manageable debt enabling improvement in a big discount to assets. The group is well-positioned marketing-wise, although one must be mindful of extra government taxes on business.
Overall, and while a share price spike can settle back near-term, I am inclined to think fundamentals and the chart pattern imply a “buy” stance for patient investors.
Edmond Jackson is a freelance contributor and not a direct employee of interactive investor.
These articles are provided for information purposes only. Occasionally, an opinion about whether to buy or sell a specific investment may be provided by third parties. The content is not intended to be a personal recommendation to buy or sell any financial instrument or product, or to adopt any investment strategy as it is not provided based on an assessment of your investing knowledge and experience, your financial situation or your investment objectives. The value of your investments, and the income derived from them, may go down as well as up. You may not get back all the money that you invest. The investments referred to in this article may not be suitable for all investors, and if in doubt, an investor should seek advice from a qualified investment adviser.
Full performance can be found on the company or index summary page on the interactive investor website. Simply click on the company's or index name highlighted in the article.
Disclosure
We use a combination of fundamental and technical analysis in forming our view as to the valuation and prospects of an investment. Where relevant we have set out those particular matters we think are important in the above article, but further detail can be found here.
Please note that our article on this investment should not be considered to be a regular publication.
Details of all recommendations issued by ii during the previous 12-month period can be found here.
ii adheres to a strict code of conduct. Contributors may hold shares or have other interests in companies included in these portfolios, which could create a conflict of interests. Contributors intending to write about any financial instruments in which they have an interest are required to disclose such interest to ii and in the article itself. ii will at all times consider whether such interest impairs the objectivity of the recommendation.
In addition, individuals involved in the production of investment articles are subject to a personal account dealing restriction, which prevents them from placing a transaction in the specified instrument(s) for a period before and for five working days after such publication. This is to avoid personal interests conflicting with the interests of the recipients of those investment articles.