Stockwatch: what next for BT and Vodafone shares?
After successfully backing both these FTSE 100 telecom stocks to do well in recent years, analyst Edmond Jackson decides to adjust his view on one of them.
26th August 2025 11:59
by Edmond Jackson from interactive investor

Illuminated Vodafone logo at the Mobile World Congress in Barcelona, Spain, March 2025. Credit: Xavi Torrent/Getty Images.
Are the 2025 rallies in FTSE 100 shares BT Group (LSE:BT.A) and Vodafone Group (LSE:VOD) justified or vulnerable to profit-taking – especially if markets lose their exuberance?
Adjusting for an early April drop and rebound in relation to US tariffs, the UK index is up nearly 10% from 8,495 at the end of April to 9,266 currently. Over the same time frame, BT has risen 24% from 172p and Vodafone by 23% from 72p, implying an outperformance that has been significantly driven by reallocation to London-listed telecom giants.
- Invest with ii: Top UK Shares | Share Tips & Ideas | Open a Trading Account
By way of comparison, Deutsche Telekom AG (XETRA:DTE) has managed just a 2% rise from €31 with its 7 August half-year results despite numbers in line with expectations; a concern being second-quarter weakness in its domestic market. Mind you, Germany is Vodafone’s largest market constituting 35% of its service revenue, which was 82% of group total in the March 2025 financial year.
BT and Vodafone’s charts are similar in 2025, although Vodafone is recovering from a sharper de-rating post 2021-22. On a five-year view, BT has broken out from 2021-22 highs around 200p, testing 223p in July versus 215p currently. This represents a 12-month forward price/earnings (PE) around 12x and a 3.9% prospective yield covered 2.1x by consensus earnings, exacted from an asset base of 130p per share, of which 96% constitutes goodwill/intangibles.
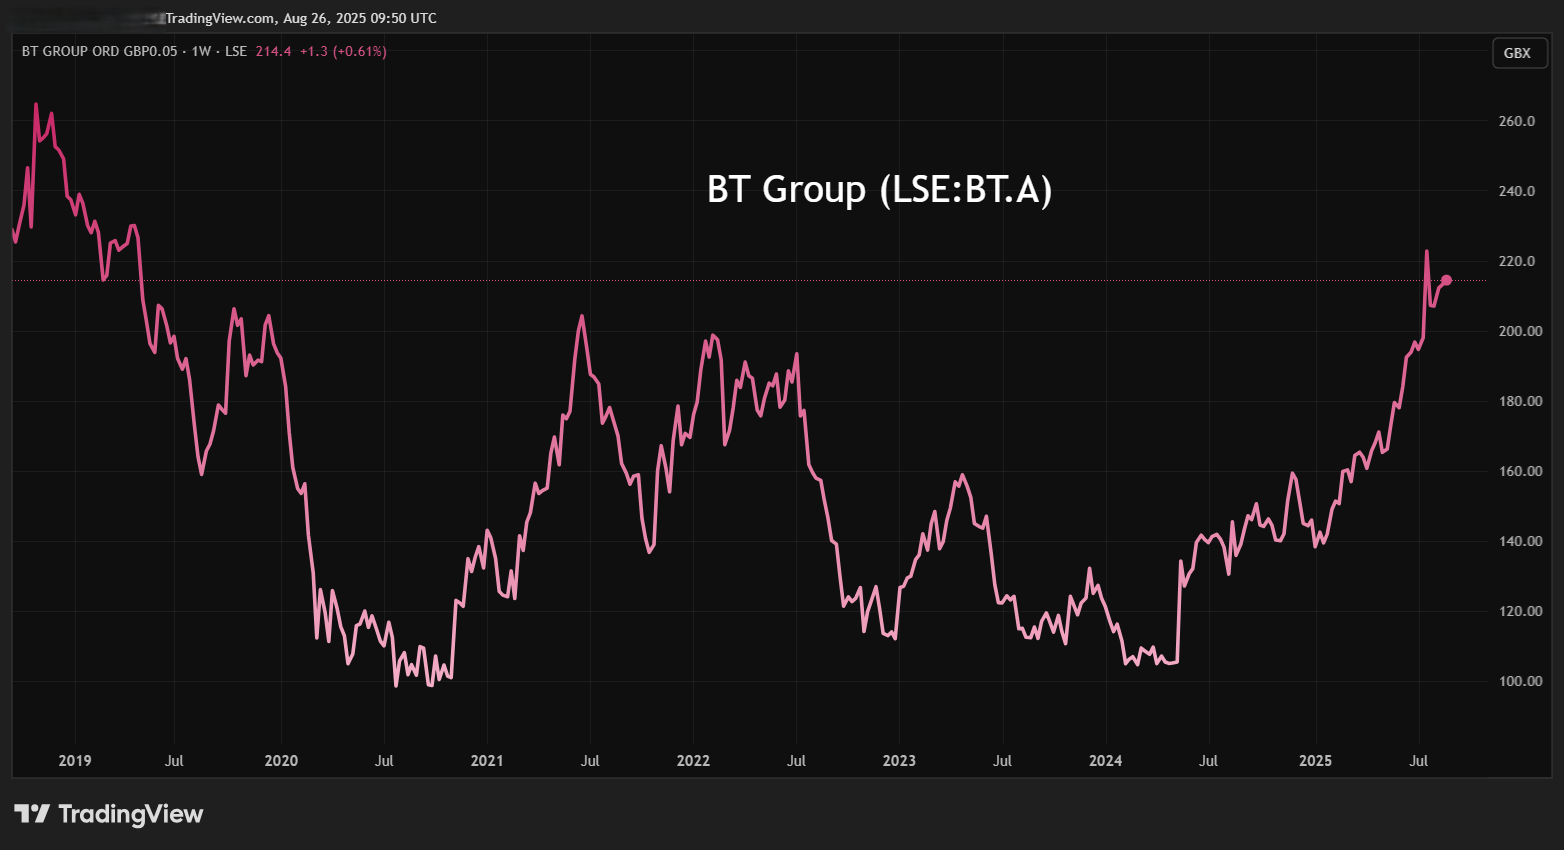
Source: TradingView. Past performance is not a guide to future performance.
Close to 88p currently, Vodafone’s forward PE is around 11.5x and the yield 5.0% covered around 1.8x by consensus earnings. It has the ostensibly stronger asset base - 183p net assets per share, with 62% constituting goodwill/intangibles.
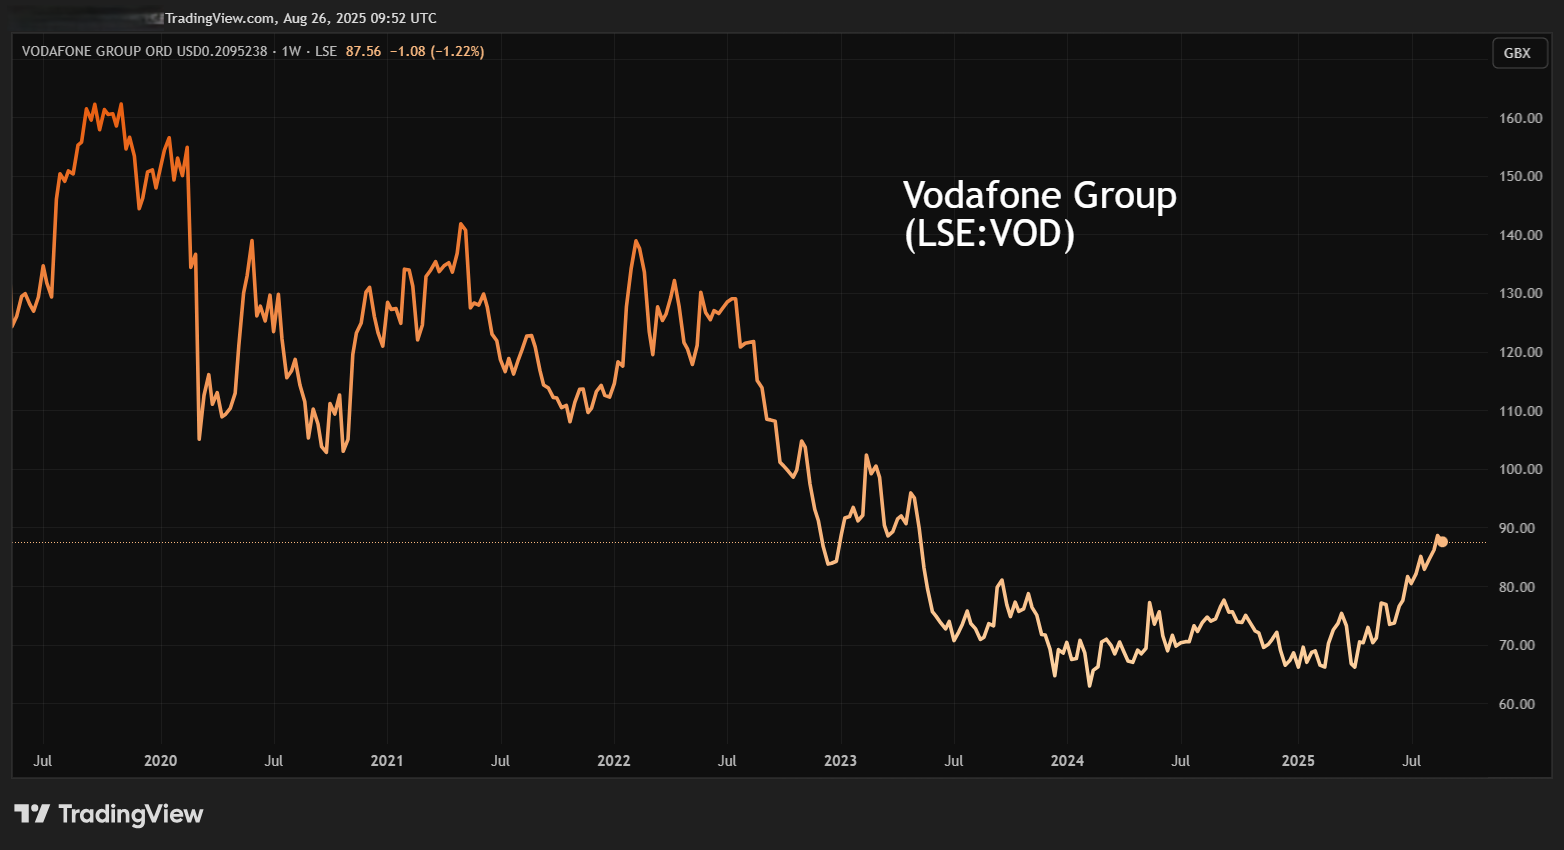
Source: TradingView. Past performance is not a guide to future performance.
You could say by way of initial comparison that the rallies are catch-up with Deutsche Telekom AG, which at €31.3 trades on around 13x expected earnings. DTE has, however, also rallied strongly since April from around €22 to €31.3 albeit in the context of an overall rally from 2022 versus UK shares de-rating:
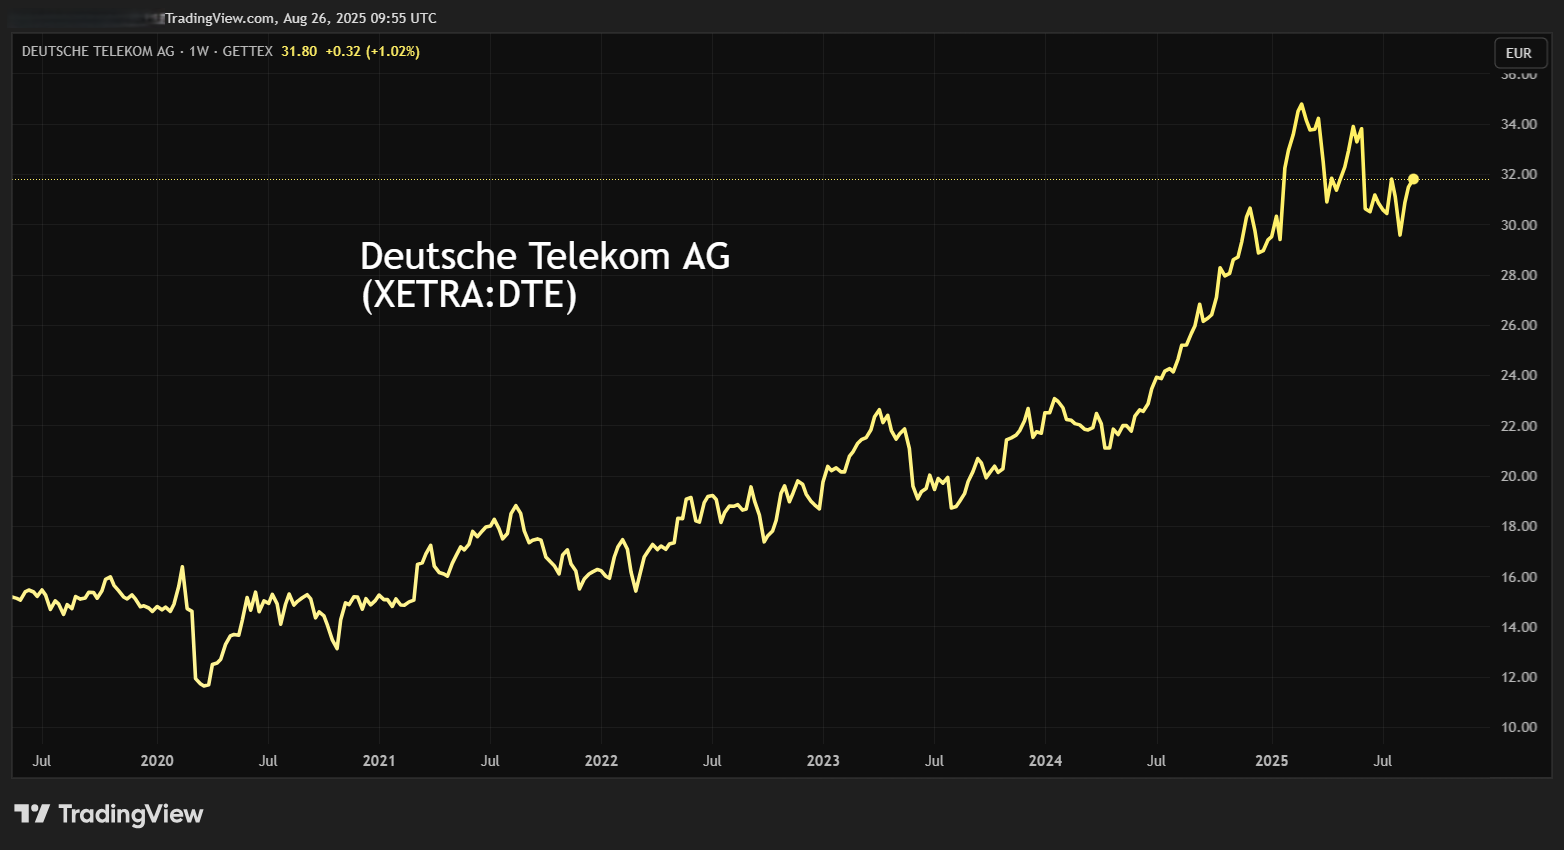
Source: TradingView. Past performance is not a guide to future performance.
Narratives from telecom giants are frequently a mixed bag
I concede that when previously drawing attention to BT and Vodafone as “buys”, this was initially in response to BT’s yield at 102p per share in October 2020, implying nearly 8%, with payouts guided to resume in the March 2022 financial year. Later with Vodafone at 67.7p in March 2024, the finance director bought over £1.7 million worth of shares at 69.6p and the chair £68,000 worth at 69p. This seemed too big to ignore despite the likelihood of any turnaround requiring time.
- ii view: BT’s big investment spend nears completion
- Insider: buying at FTSE 100 stock where selling is overdone
- ii view: Q1 results propel Vodafone shares to two-year high
I have updated retaining “buy” for example in July 2024 when BT was priced at 140p and Vodafone 72p. With both CEO’s narratives in a “much remains to be done” mode, you could interpret that positively by way of scope to improve but also requiring time. As for the investment rationale, there was a trigger for both shares too significant to ignore given that telecoms are a strongly cash-generative essential service industry.
In May, BT shares responded to the CEO proclaiming “an inflection to £2 billion normalised free cash flow in 2027 and £3 billion by the end of the decade”. Vodafone has demonstrated (see table below) a free cash flow record often substantially in excess of earnings. Yet the operations stories from both have often involved setbacks in some areas offsetting progress in others – enough to leave investors seeking total return wondering.
Vodafone - financial summary
year end 31 Mar
| 2016 | 2017 | 2018 | 2019 | 2020 | 2021 | 2022 | 2023 | 2024 | 2025 | |
| Revenue (€ million) | 49,810 | 47,631 | 46,571 | 43,666 | 44,974 | 43,809 | 37,010 | 37,672 | 36,717 | 37,448 |
| Operating margin (%) | 2.7 | 7.8 | 9.2 | -2.2 | 9.1 | 11.7 | 15.5 | 38.4 | 10.0 | -0.4 |
| Operating profit (€m) | 1,320 | 3,725 | 4,299 | -951 | 4,099 | 5,129 | 5,740 | 14,451 | 3,665 | -158 |
| Net profit (€m) | -5,405 | -6,297 | 2,439 | -8,020 | -920 | 59.0 | 2,237 | 11,838 | 1,140 | -4,169 |
| Reported EPS (euro cents) | -20.3 | -7.8 | 15.8 | -16.2 | -3.1 | 0.2 | 7.1 | 43.5 | 4.4 | -16 |
| Normalised EPS (cents) | -18.0 | -9.8 | 16.3 | -6.7 | -7.9 | 2.6 | 7.8 | 13.3 | 6.8 | -3 |
| Ops cashflow/share (cents) | 53.7 | 50.8 | 48.8 | 47.0 | 59.1 | 58.0 | 62.1 | 65.0 | 61.0 | 58.8 |
| Capex/share (cents) | 52.0 | 31.7 | 29.3 | 29.5 | 25.8 | 29.1 | 31.1 | 33.2 | 25.3 | 25.6 |
| Free cashflow/share (cents) | 1.7 | 19.2 | 19.5 | 17.5 | 33.2 | 28.9 | 31.0 | 31.8 | 35.7 | 33.2 |
| Dividend/share (cents) | 14.4 | 14.8 | 15.1 | 9.2 | 8.9 | 9.2 | 9.0 | 9.0 | 9.0 | 4.6 |
| Earnings cover (x) | -1.4 | -0.5 | 1.1 | -1.8 | -0.4 | 0.0 | 0.8 | 4.8 | 0.5 | -3.5 |
| Return on capital (%) | 1.0 | 3.3 | 4.0 | -0.8 | 3.0 | 4.1 | 4.8 | 11.9 | 3.0 | -0.1 |
| Cash (€m) | 18,259 | 14,955 | 13,469 | 26,649 | 20,646 | 14,980 | 15,427 | 18,722 | 11,275 | 18,425 |
| Net debt (€m) | 38,793 | 31,314 | 29,512 | 26,306 | 54,279 | 52,780 | 54,665 | 47,668 | 45,712 | 34,718 |
| Net asset value (€m) | 83,325 | 72,200 | 67,640 | 62,218 | 61,410 | 55,804 | 54,783 | 63,399 | 59,966 | 52,745 |
| Net asset value/share (cents) | 314 | 271 | 254 | 228 | 229 | 198 | 193 | 235 | 221 | 211 |
Source: historic company REFS and company accounts.
BT’s pension liabilities – around three times its market capitalisation as of last year’s calculations, with the deficit increasing – have also impeded perception, while Vodafone’s should nowadays be fully funded. Moreover, BT’s March year-end net gearing was around 160%, its net interest charge swallowing 29% of operating profit. Vodafone’s net gearing is around 66%, generating a €1,067 million (£922 million) annual net interest charge, which extended its operating loss to a €4,169 million net loss to March 2025.
BT Group - financial summary
year end 31 Mar
| 2016 | 2017 | 2018 | 2019 | 2020 | 2021 | 2022 | 2023 | 2024 | 2025 | |
| Revenue (£ million) | 18,879 | 24,082 | 23,746 | 23,459 | 22,824 | 21,370 | 20,845 | 20,715 | 20,835 | 20,370 |
| Operating margin (%) | 17.9 | 12.3 | 13.3 | 14.0 | 13.8 | 12.0 | 13.4 | 12.6 | 10.0 | 11.3 |
| Operating profit (£m) | 3,384 | 2,957 | 3,163 | 3,282 | 3,143 | 2,569 | 2,784 | 2,614 | 2,093 | 2,295 |
| Net profit (£m) | 2,466 | 1,908 | 2,032 | 2,159 | 1,734 | 1,472 | 1,274 | 1,905 | 855 | 1,054 |
| Reported EPS (p) | 28.3 | 19.1 | 20.4 | 21.6 | 17.4 | 14.6 | 12.6 | 18.9 | 8.6 | 10.6 |
| Normalised EPS (p) | 35.3 | 33.1 | 29.6 | 28.4 | 21.3 | 20.5 | 17.2 | 27.7 | 22.2 | 22.2 |
| Operating cashflow/share (p) | 59.1 | 61.8 | 49.5 | 42.7 | 62.9 | 59.2 | 58.3 | 66.9 | 59.5 | 70.2 |
| Capital expenditure/share (p) | 28.0 | 31.5 | 33.8 | 36.9 | 41.2 | 48.7 | 45.5 | 52.8 | 49.7 | 49.6 |
| Free cashflow/share (p) | 31.1 | 30.3 | 15.7 | 5.8 | 21.7 | 10.5 | 12.9 | 14.1 | 9.8 | 20.6 |
| Dividend/share (p) | 14.0 | 15.4 | 15.4 | 15.4 | 4.6 | 0.0 | 7.7 | 7.7 | 8.0 | 8.2 |
| Earnings cover (x) | 2.0 | 1.2 | 1.3 | 1.4 | 3.8 | 0.0 | 1.6 | 2.5 | 1.1 | 1.3 |
| Return on equity (%) | 45.2 | 20.7 | 22.3 | 21.5 | 13.9 | 11.1 | 9.5 | 12.8 | 6.3 | 8.3 |
| Cash (£m) | 3,914 | 2,048 | 3,550 | 4,880 | 6,641 | 4,652 | 3,456 | 3,940 | 2,780 | 2,814 |
| Net debt (£m) | 10,847 | 10,665 | 10,725 | 11,996 | 19,253 | 18,185 | 18,489 | 19,940 | 20,701 | 20,519 |
| Net asset value (£m) | 10,112 | 8,335 | 9,911 | 10,167 | 14,763 | 11,679 | 15,296 | 14,514 | 12,518 | 12,908 |
| Net asset value/share (p) | 102 | 84 | 100 | 102 | 149 | 118 | 154 | 146 | 126 | 130 |
Source: historic company REFS and company accounts.
Such financial liabilities have previously – and justifiably – weighed on sentiment, hence it is interesting how both shares have shrugged them off in rallying consistently from April. They reflect how the overall market mood has become “risk-on”, which one might say also applies to the reality of US tariffs and the UK’s dire fiscal position.
German investors seek excuse to take profits
Deutsche Telekom has been in a correction phase; its shares extended to €29.50 after the 7 August interims despite domestic revenue only 1.3% easier amid stronger competition. This will always be a liability for telecoms in any developed market. Vodafone’s Q1 2026 update on 24 July reiterated this in mobile, which was nearly counterbalanced by growth in German wholesale. In term of reported revenue, however, Germany slipped 3.2% like-for-like having been down 6.0% in Q4 (January to March) due to a change in TV law.
It begs the question if such a “normalised” view is fair – albeit certainly appropriate to detail – given occasional changes like this are inherent to the industry and affect shareholder value.
I favour Vodafone in comparison with Deutsche, possibly BT as well, given its developing countries’ exposure where growth looks to have traction. Africa has seen organic service growth up 13.8% after 13.5% in Q4, driven by demand for data and financial services. Its business services side grew 4% in Q1 amid strong demand for digital services across Europe and Africa.
- Shares for the future: new ranking for this FTSE 100 stock
- Stockwatch: buy the drop in this hot stock?
But lower international sales were blamed by BT at its annual results for a 2% slip in revenue, with profit and free cash flow growth rescued by cost control and transformation initiatives.
Utility-type revenues are generally seen as defensive in the UK given that contracts are pegged to the inflation rate and it can be a hassle to switch provider. While BT can be undercut by cheaper rivals, I find the overall package and benefits for broadband and mobile hard to beat, so perhaps I exemplify why BT has quality UK consumer revenues.
Yet Vodafone’s Q4 growth of 3.1% eased to 0.9% in Q1 of the March 2026 year due to a decline in business revenues, despite growth in consumer and wholesale. Business-related operations would seem exposed if the chancellor weighs in with further taxation this autumn, rather than primarily targeting individuals. At least Vodafone’s merger with Three at the end of 2024 should provide scope to enhance service which could mitigate risk of a UK stagflation scenario.
Options exercising and share selling at BT
Commercial twists explain why share traders largely default to essential signals such as yield, director dealings and price charts.
In that respect I question BT’s ongoing momentum given that four of its executive directors have been exercising options and selling shares at 109p to 222p since June. Yes, some of this is only to pay tax arising and keep the shares remaining, but from four substantive share sales around option exercising, the CEO looks to be a net seller into recent strength.
Options-related activity can be tricky to interpret because executives often sell them out anticipating fresh grants, but that reinforces how directors and shareholders face risk/reward unequally, with directors eliminating downside risk then being awarded exposure to upside.
Yes, seven Vodafone executives have also exercised options and sold shares at around 83p on 28 July, although these were part-sales to pay tax on the gain from 0p options. It was also encouraging how, from May and June, six executives bought a total £767,000 worth of shares in the market just like anyone else.
Tilting to favour Vodafone for now
This is an essential view but in terms of Vodafone’s overall growth potential – Africa, and “something new” by way of the Three merger – it's possibly lower financial risk than BT, plus there's genuine director buying, so I retain a “buy” stance. You might wish to see whether Mr Market is generally overdue a tantrum, and if the price retreats a bit.
Much for both FTSE 100 shares depends on the overall market context, where in due respect BT is firming at over 214p this morning despite jitters over President Donald Trump firing a Federal Reserve governor. A near 4% prospective yield looks fairly priced – if not at its best – for industry risks, hence I adjust to “hold”.
Edmond Jackson is a freelance contributor and not a direct employee of interactive investor.
Head of ii Editorial Lee Wild owns BT shares.
These articles are provided for information purposes only. Occasionally, an opinion about whether to buy or sell a specific investment may be provided by third parties. The content is not intended to be a personal recommendation to buy or sell any financial instrument or product, or to adopt any investment strategy as it is not provided based on an assessment of your investing knowledge and experience, your financial situation or your investment objectives. The value of your investments, and the income derived from them, may go down as well as up. You may not get back all the money that you invest. The investments referred to in this article may not be suitable for all investors, and if in doubt, an investor should seek advice from a qualified investment adviser.
Full performance can be found on the company or index summary page on the interactive investor website. Simply click on the company's or index name highlighted in the article.
Disclosure
We use a combination of fundamental and technical analysis in forming our view as to the valuation and prospects of an investment. Where relevant we have set out those particular matters we think are important in the above article, but further detail can be found here.
Please note that our article on this investment should not be considered to be a regular publication.
Details of all recommendations issued by ii during the previous 12-month period can be found here.
ii adheres to a strict code of conduct. Contributors may hold shares or have other interests in companies included in these portfolios, which could create a conflict of interests. Contributors intending to write about any financial instruments in which they have an interest are required to disclose such interest to ii and in the article itself. ii will at all times consider whether such interest impairs the objectivity of the recommendation.
In addition, individuals involved in the production of investment articles are subject to a personal account dealing restriction, which prevents them from placing a transaction in the specified instrument(s) for a period before and for five working days after such publication. This is to avoid personal interests conflicting with the interests of the recipients of those investment articles.