Time for Barclays to break out of the doldrums?
The banking group’s share price has been static, but that could be about to change.
18th January 2021 08:32
by Alistair Strang from Trends and Targets
The banking group’s share price has been static, but that could be about to change.
Barclays
It's been three weeks since we last reviewed Barclays (LSE: BARC), and nothing has happened.
But is that about to change?
- Why Barclays shares face very real danger this Christmas
- Why reading charts can help you become a better investor
This week, Goldman Sachs (NYSE:GS) is due to announce earnings for 2020. Following JP Morgan’s (NYSE:JPM) numbers recently, analysts are getting fairly bullish about Goldman. We'd hope this shall herald the start of an earnings season where even the retail banks may experience some relief from their recent dismal performance.
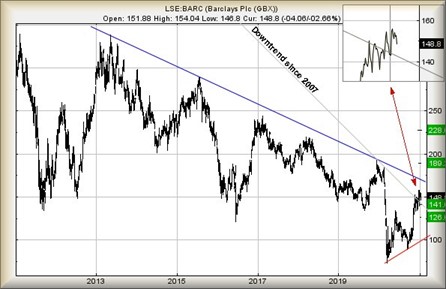
For instance, last month we provided criteria for Barclays giving an important target level of 161p. Unfortunately, the best achieved in the last three weeks has been a worrying 158p, making us suspect some weakness may be present.
Ideally, the share price needs to better 161p to give any real hope for the longer term, due to fairly realistic growth becoming difficult to avoid. Closure above 161p makes travel to an initial 189p very possible, with secondary calculating at a more encouraging longer-term 228p.
- UK bank shares: best opportunities in 2021
- Most-bought FTSE100 shares of 2020
- Why reading charts can help you become a better investor
As always, there's a fly in the ointment thanks to the blue downtrend on the chart. That line which dates back to the simpler days of 2013 when we were all trying to forget the banking crash a few years earlier.
Perhaps some folk will regard it as important, perhaps not. In current market conditions, conventional trend lines seem to lack importance. In any case, Barclays ended 2020 by breaking free from a bigger picture downtrend, one which dates back to 2007. Given price movements, it certainly appears the market was perfectly aware of this almost invisible trend line (see inset on chart).
The immediate situation is fairly benign, the price needing to move below 146p to suggest coming weakness to 141p. Only below 141p do things risk being problematic, as it would indicate the break from the trend has failed, risking the share again being trapped at the back of a cupboard with a secondary target level of 126p.
Source: Trends and Targets. Past performance is not a guide to future performance
Alistair Strang has led high-profile and "top secret" software projects since the late 1970s and won the original John Logie Baird Award for inventors and innovators. After the financial crash, he wanted to know "how it worked" with a view to mimicking existing trading formulas and predicting what was coming next. His results speak for themselves as he continually refines the methodology.
Alistair Strang is a freelance contributor and not a direct employee of interactive investor. All correspondence is with Alistair Strang, who for these purposes is deemed a third-party supplier. Buying, selling and investing in shares is not without risk. Market and company movement will affect your performance and you may get back less than you invest. Neither Alistair Strang or interactive investor will be responsible for any losses that may be incurred as a result of following a trading idea.
These articles are provided for information purposes only. Occasionally, an opinion about whether to buy or sell a specific investment may be provided by third parties. The content is not intended to be a personal recommendation to buy or sell any financial instrument or product, or to adopt any investment strategy as it is not provided based on an assessment of your investing knowledge and experience, your financial situation or your investment objectives. The value of your investments, and the income derived from them, may go down as well as up. You may not get back all the money that you invest. The investments referred to in this article may not be suitable for all investors, and if in doubt, an investor should seek advice from a qualified investment adviser.
Full performance can be found on the company or index summary page on the interactive investor website. Simply click on the company's or index name highlighted in the article.