10 of the best performing UK-listed stocks right now
"You don't need to be a rocket scientist [to invest]," - Warren Buffett. This simple strategy shows why.
19th June 2019 12:22
by Jack Brumby from Stockopedia
"You don't need to be a rocket scientist [to invest]," - Warren Buffett. This simple strategy shows why.

"You don’t need to be a rocket scientist. Investing is not a game where the guy with the 160 IQ beats the guy with 130 IQ."
— Warren Buffett
Another day, another Warren Buffett quote... He's right though. Successful investing can be relatively simple. Nowhere is this more obvious than in the persistent outperformance of relative strength (RS) strategies, where investors buy companies that have outperformed the wider market over a set period of time.
Imagine: investor A gets home from work, studiously notes up financial statements, trawls through the footnotes, follows the cash flows, makes the adjustments, finds the value, and places his bets. Investor B wakes up, turns on her computer, and simply buys what's gone up recently.
- Invest with ii: Top UK Shares | Share Prices Today | Open a Trading Account
The evidence over the years suggests Investor B's portfolio is likely to motor ahead.
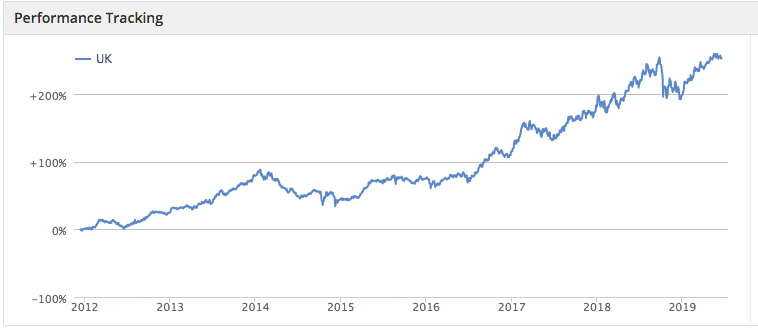
No surprise then, that Stockopedia's Price Momentum Screen is one of the top-performers over multiple timeframes. The screen is up 45% over two years and has staged a strong recovery so far in 2019, up nearly 25% since the start of January.
The screen itself is as simple as they come: take companies with positive six-month and one-year relative strengths and a negative one-month relative strength, and then sort the results in descending order of one-year relative strength. Investor B would be proud.
Here are the top 10 companies with the strongest one-year relative strength and a market cap of over £100 million:
| Name | Market cap | RS 1yr | RS 6m | RS 1m | Sector |
|---|---|---|---|---|---|
| Eco (Atlantic) Oil & Gas (LSE:ECO) | 162.4 | +141.3 | +81.2 | -15.7 | Energy |
| Serica Energy (LSE:SQZ) | 355.2 | +128.8 | +7.35 | -0.65 | Energy |
| AB Dynamics (LSE:ABDP) | 537.9 | +119.2 | +51.9 | -2.98 | Consumer Cyclicals |
| Churchill China (LSE:CHH) | 167.5 | +65.0 | +47.4 | -2.59 | Consumer Cyclicals |
| Marshalls (LSE:MSLH) | 1,309 | +61.8 | +31.7 | -1.48 | Basic Materials |
| San Leon Energy (LSE:SLE) | 176.1 | +61.3 | +45.3 | -4.19 | Energy |
| Coca-Cola European Partners (LSE:CCEP) | 21,172 | +56.9 | +15.5 | -0.25 | Consumer Defensives |
| IFG Group (LSE:IFP) | 198.1 | +55.7 | +28.5 | -1.13 | Financials |
| 4imprint (LSE:FOUR) | 727.4 | +51.4 | +26.2 | -4.41 | Consumer Cyclicals |
| Alpha FX (LSE:AFX) | 297 | +50.4 | +29.3 | -2.18 | Financials |
One thing to note about this screen is that, depending on the conditions, the very fastest moving stocks can sometimes be speculative and unpredictable. As a result, you can see slightly more exotic small-cap energy and technology names at times. But it can also pick up fast-moving, higher-quality plays as well. Some of those currently include stocks like AB Dynamics, Churchill China and 4imprint.
So, it's no surprise that relative strength is a measure that's appealed to some very successful investors over the years...
The legendary British investor Jim Slater generated 'spectacular' results by using relative strength in conjunction with his signature PEG ration (price/earnings-to-growth) and a price-to-cash flow measure in Beyond the Zulu Principle. Over a six-month sample period, his relative strength screen returned +34.5%, compared to +21.6% for his cash flow and low PEG screen, and just +8.9% for the market as a whole.
Jim O'Shaughnessy, meanwhile, documented his comprehensive study of factor strategies over a 44-year sample period in What Works on Wall Street. He found that not only was relative strength "among the only pure growth factors that actually beats the market consistently, and by a wide margin," but that "each of the ten best-performing strategies... includes relative strength criteria.
How to use relative strength effectively
High relative strength stocks do tend to have persistent positive momentum, especially over six and 12-month periods, but this is not a guarantee of success over these time frames. When high momentum stocks falter, the downside can be dramatic. A degree of emotional fortitude is required to weather share price volatility when a stock's direction of travel changes for the worse.
In fact, the study on which this screen is based found that, although top decile relative strength portfolios outperformed over six and 12-month periods, they went on to underperform in subsequent periods. Quarterly, semi-annual, or annual rebalancing of the portfolio might be one way to avoid the prospect of flagging momentum stocks.
Going back to Jim O'Shaughnessy's multi-strategy study of stock returns over a 44-year period in What Works on Wall Street, the American investor writes: "[Relative strength criteria in the 10 best-performing strategies] are always tied to another factor, usually one requiring the stocks to be modestly priced in terms of how much you are paying".
Over six-month and 12-month periods, winners generally continue to win and losers generally continue to lose. When it comes to adding momentum to your portfolio relative strength is a powerful tool - but it is best used in conjunction with some simple relative valuation measures such as the price-to-sales ratio or a composite Value Rank.
About Stockopedia

Stockopedia helps individual investors beat the stockmarket by providing stock rankings, screening tools, portfolio analytics and premium editorial. The service takes an evidence-based approach to investing, and uses the principles of factor investing and behavioural finance to help investors make better decisions.
Interactive Investor readers can get a free 14-day trial of Stockopedia by clicking here.
These investment articles are simply for generating ideas. If you are thinking of investing they should only ever be a starting point for your own in-depth research.
These articles are provided for information purposes only. Occasionally, an opinion about whether to buy or sell a specific investment may be provided by third parties. The content is not intended to be a personal recommendation to buy or sell any financial instrument or product, or to adopt any investment strategy as it is not provided based on an assessment of your investing knowledge and experience, your financial situation or your investment objectives. The value of your investments, and the income derived from them, may go down as well as up. You may not get back all the money that you invest. The investments referred to in this article may not be suitable for all investors, and if in doubt, an investor should seek advice from a qualified investment adviser.
Full performance can be found on the company or index summary page on the interactive investor website. Simply click on the company's or index name highlighted in the article.