Equity income ideas for your ISA
We identify trusts which offer long-term, dependable income streams for yield-hungry investors...
8th February 2019 13:45
This content is provided by Kepler Trust Intelligence, an investment trust focused website for private and professional investors. Kepler Trust Intelligence is a third-party supplier and not part of interactive investor. It is provided for information only and does not constitute a personal recommendation.
Material produced by Kepler Trust Intelligence should be considered a marketing communication, and is not independent research.
With 'ISA season' looming we identify investment trusts which offer long-term, dependable income streams for yield-hungry investors...

Income for the long haul
As the end of the financial year approaches, we enter 'ISA season'. In the first of several articles on generating income for an ISA investment, we look at the advantages of investing in equity income trusts. We explain why investment trusts can be useful for long-term, income-hungry investors, and the myriad benefits that the closed ended structure offers. We also identify trusts that best exploit the tools that investment trusts have to offer to achieve their income objectives, and illustrate how they may provide investors with a more dependable income stream for many years into the future.
Income, but on a deep discount
For investors looking to put capital to work this ISA season, a positive take away from the equity market falls we saw in the latter half of 2018 is that they have led to wider discounts among investment companies. The sell-off has left the average sector discount ending the year at 4.3% compared with 3.5% a year earlier (Source: Link Asset Services). With this said, over the past decade the average discount has stood at 6.7%, and the number of investment trusts trading on premiums is largely unchanged, falling only four to 113 (just over a third of the investment trust universe). However, there are several trusts trading on a discount well below their 12-month average. Two examples of this are Majedie Investments (LSE:MAJE) and Aberdeen Smaller Companies (LSE:ASCI), both of which offer higher yields to buyers today, because they trade at significant discounts.
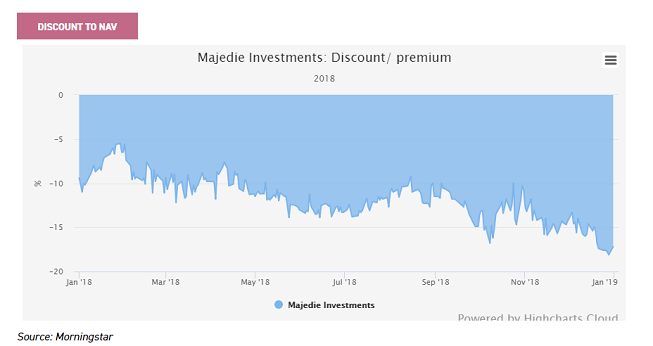
Majedie Investments is a long-established and broadly diversified investment trust, investing in seven highly-rated funds all managed by investment boutique Majedie Asset Management (in which the trust also owns a 17% stake, representing 30% of NAV). Other considerable holdings include a segregated fund (28.4%) which trades pari-passu with the MAM UK Equity Strategy, and the £1.3 billion MAM Tortoise Fund (14%) which is an absolute return focused long/short equity play.
In 2014, the trust was overhauled and the dividend re-based. Since then, the dividend has progressively increased, and is now 30% greater (2018: 11p)) than four years ago (2014: 7.5p). Despite this, the trust has seen its discount widen to all-time lows, and as can be seen below, has been trading at close to 20%. This offers investors an attractive entry point into a trust that offers a dividend yield of close to 5% and has significant revenue reserves.
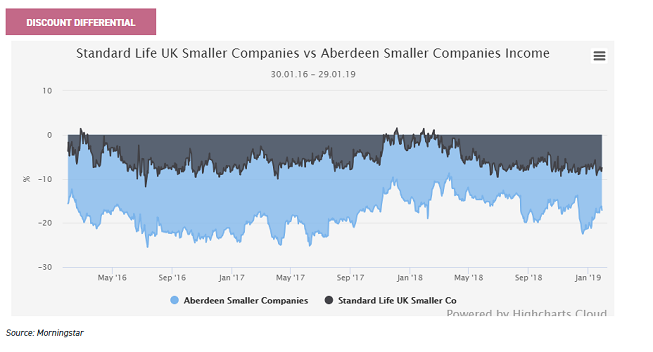
Aberdeen Smaller Companies Income (LSE:ASCI) has also seen its discount widen in 2018, again trading at close to -20% to NAV at one point, but this has since narrowed following a strong performance in January to 17%.
The company aims to generate income and capital growth from investing in UK smaller company equities, and at 31st Jan 2019 yields 2.9%, with a fully covered dividend. The trust sits in the AIC UK Equity and Bond Income sector, which in our view is perhaps a slight misnomer, given only 9% of NAV is in fixed income (mainly preference shares) which is more than offset by the 11% gearing.
In September 2018, the trust was taken over by Abby Glennie, one of two UK small cap managers on the Standard Life small cap team (the other being Harry Nimmo). The portfolio is constructed using the same quality and growth screens that Harry has used for many years, but with an added yield filter. Investors in the trust enjoy a not insignificant yield (certainly in the context of SLS which yields 1.6 and trades on a discount of 7.2%).
Yield boost
Historically, equity yields have been below those of fixed income because of their propensity to grow over time. After the financial crisis, quantitative easing changed all that and, for most of the past decade, gilt yields have been below those of equities. At the same time, companies have recognised the huge demand for income and, as a result, have been ramping up dividend payments. 2018 illustrated this, and companies in the UK paid out £99.8 billion (source: Link Asset Services) in dividends, beating the record that was set the year before. Underlying dividends (not including special dividends) grew by 8.7% (to £95.9 billion).
UK stocks now have a prospective yield of 4.8% according to Link Asset Services, 1.3% greater than the average over the past 30 years. The yield has only been this high twice in the past 18 years - at the bottom of the credit crunch, and during the 1991 recession.
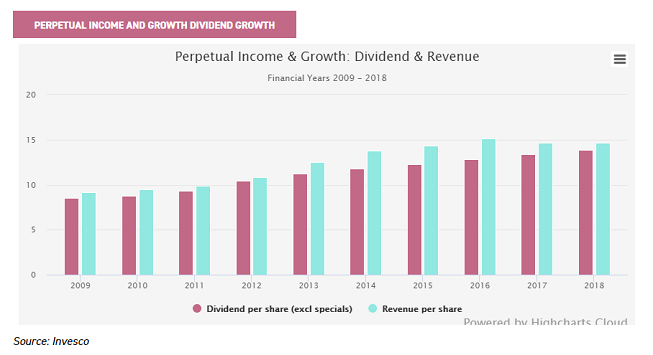
The general consensus, therefore, is for trouble ahead. However, with every challenge comes opportunity. One of these is Perpetual Income & Growth (LSE:PLI), where the trust's current discount of 10% serves to boost the already chunky dividend yield for new investors. The trust aims to provide shareholders with capital growth and real growth in dividends over the medium to longer term, from a portfolio of securities listed mainly in UK equity markets.
The trust currently yields a weighty 4.2% (on a historic basis), 0.2% greater than the UK Equity Income sector weighted average. Driven with a high-conviction, cautious style, the portfolio is comprised in the main of large, cash generative companies in which the manager – who invests with a long-term view – has built a position because he believes they offer the potential for dividend growth at an attractive valuation.
Therefore, there is no surprise that PLI has a strong track record as an income fund, having grown the dividend in each of the past 19 years. As can be seen below, dividend growth over the past ten years has been strong, and (excluding specials) over has been far stronger than RPI.
BlackRock Commodities Income (LSE:BRCI) on the other hand offers the sort of dividend yield usually associated with alternative income trusts, which typically trade at significant premiums. Currently yielding 5.6%, the trust has a highly concentrated portfolio of mainly equities in the mining and energy sectors.
The managers at BlackRock are highly experienced investors, being one of the largest specialist teams in the mining and natural resources sector globally. When we met with Olivia Markham recently, she re-stated her confidence in the strategy, with a large majority of the portfolio invested in diversified mining mega-caps and global integrated oil companies.
Typified by Royal Dutch Shell's (LSE:RDSB) recent Q4 results ("Shell's cash bonanza takes 2018 earnings to highest in 4 years"), the managers believe that these larger companies (in both mining and energy) are much more focused on shareholder returns, and with constrained cap-ex over the past few years, they will be "cash-machines" for the foreseeable future. The current 4p dividend was fully covered by earnings last financial year (to end November 2018), and the board have re-stated their commitment to it saying they are prepared to use both revenue and capital reserves should they need to. The trust currently trades on a discount of 6%, around the widest level it has been over ten years.
Income security
A defining characteristic of investment trusts is their ability to retain up to 15% of annual revenues in a reserve. Should there be a subsequent fall in the income the company receives from its investments, the board can use this reserve to ensure that the dividend is maintained. A common illustration of this was in 2010, with BP's Deepwater Horizon disaster. In response, BP (LSE:BP.) was required to suspend its dividend, dramatically hitting both open-ended funds and investment trust revenue accounts. However, in contrast to open-ended investment companies, most investment trusts were able to maintain a progressive dividend policy through dipping into reserves.
City of London (LSE:CTY) is a classic example of this, which sailed through the aftermath of the crisis – using its reserves – to continue onward in its trajectory of progressively increased dividends every year. This year marks the 52nd year of consecutive increases, 27 of them with Job Curtis at the helm. CTY is unique in having achieved this record of year on year increases over such a long timeframe.
It has been achieved through Job’s desire to invest in only those companies that have strong balance sheets, in share price terms offer a margin of safety, and have demonstrably sustainable cash generation to support both dividends and capital expenditure for the future growth of the company. Understanding that he is investing people's hard-earned savings, Job believes in maintaining a diversified portfolio, with around 100 holdings at any one time.
As such, Job is unlikely to be held hostage to fortune by one particular sector or stock in terms of overall revenues. Additionally, the trust has revenue reserve cover of 0.58x. In the event that equity income looks threatened, Job has the additional flexibility to harness fixed income or option writing to boost income. The shares currently yield 4.7% and trade close to par.
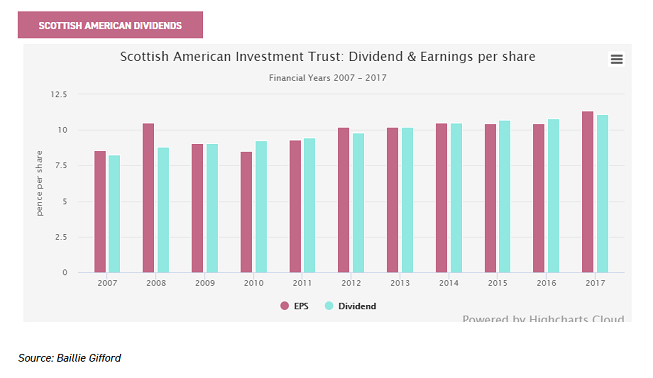
An example of a trust that proactively used its revenue reserves to great effect is Scottish American Investment Company (SAINTS). After a shift in strategy in 2015, SAINTS began to use its revenue reserves to maintain its progressive dividend, while the underlying portfolio and strategy was repositioned to better achieve its income objectives. This change came after the dividend level had become potentially unsustainable and, although this meant a lower portfolio yield in the short term, it has now allowed the trust the breathing space to shift its strategy, with the aim of continuing to grow its dividend on a more sustainable basis.
The hard work began to pay off in 2017, and as the graph below shows, the dividend was once again fully covered by earnings.
Diversification benefits
Alongside the benefits of a revenue reserve, investors might choose to harness the ability of the closed end structure to pay dividends from capital.
This can have tremendous income diversification benefits, given that investment trusts that may not necessarily have income producing strategies can pay dividends to investors, and thereby exhibit a very different return profile to the usual ‘income producing’ funds. This strategy has potentially even more relevance to ISA investors, given the tax neutral effect of the wrapper, and their therefore being indifferent whether income or capital is paid as a dividend.
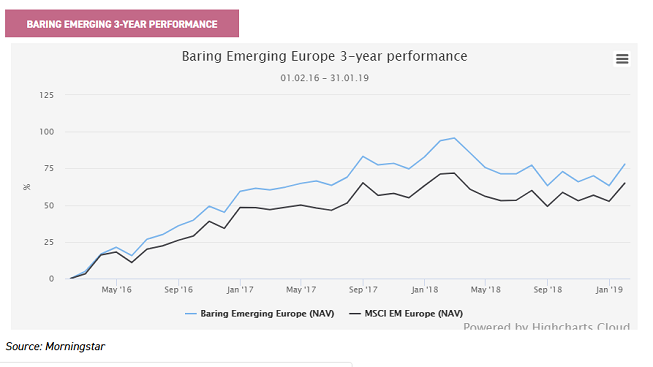
Baring Emerging Europe (BEE) is a leading example of this, sitting within a sector one might not naturally go to for income, and yet, paying a significant yield of 4.8% at the time of writing. The trust aims to offer long-term capital growth, principally through investment in quality emerging European companies with above-average growth.
The dividend has been given greater emphasis since the start of 2017, when shareholders gave permission to pay out capital as income.
The expectation was for around 1% of NAV to be paid out as income per annum to supplement the revenue return. This has meant that investors have witnessed a substantial increase in pay-outs.
Despite the substantial boost to the yield, the discount has continued to widen, and currently sits at close to 15%.
We would attribute this to the region being deeply out of favour – the index is trading on a P/E of just nine. Considering the trust is yielding close to 5%, and over the past three years has delivered returns of close to 80% - well ahead of global equity market returns over the same period of 50%, this pessimism could be overdone.
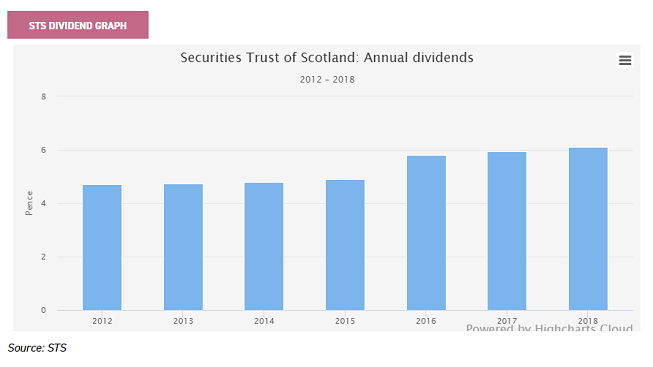
As with revenue reserves, capital can also help to offer a smooth progression of dividends as Securities Trust of Scotland (LSE:STS) has found.
The trust is a broadly diversified global equity income portfolio, with the aim of delivering a rising level of income and long-term capital growth from a diversified portfolio of equities.
In 2016, the board changed the dividend policy to allow a proportion of dividends to be paid from capital.
This has enabled a repositioning the portfolio towards stocks with stronger cashflow and growth characteristics.
The last financial year (to March 18), the trust made its first dividend payment from capital.
The trust currently offers a dividend yield of 3.8%, making it the third best payer in the sector behind JPMorgan Global Growth & Income (LSE:JPGI) (4.2%) and Murray International (LSE:MYI) (4.4%).
Despite this chunky yield, STS was trading on a discount of 6.3% as at 31 Jan 2019, wider than any other trust in the sector bar the tiny Blue Planet Investment Trust (LSE:BLP).
Another, perhaps more extreme example of how income portfolios can harness growth opportunities, without reducing the overall dividend level is International Biotechnology Trust (LSE:IBT).
The trust announced plans in September 2016 to convert some of the capital it generates into income, aiming to pay a yield of 4% of NAV.
As the chart below shows, the discount came in sharply since it did so, with the added benefit of the discount volatility being much reduced, making IBT a much more attractive investment.
The managers pursue a benchmark aware – but not constrained – stockpicking approach, looking for biotech companies that can generate strong top line growth, have limited competition, good pricing power, strong intellectual property and a clear medical need for their products.
Carl Harald Janson has been at the helm of the trust for over five years now, and in both NAV and share price terms the trust has done exceptionally well over this period.
In NAV total return terms the trust has outperformed the NASDAQ Biotechnology index by over 10%, returning 11.8%, with shareholders doing even better thanks to the closing of the discount. The shares currently yield 4.6% on a historic basis.
Invesco Perpetual UK Smaller Companies (LSE:IPU) also saw a similar re-rating when it was announced that the board was going to pay a significantly enhanced dividend, partly funded by the capital account in September 2016.
Like IBT, the trust, which yields 3.5%, has seen a narrower discount, and less discount volatility since the enhanced dividend policy was introduced. The trust now has among the highest yields in the UK smaller companies sector, achieved without changing the same strategy that has delivered top quartile total returns over the past five years.
Longevity of dividends
Due to the unique characteristics of investment trusts and the age-old history of the vehicle, there are many companies with illustrious long-term track records. This has led to the construction of the AIC Dividend Heroes list, an accolade that companies can exhibit when they have increased their dividends consecutively for 20 years or more.
This is no mean feat, and the most recent list had only 21 eligible trusts.
Invesco Income Growth (LSE:IVI) is a trust that has consistently delivered dividends. The trust aims to produce above-inflation dividend growth, but also capital growth in excess of the FTSE All Share.
The manager, Ciaran Mallon, runs the portfolio conservatively, aiming to add alpha through active stock picking and meticulous analysis of company balance sheets.
Ciaran does not like to speculate on the macro environment, and the result is a trust that is well spread across sectors.
The manager has a good track record of growing the dividend in real terms, with over 20 consecutive years of dividend increases.
Much of this has been due to Ciaran's clear focus on sustainability of earnings growth and dividends, which is highly attractive to investors reliant on the income from their wealth. Over the past decade, the dividend has grown by 3% a year, well above the 2.2% average for CPI over this time frame (to the end of October) and above the 2.8% growth in RPI.
The most recent full year dividend was covered 1.2X. Currently, the discount sits at 13.9%, making it by far the cheapest trust in the UK Equity Income sector where the average discount is 2.9%.
Conclusion
As we demonstrate here, investors could be well rewarded for researching the investment trust space for equity income ideas for their ISA.
Dividends have been higher (when the trust trades on a significant discount), more secure (where there are capital or revenue reserves), the asset base more growth orientated (where a trust uses capital to pay dividends), and have greater longevity than those of open-ended funds.
Investors with cash are indeed fortunate, because at this moment in time, as we have highlighted, there are some attractive opportunities across the universe, with some trusts trading at historically wide discounts and high yields.
In future weeks we will be looking at the ISA opportunities for fixed interest, as well as alternative income funds.
Kepler Partners is a third-party supplier and not part of interactive investor. Neither Kepler Partners or interactive investor will be responsible for any losses that may be incurred as a result of a trading idea.
Full performance can be found on the company or index summary page on the interactive investor website. Simply click on the company's or index name highlighted in the article.
Important Information
Kepler Partners is not authorised to make recommendations to Retail Clients. This report is based on factual information only, and is solely for information purposes only and any views contained in it must not be construed as investment or tax advice or a recommendation to buy, sell or take any action in relation to any investment.
This report has been issued by Kepler Partners LLP solely for information purposes only and the views contained in it must not be construed as investment or tax advice or a recommendation to buy, sell or take any action in relation to any investment. If you are unclear about any of the information on this website or its suitability for you, please contact your financial or tax adviser, or an independent financial or tax adviser before making any investment or financial decisions.
The information provided on this website is not intended for distribution to, or use by, any person or entity in any jurisdiction or country where such distribution or use would be contrary to law or regulation or which would subject Kepler Partners LLP to any registration requirement within such jurisdiction or country. Persons who access this information are required to inform themselves and to comply with any such restrictions. In particular, this website is exclusively for non-US Persons.
The information in this website is not for distribution to and does not constitute an offer to sell or the solicitation of any offer to buy any securities in the United States of America to or for the benefit of US Persons.
This is a marketing document, should be considered non-independent research and is subject to the rules in COBS 12.3 relating to such research. It has not been prepared in accordance with legal requirements designed to promote the independence of investment research.
No representation or warranty, express or implied, is given by any person as to the accuracy or completeness of the information and no responsibility or liability is accepted for the accuracy or sufficiency of any of the information, for any errors, omissions or misstatements, negligent or otherwise. Any views and opinions, whilst given in good faith, are subject to change without notice.
This is not an official confirmation of terms and is not to be taken as advice to take any action in relation to any investment mentioned herein. Any prices or quotations contained herein are indicative only.
Kepler Partners LLP (including its partners, employees and representatives) or a connected person may have positions in or options on the securities detailed in this report, and may buy, sell or offer to purchase or sell such securities from time to time, but will at all times be subject to restrictions imposed by the firm's internal rules. A copy of the firm's conflict of interest policy is available on request.
Past performance is not necessarily a guide to the future. The value of investments can fall as well as rise and you may get back less than you invested when you decide to sell your investments. It is strongly recommended that Independent financial advice should be taken before entering into any financial transaction.
PLEASE SEE ALSO OUR TERMS AND CONDITIONS
Kepler Partners LLP is a limited liability partnership registered in England and Wales at 9/10 Savile Row, London W1S 3PF with registered number OC334771.
Kepler Partners LLP is authorised and regulated by the Financial Conduct Authority.
Kepler Partners is a third-party supplier and not part of interactive investor. Neither Kepler Partners or interactive investor will be responsible for any losses that may be incurred as a result of a trading idea.
These articles are provided for information purposes only. Occasionally, an opinion about whether to buy or sell a specific investment may be provided by third parties. The content is not intended to be a personal recommendation to buy or sell any financial instrument or product, or to adopt any investment strategy as it is not provided based on an assessment of your investing knowledge and experience, your financial situation or your investment objectives. The value of your investments, and the income derived from them, may go down as well as up. You may not get back all the money that you invest. The investments referred to in this article may not be suitable for all investors, and if in doubt, an investor should seek advice from a qualified investment adviser.
Full performance can be found on the company or index summary page on the interactive investor website. Simply click on the company's or index name highlighted in the article.
Important Information
Kepler Partners is not authorised to make recommendations to Retail Clients. This report is based on factual information only, and is solely for information purposes only and any views contained in it must not be construed as investment or tax advice or a recommendation to buy, sell or take any action in relation to any investment.
This report has been issued by Kepler Partners LLP solely for information purposes only and the views contained in it must not be construed as investment or tax advice or a recommendation to buy, sell or take any action in relation to any investment. If you are unclear about any of the information on this website or its suitability for you, please contact your financial or tax adviser, or an independent financial or tax adviser before making any investment or financial decisions.
The information provided on this website is not intended for distribution to, or use by, any person or entity in any jurisdiction or country where such distribution or use would be contrary to law or regulation or which would subject Kepler Partners LLP to any registration requirement within such jurisdiction or country. Persons who access this information are required to inform themselves and to comply with any such restrictions. In particular, this website is exclusively for non-US Persons. The information in this website is not for distribution to and does not constitute an offer to sell or the solicitation of any offer to buy any securities in the United States of America to or for the benefit of US Persons.
This is a marketing document, should be considered non-independent research and is subject to the rules in COBS 12.3 relating to such research. It has not been prepared in accordance with legal requirements designed to promote the independence of investment research.
No representation or warranty, express or implied, is given by any person as to the accuracy or completeness of the information and no responsibility or liability is accepted for the accuracy or sufficiency of any of the information, for any errors, omissions or misstatements, negligent or otherwise. Any views and opinions, whilst given in good faith, are subject to change without notice.
This is not an official confirmation of terms and is not to be taken as advice to take any action in relation to any investment mentioned herein. Any prices or quotations contained herein are indicative only.
Kepler Partners LLP (including its partners, employees and representatives) or a connected person may have positions in or options on the securities detailed in this report, and may buy, sell or offer to purchase or sell such securities from time to time, but will at all times be subject to restrictions imposed by the firm's internal rules. A copy of the firm's conflict of interest policy is available on request.
Past performance is not necessarily a guide to the future. The value of investments can fall as well as rise and you may get back less than you invested when you decide to sell your investments. It is strongly recommended that Independent financial advice should be taken before entering into any financial transaction.
PLEASE SEE ALSO OUR TERMS AND CONDITIONS
Kepler Partners LLP is a limited liability partnership registered in England and Wales at 9/10 Savile Row, London W1S 3PF with registered number OC334771.
Kepler Partners LLP is authorised and regulated by the Financial Conduct Authority.
These articles are provided for information purposes only. Occasionally, an opinion about whether to buy or sell a specific investment may be provided by third parties. The content is not intended to be a personal recommendation to buy or sell any financial instrument or product, or to adopt any investment strategy as it is not provided based on an assessment of your investing knowledge and experience, your financial situation or your investment objectives. The value of your investments, and the income derived from them, may go down as well as up. You may not get back all the money that you invest. The investments referred to in this article may not be suitable for all investors, and if in doubt, an investor should seek advice from a qualified investment adviser.
Full performance can be found on the company or index summary page on the interactive investor website. Simply click on the company's or index name highlighted in the article.