Five attractive small-cap investment trusts
We look at the characteristics which have separated the winners from the losers among small-cap trusts.
7th May 2020 15:40
This content is provided by Kepler Trust Intelligence, an investment trust focused website for private and professional investors. Kepler Trust Intelligence is a third-party supplier and not part of interactive investor. It is provided for information only and does not constitute a personal recommendation.
Material produced by Kepler Trust Intelligence should be considered a marketing communication, and is not independent research.
We look at the characteristics which have separated the winners from the losers among small-cap trusts in the current crisis, with some surprising results.

William Sobczak is an analyst at Kepler Trust Intelligence.
The fight in the dog
Smaller companies are usually a problematic area to invest in during significant downturns or recessions; and the sharp fall in 2020 hasn’t been an exception.
In this article we assess the performance of smaller companies trusts throughout the pandemic, while identifying the factors that have differentiated the winners from the losers.
This includes the impact that cash, market cap exposure, sector allocation, revenue exposure and growth or value biases have had, with some surprising results. We also ask whether now is an attractive time to invest in smaller companies, highlighting the trusts which stand out to us…
UK winners and losers
A number of key themes have separated winners from losers within the universe of UK Smaller Companies investment trusts over the past four months (up to 29 April). We have identified a number of characteristics that have contributed to outperformance in this period.
Cash
The most obvious trend has been the outperformance of companies that were holding cash. On average, trusts in the UK Smaller Companies sector have generated an NAV total return of -18.4%.
The five companies with the largest allocation to cash have, in comparison, generated a NAV total return of -9.8%. Gresham House Strategic (LSE:GHS) has been one of the standout performers in the sector, generating NAV total returns of 10%, a large proportion of which has been attributed to their 14.5% cash allocation.
When GHS reduced positions in IMImobile and Augean between November and February they were fortunate in their timing: their cash allocation was running at over 18% as concerns about COVID-19 emerged. They have then invested some of the cash, catching the bounce as markets have risen.
Market cap allocation
The size of the companies that each trust holds has also impacted performance.
The resilience of micro-caps – in comparison to smaller companies – has been an area that has particularly stood out. Diversified micro-cap specialist trusts, such as Miton UK Microcap (LSE:MINI) and River and Mercantile UK Micro Cap (LSE:RMMC), have delivered NAV total returns of -4.7 to -10.5% respectively.
In fact, comparing the ten trusts with over 50% allocated to small-caps to the nine trusts with over 50% in micro-caps, the micro-cap trusts have outperformed by around 8%.
It is worth noting however that, given their illiquid nature, many of these holdings will not have seen any transactions during the depth of the crisis, so losses will have been understated in the sell-off. Furthermore 2019 was a torrid time for micro-caps, meaning that a lot of pessimism was already built into the price.
When we spoke last month to BlackRock Throgmorton Trust (LSE:THRG) manager, Dan Whitestone, he identified micro-caps as being set for a revival. Dan believes that the current environment is conducive to smaller companies, in particular those which are nimbler and more dynamic.
The climate is punishing debt-ridden companies with large overheads, giving smaller companies a chance to capitalise and take market share from the larger companies which are struggling in their sectors.
At the other end of the spectrum, mid-caps have been a drag on performance for a number of trusts. We believe there are two key reasons for this.
The first is the fact that typically these holdings are the ones that have performed best during 2019. As such, these outperforming companies have seen their share prices fall back further at the start of the downturn after a period of strong performance.
The second reason is that the more liquid nature of mid-cap companies means that managers might have chosen to sell these assets ahead of selling their (more illiquid) smaller and micro-cap holdings. It is also worth considering that many managers of multi-asset, overseas or global equities funds will be using the FTSE 250 as a proxy for the UK domestic economy.
As there was a lot of optimism surrounding UK stocks at the end of 2019 – thanks to the election result and apparent Brexit deal – many of these managers are likely to have bought into UK domestic companies, often using passive vehicles to do so. UK small-caps are a smaller part of portfolios and cannot be accessed through ETFs, so flows may be lighter and slower.
Style exposure
Over the past decade growth strategies have outperformed value strategies. As demonstrated below growth has again outperformed in the downturn, despite outperforming during the 2019 bull market.
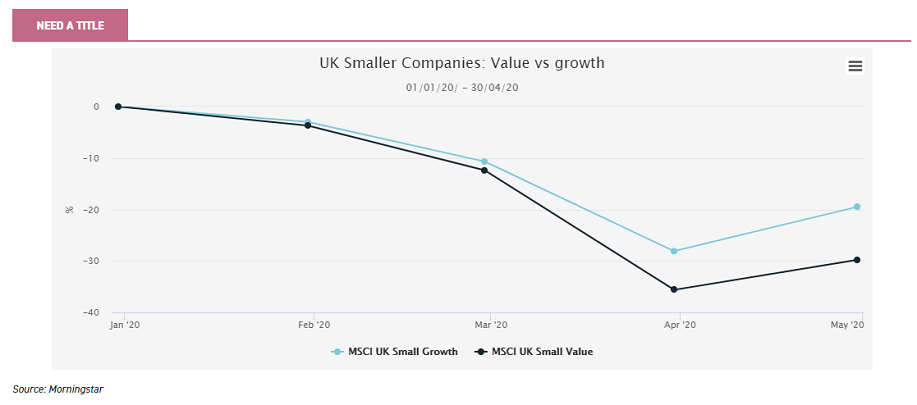
Over 2020 (up to 29 April) the top five trusts most exposed to value have underperformed by more than 10%, on average, in comparison to the top five most exposed to growth.
In fact the three worst performing trusts in the UK Smaller Companies sector were all value oriented. Aberforth Split Level Income (LSE:ASIT) and Aberforth Smaller Companies (LSE:ASL) both lost more than 50% of their NAV at one point, although they have rebounded since. The Aberforth trusts are the most value oriented in the sector, which led them into plenty of domestic focused stocks and retailers in the past two years: both areas have been blindsided by the coronavirus pandemic.
ASIT has also been hampered by its large amount of structural gearing through Zero Dividend Preference shares. As we demonstrate in the table below, the Aberforth trusts performed very strongly at the end of last year, when there was more optimism to the UK economy.
Consequently we think they could see a continuation of their dramatic snapback, should optimism re-emerge as we gain control over the pandemic.
market cap and style allocations (in order of nav performance Ytd)
| Market cap mid % | market cap small % | Market cap Micro % | asset allocation cash % | equity style growth % | equity style value % | return % | |
| Gresham House Strategic | 0 | 0 | 62 | 14 | 42 | 1 | 10.2 |
| Miton UK MicroCap | 0 | 1 | 97 | 31 | 36 | -4.7 | |
| Marwyn Value Investors | 0 | 59 | 40 | 0 | 59 | 28 | -5.9 |
| Oryx International Growth | 0 | 0 | 69 | 6 | 30 | 9 | -7.1 |
| River & Mercantile UK Micro Cap | 0 | 5 | 86 | 7 | 31 | 21 | -10.6 |
| Chelverton Growth | 0 | 0 | 73 | 9 | 3 | 58 | -12.1 |
| Athelney | 3 | 27 | 44 | 3 | 32 | 21 | -14.0 |
| Odyssean Investment | 0 | 17 | 25 | 55 | 21 | 4 | -15.5 |
| Montanaro UK Smaller Cos | 2 | 59 | 32 | 7 | 75 | 4 | -15.5 |
| Aberdeen Smaller Companies Income | 13 | 62 | 22 | 0 | 57 | 9 | -18.5 |
| Strategic Equity Capital | 0 | 19 | 48 | 4 | 35 | 13 | -19.1 |
| Standard Life UK Smaller Cos | 8 | 77 | 14 | 1 | 73 | 41 | -19.7 |
| BlackRock Throgmorton | 24 | 60 | 21 | -1 | 79 | 5 | -20.0 |
| Downing Strategic Micro-Cap | 0 | 0 | 48 | 17 | 15 | 12 | -20.8 |
| BlackRock Smaller Companies | 1 | 54 | 46 | -2 | 64 | 11 | -21.8 |
| Rights & Issues | 11 | 10 | 60 | 6 | 41 | 2 | -23.0 |
| Henderson Smaller Companies | 16 | 64 | 26 | -2 | 57 | 15 | -23.7 |
| JPMorgan Smaller Companies | 2 | 79 | 26 | -10 | 64 | 11 | -23.8 |
| Invesco Perpetual UK Smaller | 1 | 61 | 35 | 0 | 52 | 13 | -25.1 |
| SVM UK Emerging | 26 | 20 | 9 | 5 | 48 | 2 | -29.6 |
| Aberforth Smaller Companies | 0 | 34 | 65 | 0 | 10 | 51 | -35.3 |
| Crystal Amber | 0 | 22 | 54 | 1 | 46 | 30 | -50.0 |
| AVERAGE | - | - | - | - | - | - | -18.4 |
Source: Morningstar, 01/01/2020 – 29/04/2020
Sector exposure
Sector exposure has played a pivotal role in the outperformance of certain trusts. As can be seen in the table at the end of this section, trusts vary significantly in their sectoral exposure, and some have held up considerably better than others over 2020.
Technology, for example, has been a standout sector throughout the pandemic, as we discussed in a recent strategy article. Demand for hardware and software has generally increased, to help those now working from home for instance.
Meanwhile the internet retailers have received a boost at the expense of bricks and mortar retailers, though these are generally classified in the consumer discretionary sectors. Nine UK Smaller Companies investment trusts have more than 15% exposure to the technology sector.
These include the likes of Miton UK Microcap (LSE:MINI), Gresham House Strategic (LSE:GHS), Montanaro UK Smaller Companies (LSE:MTU) and Odyssean Investment Trust (LSE:OIT), all of which have considerably outperformed the rest of the sector.
In the case of healthcare, just four trusts have more than 10% exposure in the area, and the average return among them is -10.4%. This is a sector that has benefitted from new product development, as vaccines and drugs are emerging to fight the pandemic. In addition to this, the sector enjoys a strong backdrop due to ageing populations and dramatic increases in demand for healthcare products.
At the other end of the spectrum, we have seen sectors like financials, energy and communication services struggle in the face of the pandemic. The seven investment trusts with large levels of exposure to financials (namely more than 15%) have seen average returns of -27.1%.
The biggest area to be impacted has been the banks, due to interest rates continuing to fall and profit margins being squeezed, all exacerbated by the ongoing potential for bad debt problems to pose a concern. However there are only a handful of challenger banks in the UK Smaller Companies financials sector, which is dominated by asset and wealth managers.
Nevertheless those areas are also under increasing pressure, as the pandemic has prompted clients to withdraw funds, shrinking AUM and lowering the revenue from fees.
The sector that has seen the largest downturn has been energy, but few UK Smaller Companies trusts have significant exposure here. In fact only Crystal Amber has double digit exposure and the trust has lost more than 50% of its NAV over 2020.
Revenue exposure
Interestingly, one topic that did not have an impact on returns was geographical revenue exposure. We do caution, however, that our data is from Morningstar and may not be entirely accurate, as it is hard to trace final sources of revenue for some companies.
One might have anticipated that UK focused trusts would have struggled, but we found no strong relationship in this area. For example, one trust that has relatively high exposure to UK revenues according to Morningstar is Invesco Perpetual UK Smaller Companies (LSE:IPU), with 55.5%.
IPU has actually done relatively well over this period, having lost less than many of its peers in the initial crash.
This pattern of protecting on the downside is quite usual behaviour for IPU, as we discuss in our updated note published this week.
Similarly trusts that have exposure to the US or the Eurozone have not stood out, despite the pound falling by close to 7% against the dollar and 4% against the euro.
On average UK Smaller Companies trusts derive 53% of their revenues from the UK, ranging from 36.8% to 83.6%. Interestingly the micro-cap specialists, which we discuss above, have below average exposure to the UK, according to Morningstar.
sector and revenue allocations (in order of nav performance ytd)
| healthcare % | technology % | financial services % (net) | revenue exposure by region % uk | return (%) | |
| Gresham House Strategic | 0 | 26 | 3 | 54 | 10.2 |
| Miton UK MicroCap | 14 | 31 | 14 | 42 | -4.7 |
| Marwyn Value Investors | 0 | 0 | 0 | 47 | -5.9 |
| Oryx International Growth | 20 | 13 | 4 | 41 | -7.1 |
| River & Mercantile UK Micro Cap | 11 | 13 | 17 | 42 | -10.6 |
| Chelverton Growth | 0 | 15 | 0 | 84 | -12.1 |
| Athelney | 0 | 5 | 16 | 73 | -14.0 |
| Odyssean Investment | 4 | 18 | 0 | 39 | -15.5 |
| Montanaro UK Smaller Companies | 10 | 25 | 10 | 52 | -15.5 |
| Aberdeen Smaller Companies Income | 3 | 21 | 16 | 58 | -18.5 |
| Stategic Equity Capital | 25 | 16 | 6 | 50 | -19.1 |
| Standard Life UK Smaller Companies | 2 | 18 | 9 | 59 | -19.7 |
| BlackRock Throgmorton | 8 | 13 | 14 | 49 | -20.0 |
| Downing Strategic Micro-Cap | 3 | 11 | 0 | 66 | -20.8 |
| BlackRock Smaller Companies | 6 | 10 | 15 | 53 | -21.8 |
| Rights & Issues | 0 | 5 | 0 | 37 | -23.0 |
| Henderson Smaller Companies | 7 | 14 | 18 | 49 | -23.7 |
| JPMorgan Smaller Companies | 1 | 16 | 17 | 62 | -23.8 |
| Invesco Perpetual UK Smaller Companies | 8 | 11 | 10 | 56 | -25.1 |
| SVM UK Emerging | 10 | 6 | 14 | 48 | -29.6 |
| Aberforth Smaller Companies | 4 | 10 | 15 | 57 | -35.3 |
| Crystal Amber | 0 | 0 | 24 | 45 | -50.0 |
| AVERAGE | -18.4 |
Source: Morningstar, 01/01/2020 – 29/04/2020
European and US Smaller Companies trusts
Across the European and US Smaller Companies sectors we have seen similar trends to the UK, albeit with a considerably smaller pool of data. As can be seen below, there are only six trusts across the two sectors, with four sitting in Europe and just two in the US.
us & European smaller companies sectors (in order of nav performance ytd)
| market cap mid % | market cap small % | Market cap Micro % | Asset allocation cash % | equity style growth % | equity style value % | return (%) | |
| Montanaro European Smaller | 44 | 38 | 14 | 0 | 83 | 2 | -6.1 |
| European Assets | 53 | 34 | 10 | 4 | 64 | 5 | -11.4 |
| JPMorgan US Smaller Cos | 52 | 52 | 1 | - | 37 | 22 | -13.9 |
| JPMorgan European Smaller Cos | 59 | 45 | 3 | 7 | 57 | 13 | -15.8 |
| Jupiter US Smaller Companies | 27 | 53 | 24 | -3 | 52 | 13 | -17.4 |
| TR European Growth | 12 | 62 | 25 | -10 | 36 | 37 | -17.9 |
Source: Morningstar, 01/01/2020 – 29/04/2020
Since the start of the year, European Smaller Companies trusts have performed considerably better than their UK and US peers even before the impact of Sterling - with an average return of -12.8% in Sterling. The strongest performing trust has been Montanaro European Smaller Companies (LSE:MTE) which has delivered NAV total returns of -6.1%. Similarly to the UK sector, this trust has benefited from its high allocation to growth (83%) and low exposure to value (1.8%). MTE also has the highest exposure of any trust to technology and healthcare. Conversely TR European Growth (LSE:TRG) has struggled, due to its high levels of gearing (c. 10%) and high exposure to (what Morningstar class as) value companies (37.1%).
Of the US focused small-cap trusts, TRG delivered average returns of -15.7% in the period January -April 2020, compared to a Russell 2000 return of -17.1% and -18.4% for the average UK small-cap trust. The US mid-cap universe has very high weightings to technology and healthcare, both of which are helpful in the current environment, for the reasons discussed above. Nonetheless – stripping out the currency effect – the US trusts have underperformed their UK peers.
It is difficult to predict where US and European smaller companies will go from here. But Europe appears to have passed the first peak in coronavirus cases, ahead of both the US and the UK, and is tentatively re-opening its economies. This may result in the European Smaller Companies sector emerging more positively earlier. With sterling at low levels, it could be that this will weigh on returns going forward.
Are small-caps attractive now?
The pandemic has caused a widening of discounts across the Smaller Companies sectors, particularly in the UK and US. In the case of the UK focussed trusts, discounts have been wider in recent years, thanks to concerns about the Brexit negotiations. Following the agreement of the deal between Boris Johnson’s government and the EU, and Johnson’s win in the December 2019 election, discounts had narrowed before the coronavirus knocked them back again. This could – in our opinion – indicate that, should we get a smooth exit from the crisis, UK discounts could be attractive.
smaller companies sector discounts
| sector | current average discount % | 1 year average discount % |
| UK Smaller Companies | 15.2 | 11.5 |
| North American Smaller Companies | 9.8 | 6.1 |
| European Smaller Companies | 10.2 | 10.4 |
Source: JPMorgan Cazenove, 01/01/2020 – 29/04/2020
The main element of the investment case, however, is the value in the NAV not the share prices. We have long seen the UK Smaller Companies sector as attractively valued, for the reasons just discussed. This is illustrated below, where JPMorgan have combined a number of valuation measures which demonstrate that UK smaller companies have rarely been more attractively valued over the past 55 years.
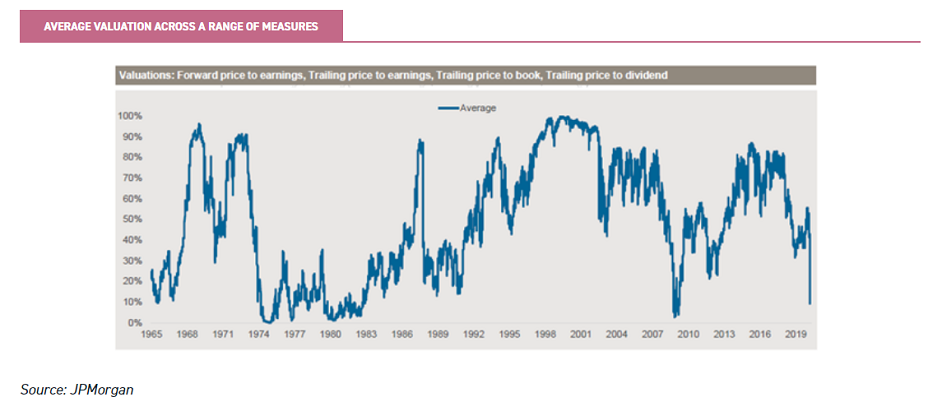
Source: JPMorgan
We think it is likely that a number of the characteristics which have driven performance over the past four months will continue going forward.
For example, in our view the technology and healthcare sectors will likely continue driving performance, whether we see a rebound or not, due to their ability to continue offering products and services in a difficult environment.
Consequently trusts like Miton UK Microcap (LSE:MINI) and Gresham House Strategic (LSE:GHS) could be well placed. When we spoke recently to the manager of Miton UK Microcap, Gervais Williams, he told us now is a particularly attractive moment to invest in micro-caps.
He believes the impact of globalisation, particularly the reduced cost of imports, has dampened inflationary pressures. Meanwhile low interest rates and easily available credit have led to a misallocation of capital in global stock markets.
In fact he says globalisation has concealed a wide range of issues, including the incredibly weak progress in productivity since the financial crisis.
This situation has negatively impacted wage growth rates across the world and increased concerns over the sustainability of the political and economic status quo.
Gervais believes changes in political agendas and shifts in mainstream economic policy will continue, hindering global companies whilst enabling micro-cap companies to thrive once more.
BlackRock Smaller Companies also has significant exposure to growth companies (64%) but is tilted more to smaller and mid-cap companies than to micro-caps.
The manager, Roland Arnold, believes that in this environment the most important thing is to take a long-term view. He has been working on the assumption that ‘everything will return to normal’, whether it be due to herd immunity or a vaccine, but has been focusing on the areas that will reopen first.
As a result the portfolio has limited exposure to consumer facing sectors such as retailers and leisure, instead favouring industrials and consumer services.
It is worth considering, however, whether the long-term trend against value investing has now gone so far that there may be huge potential for mean reversion.
Aberforth Smaller Companies (LSE:ASL), for example, is trading on a discount of 7.3%. The trust takes a disciplined value approach to investing in UK small-caps and saw a dramatic share price rise in Q4 of 2019, illustrating the potential ‘elastic snapback’ should we see value come back into fashion.
When we last spoke with the managers in December they noted that, in terms of the historical price-to-earnings (PE) ratio, ASL’s portfolio was trading on the widest discount to the Smaller Companies index in its 30 year history.
Another less obvious ‘value play’ is Downing Strategic Micro-Cap (LSE:DSM), which is now trading at a discount to NAV of 21%, and which we initiated research on earlier this week.
The team employ a highly concentrated ‘value’ investment strategy, based on fundamental analysis.
They aim to buy strategic stakes (between 3% and 25%) in companies they believe are fundamentally mispriced.
This is usually due to a specific issue, whether real or misunderstood by the market, but which is resolvable over time. With relatively strong balance sheets, it is possible that DSM’s portfolio – already having been priced low by the stock market – has a certain amount of inbuilt protection.
Recognising that the trust’s underlying investments have suffered falls, we calculate that its ‘look-through’ discount to the small cap market is in the region of 69%.
As with most recessionary events, winners, losers and opportunities emerge. Across the UK, Europe and US a number of attractive trusts now stand at significant discounts.
The UK in particular stands out to us, given the low valuations and the experience of December 2019, which we think shows the potential for a significant relative boost to the market when optimism returns.
Kepler Partners is a third-party supplier and not part of interactive investor. Neither Kepler Partners or interactive investor will be responsible for any losses that may be incurred as a result of a trading idea.
Full performance can be found on the company or index summary page on the interactive investor website. Simply click on the company's or index name highlighted in the article.
Important Information
Kepler Partners is not authorised to make recommendations to Retail Clients. This report is based on factual information only, and is solely for information purposes only and any views contained in it must not be construed as investment or tax advice or a recommendation to buy, sell or take any action in relation to any investment.
This report has been issued by Kepler Partners LLP solely for information purposes only and the views contained in it must not be construed as investment or tax advice or a recommendation to buy, sell or take any action in relation to any investment. If you are unclear about any of the information on this website or its suitability for you, please contact your financial or tax adviser, or an independent financial or tax adviser before making any investment or financial decisions.
The information provided on this website is not intended for distribution to, or use by, any person or entity in any jurisdiction or country where such distribution or use would be contrary to law or regulation or which would subject Kepler Partners LLP to any registration requirement within such jurisdiction or country. Persons who access this information are required to inform themselves and to comply with any such restrictions. In particular, this website is exclusively for non-US Persons. The information in this website is not for distribution to and does not constitute an offer to sell or the solicitation of any offer to buy any securities in the United States of America to or for the benefit of US Persons.
This is a marketing document, should be considered non-independent research and is subject to the rules in COBS 12.3 relating to such research. It has not been prepared in accordance with legal requirements designed to promote the independence of investment research.
No representation or warranty, express or implied, is given by any person as to the accuracy or completeness of the information and no responsibility or liability is accepted for the accuracy or sufficiency of any of the information, for any errors, omissions or misstatements, negligent or otherwise. Any views and opinions, whilst given in good faith, are subject to change without notice.
This is not an official confirmation of terms and is not to be taken as advice to take any action in relation to any investment mentioned herein. Any prices or quotations contained herein are indicative only.
Kepler Partners LLP (including its partners, employees and representatives) or a connected person may have positions in or options on the securities detailed in this report, and may buy, sell or offer to purchase or sell such securities from time to time, but will at all times be subject to restrictions imposed by the firm's internal rules. A copy of the firm's conflict of interest policy is available on request.
Past performance is not necessarily a guide to the future. The value of investments can fall as well as rise and you may get back less than you invested when you decide to sell your investments. It is strongly recommended that Independent financial advice should be taken before entering into any financial transaction.
PLEASE SEE ALSO OUR TERMS AND CONDITIONS
Kepler Partners LLP is a limited liability partnership registered in England and Wales at 9/10 Savile Row, London W1S 3PF with registered number OC334771.
Kepler Partners LLP is authorised and regulated by the Financial Conduct Authority.
Kepler Partners is a third-party supplier and not part of interactive investor. Neither Kepler Partners or interactive investor will be responsible for any losses that may be incurred as a result of a trading idea.
These articles are provided for information purposes only. Occasionally, an opinion about whether to buy or sell a specific investment may be provided by third parties. The content is not intended to be a personal recommendation to buy or sell any financial instrument or product, or to adopt any investment strategy as it is not provided based on an assessment of your investing knowledge and experience, your financial situation or your investment objectives. The value of your investments, and the income derived from them, may go down as well as up. You may not get back all the money that you invest. The investments referred to in this article may not be suitable for all investors, and if in doubt, an investor should seek advice from a qualified investment adviser.
Full performance can be found on the company or index summary page on the interactive investor website. Simply click on the company's or index name highlighted in the article.
Important Information
Kepler Partners is not authorised to make recommendations to Retail Clients. This report is based on factual information only, and is solely for information purposes only and any views contained in it must not be construed as investment or tax advice or a recommendation to buy, sell or take any action in relation to any investment.
This report has been issued by Kepler Partners LLP solely for information purposes only and the views contained in it must not be construed as investment or tax advice or a recommendation to buy, sell or take any action in relation to any investment. If you are unclear about any of the information on this website or its suitability for you, please contact your financial or tax adviser, or an independent financial or tax adviser before making any investment or financial decisions.
The information provided on this website is not intended for distribution to, or use by, any person or entity in any jurisdiction or country where such distribution or use would be contrary to law or regulation or which would subject Kepler Partners LLP to any registration requirement within such jurisdiction or country. Persons who access this information are required to inform themselves and to comply with any such restrictions. In particular, this website is exclusively for non-US Persons. The information in this website is not for distribution to and does not constitute an offer to sell or the solicitation of any offer to buy any securities in the United States of America to or for the benefit of US Persons.
This is a marketing document, should be considered non-independent research and is subject to the rules in COBS 12.3 relating to such research. It has not been prepared in accordance with legal requirements designed to promote the independence of investment research.
No representation or warranty, express or implied, is given by any person as to the accuracy or completeness of the information and no responsibility or liability is accepted for the accuracy or sufficiency of any of the information, for any errors, omissions or misstatements, negligent or otherwise. Any views and opinions, whilst given in good faith, are subject to change without notice.
This is not an official confirmation of terms and is not to be taken as advice to take any action in relation to any investment mentioned herein. Any prices or quotations contained herein are indicative only.
Kepler Partners LLP (including its partners, employees and representatives) or a connected person may have positions in or options on the securities detailed in this report, and may buy, sell or offer to purchase or sell such securities from time to time, but will at all times be subject to restrictions imposed by the firm's internal rules. A copy of the firm's conflict of interest policy is available on request.
Past performance is not necessarily a guide to the future. The value of investments can fall as well as rise and you may get back less than you invested when you decide to sell your investments. It is strongly recommended that Independent financial advice should be taken before entering into any financial transaction.
PLEASE SEE ALSO OUR TERMS AND CONDITIONS
Kepler Partners LLP is a limited liability partnership registered in England and Wales at 9/10 Savile Row, London W1S 3PF with registered number OC334771.
Kepler Partners LLP is authorised and regulated by the Financial Conduct Authority.
These articles are provided for information purposes only. Occasionally, an opinion about whether to buy or sell a specific investment may be provided by third parties. The content is not intended to be a personal recommendation to buy or sell any financial instrument or product, or to adopt any investment strategy as it is not provided based on an assessment of your investing knowledge and experience, your financial situation or your investment objectives. The value of your investments, and the income derived from them, may go down as well as up. You may not get back all the money that you invest. The investments referred to in this article may not be suitable for all investors, and if in doubt, an investor should seek advice from a qualified investment adviser.
Full performance can be found on the company or index summary page on the interactive investor website. Simply click on the company's or index name highlighted in the article.