ii investment performance review 2022
12th January 2023 14:24
There was political turmoil after a seismic mini-budget in the UK in the final quarter of the year, with many market commentators anticipating a recession in 2023.

Market round-up
It is no understatement to say that 2022 was an extraordinary year in so many ways, with dramatic changes in geopolitics, the global economy and fiscal and monetary policies resulting in investors having to deal with numerous shocks and wild changes in the outlook across the investment landscape.
At the beginning of the year, the global economy continued its recovery from the post-pandemic enforced recession, which brought with it a tightening of labour and global supply chains and saw inflation expectations ticking higher. Central banks were slowly beginning to raise interest rates from historic lows to reflect this improving economic outlook.
- Invest with ii: Top ISA Funds | FTSE Tracker Funds | Open a Stocks & Shares ISA
Everything changed with Russia’s invasion of Ukraine in the early spring of 2022 with widespread and increasingly dramatic implications throughout the year. The most obvious impact was seen in the commodity markets where energy and agricultural prices surged reflecting disruption to the supply of many commodities. The inability of Ukraine to export various key agricultural crops, and the subsequent sanctions that were placed on Russia saw these key inflationary inputs rising steeply, with inflation spiking to levels not seen for decades.
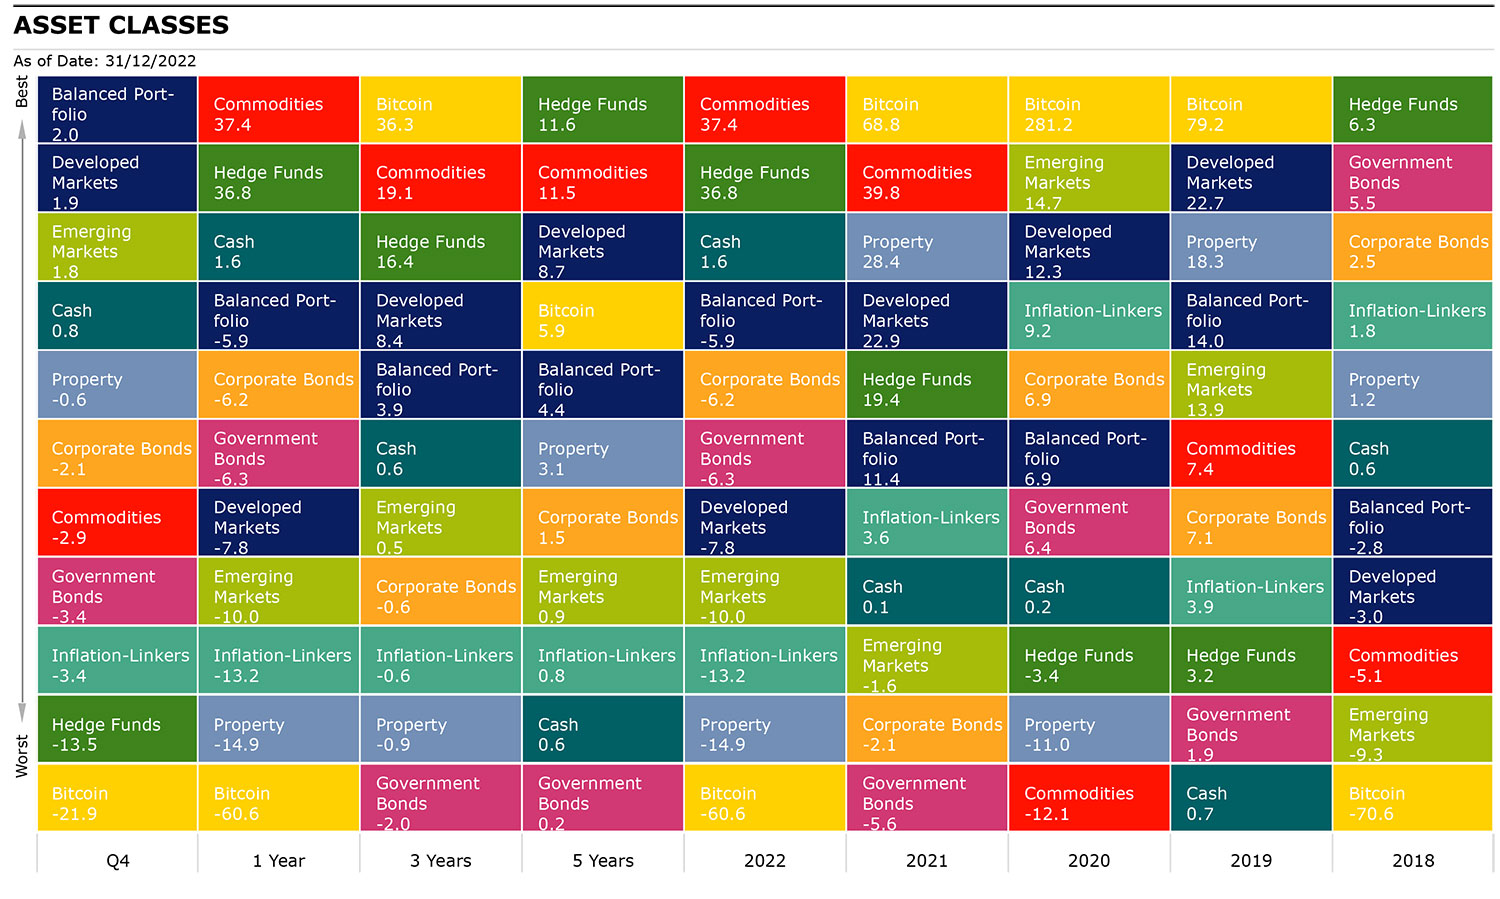
Unsurprisingly, all asset classes were impacted, with all except commodities suffering negatively. Some of the trends that had started in 2021 were exacerbated, most notably the fall in bond prices from historic highs as inflation rose and investors demanded higher yields, and the relative outperformance of value-oriented investment styles over the more highly rated growth strategies that invest in sectors such as technology.
Central banks around the world, having been caught off guard and being behind the curve on the jump in inflation, accelerated interest rate increases, which consequently had further negative impacts on consumption and mortgage rates. Consensus economic forecasts were pared back significantly with many market commentators anticipating a widespread recession for 2023.
- 2023 Investment Outlook: stock tips, forecasts, predictions and tax changes
- Visit our YouTube channel to view our experts’ tips for 2023
For UK investors, these issues were compounded by a year of political chaos with three prime ministers, industrial action not seen since the 1970s, and a disastrous mini-budget brought in by the Truss administration. Investors reacted negatively by initially selling sterling, which was the weakest major currency for most of the year, and then through the gilt market, which saw severe selling pressure and surging bond yields as global investors digested the implications of an unfunded budget giveaway. A very quick change of prime minister and chancellor, followed by a complete budget reversal saw calm being returned to UK assets in the fourth quarter.
As the year progressed, some of the pressures eased as the effects of Russia’s invasion lessened most obviously in the energy markets with Europe quickly weaning itself off Russian energy supplies, a warmer early winter season, and the resumption of grain exports. In addition, the Chinese government driven by populist anger at continued lockdowns, eased Covid restrictions, which raised the prospect of that economy entering a more positive period.
Source: Morningstar
Shares
Interestingly, given the political chaos in the UK, and the fact that the UK remains the least favoured global market by international investors, (which has been the case since Brexit), the UK stock market was the best relative performer through 2022, managing to post a small positive return where all major markets fell close to 10%. The primary reason, in addition to the fact that it has a very low relative valuation, and was already unloved, is due to the make-up of the UK market. A heavy exposure to the energy sector was a significant contributor to this outperformance as the sector went up by nearly 50% driven by surging energy prices, due to the effects of the Russian invasion.
- Why these could be 10 of the most reliable shares for investors in 2023
- This is what the ideal share for 2023 looks like
Unusually, the US was the worst-performing market, once again skewed by the fact that the technology sector, which is dominated by US companies, saw the largest share price declines. Globally this trend was replicated with more growth-oriented sectors, which have typically higher valuations coming under more selling pressure than the more economically sensitive value industries and sectors. It was also interesting that the largest companies outperformed smaller companies, the starkest example being the large oil and gas companies, BP (LSE:BP.) and Shell (LSE:SHEL) posting very strong gains.
| Q4 | 1 year | 3 years | 5 years | |
| Europe Ex UK | 11.46 | -7.62 | 5.04 | 4.62 |
| FTSE 250 | 10.55 | -17.39 | -2.68 | 0.60 |
| FTSE All Share | 8.90 | 0.34 | 2.30 | 2.92 |
| FTSE 100 | 8.68 | 4.70 | 3.13 | 3.27 |
| FTSE Small Cap | 7.07 | -13.56 | 4.45 | 4.14 |
| China | 5.34 | -12.10 | -4.48 | -2.27 |
| TOPIX Japan | 5.12 | -4.14 | 2.32 | 2.39 |
| Asia Pacific Ex Japan | 4.03 | -7.08 | 2.62 | 2.51 |
| World | 1.86 | -7.83 | 8.37 | 8.66 |
| Emerging Markets | 1.80 | -10.02 | 0.49 | 0.95 |
| S&P 500 | -0.18 | -7.79 | 11.18 | 12.02 |
| Brazil | -5.02 | 28.53 | -5.61 | 1.54 |
| India | -5.36 | 3.64 | 13.93 | 8.53 |
| Russia | -7.20 | -100.00 | -98.93 | -92.83 |
Source: Morningstar - Total Returns (GBP) to 31/12/2022.
Sectors
The performance between industries across global stock markets was starkly divergent with the most economically sensitive and the most defensive industries performing well, while the most highly rated and those most exposed to the consumer suffered the largest selling pressure. The best-performing sector was the energy sector as mentioned above, which rallied nearly 50% over the year as oil and gas prices surged and those firms exposed saw significant windfall gains. The next best-performing industries were the utilities sector, which also saw a boost to profits from the energy spike, and the consumer defensive sectors and pharmaceuticals sectors, all of which are relatively immune to an economic slowdown, and all of which are also heavyweights in the UK market.
In contrast, those sectors such as technology and communications, which have the highest valuations and had performed so well for the previous five years, fell sharply due to a combination of valuation compression as interest rates started to rise, and also a slowdown in some of the growth rates many of the companies had exhibited. Many of the largest, most dominant companies saw their share prices fall dramatically as this new environment was digested. Those sectors exposed heavily to the consumer all saw price declines as the outlook for consumer spending darkened in all regions as interest rates rose, and the cost-of-living crisis became very evident.
| Q4 | 1 years | 3 years | 5 years | |
| Energy | 10.90 | 64.40 | 15.58 | 8.14 |
| Industrials | 9.38 | -2.27 | 7.57 | 6.77 |
| Materials | 8.83 | 0.50 | 11.10 | 7.49 |
| Financials | 7.54 | 1.13 | 7.11 | 5.51 |
| Health Care | 4.99 | 6.50 | 12.31 | 12.82 |
| Consumer Staples | 3.63 | 5.70 | 8.00 | 7.27 |
| Utilities | 3.03 | 7.35 | 6.50 | 9.04 |
| Real Estate | -1.99 | -15.68 | 0.28 | 3.46 |
| Information Technology | -2.48 | -22.07 | 12.48 | 15.87 |
| Communication Services | -6.80 | -28.98 | -0.78 | 2.72 |
| Consumer Discretionary | -9.42 | -24.97 | 5.75 | 7.63 |
Source: Morningstar - Total Returns (GBP) to 31/12/2022.
Bonds
In a year where all asset classes fell sharply, there were few places to hide. It was unusual to see weakness across all fixed-income bond markets, with some extraordinary falls in some of the largest markets. Bond prices, both government and corporate, fell sharply as investors woke up to the reality of inflation bursting upwards due to post-pandemic market tightness and the consequences of the Russian invasion of Ukraine. Yields which had fallen to near all-time lows just 18 months ago, with German Bunds having negative yields at one stage, have surged in all markets to reflect the damaging effects of inflation on fixed-income coupon streams.
- Watch Sam Benstead's video: my high-yield bond market tip for 2023
- Bond Watch: how will fixed income perform in 2023?
The worst-performing markets were UK Government Bonds (gilts) and in particular index-linked gilts. This dubious accolade was driven by the political chaos mentioned above and the poorly received mini-budget introduced by the Truss administration. This unfunded tax giveaway was the straw that broke the gilt market’s back with investors selling heavily. Sterling fell sharply and yields rose at the sharpest rate ever reflecting deep concern over the outlook for the UK’s finances. This market reaction prompted a swift political backlash, with a new prime minister and chancellor being installed after Truss resigned. This new team reversed those policies immediately, but the relative reputational damage was done, proving the old adage that reputations are hard earned, but quickly lost.
| Q4 | 1 year | 3 years | 5 years | |
| Sterling Corporate | 6.21 | -17.75 | -4.86 | -1.49 |
| EURO Corporate | 2.29 | -9.30 | -2.98 | -1.77 |
| UK Gilts | 1.69 | -23.83 | -7.86 | -3.41 |
| Global High Yield | -0.71 | -2.30 | 1.53 | 3.27 |
| Global Corporate | -2.13 | -6.19 | -0.59 | 1.53 |
| Global Aggregate | -2.98 | -5.70 | -1.36 | 0.68 |
| Global Government | -3.37 | -6.29 | -1.99 | 0.23 |
| Global Inflation Linked | -3.40 | -13.24 | -0.61 | 0.76 |
| UK Inflation Linked | -6.00 | -34.45 | -8.81 | -4.29 |
Source: Morningstar - Total Returns (GBP) to 31/12/2022.
Commodities & Alternatives
The most noteworthy moves over the year were in the energy and agricultural commodities segments for the reasons mentioned above. The intense supply shock of the Russian invasion across much of the commodity complex saw inflation levels that have not been seen for decades. Understandably these asset classes posted very strong returns. Similarly, gold acted as a safe haven with positive returns for the year as its inflation hedge properties attracted investor monies.
Real estate was caught up in the selling pressure as concerns rose over the real economic fallout from this inflation surge and consequent interest rate hikes, with commercial, retail and residential property segments being hit. For alternative managers this was both a very difficult environment, but also one that provided opportunities for those who positioned themselves correctly given the huge divergence between those assets that fell heavily and the few asset classes that did very well. With few asset classes posting positive returns and with wild swings throughout the year, only the nimble could produce positive returns.
| Q4 | 1 year | 3 years | 5 years | |
| Global Natural Resources | 8.79 | 24.22 | 15.26 | 9.89 |
| UK REITs | 4.51 | -31.88 | -9.61 | -3.45 |
| Global Infrastructure | 3.04 | 12.40 | 5.04 | 6.35 |
| Cash | 0.78 | 1.64 | 0.63 | 0.65 |
| Gold | 0.54 | 12.12 | 9.43 | 9.47 |
| Commodity | -2.94 | 37.35 | 19.05 | 11.47 |
| Brent Crude Oil | -9.36 | 24.37 | 12.75 | 7.64 |
| Hedge Funds | -13.45 | 36.79 | 16.41 | 11.59 |
| CBOE Market Volatility (VIX) | -36.40 | 41.70 | 24.15 | 17.16 |
Source: Morningstar - Total Returns (GBP) to 31/12/2022.
Most-traded shares on the ii platform in 2022
These articles are provided for information purposes only. Occasionally, an opinion about whether to buy or sell a specific investment may be provided by third parties. The content is not intended to be a personal recommendation to buy or sell any financial instrument or product, or to adopt any investment strategy as it is not provided based on an assessment of your investing knowledge and experience, your financial situation or your investment objectives. The value of your investments, and the income derived from them, may go down as well as up. You may not get back all the money that you invest. The investments referred to in this article may not be suitable for all investors, and if in doubt, an investor should seek advice from a qualified investment adviser.
Full performance can be found on the company or index summary page on the interactive investor website. Simply click on the company's or index name highlighted in the article.