ii investment performance review: Q2 2023
11th July 2023 12:51
Concerns about inflation, interest rates and a Chinese slowdown made this a volatile period, but Japan managed a 33-year high and tech stocks are flying.

In a reversal of fortune, Q2 saw indications of a slowdown in China’s economic recovery post-lockdown which will have implications on global growth. The latest available data show that Chinese imports and exports have declined 4.50% and 7.50% year-on-year in May respectively, even against depressed 2022 data. Retail sales, however, grew 12.7% year-on-year in May, although this was below April’s rate of 18.4% and below market expectations of 13.6%.
- Invest with ii: Open an investment Account | General Investing with ii | Interactive investor Offers
In the UK, US and Europe, economic indicators paint a mixed picture as the divergence between services and manufacturing sectors as measured by PMIs (Purchasing Managers’ Index) widened since March, as the services sector continues to be in expansion while manufacturing is firmly in contraction territory.
In the US, Services PMI increased from 52.6 in March to 54.4 in June (note that PMI >50 indicates expansion, PMI <50 indicated contraction), while Manufacturing PMI contracted from 49.2 to 46.3. In the UK, Services PMI grew from 52.9 to 53.7 (although down from 2023 high of 55.9) and Manufacturing PMI fell by 1.4 points to 46.5. In Europe, Manufacturing PMI fell from 47.3 to 43.4, the lowest in three years and has been in contraction territory since June 2022 and in contrast to the UK and US, although still in expansion, Services PMI fell three points to 52 in June suggesting a slowing economy.
In general, inflation in major economies had fallen over Q2, with the latest numbers (May) at 4.0% in the US (5.0% in March) as the Federal Reserve hit pause on its rate hikes in June after a year of consecutive rises. In Europe, inflation fell to 5.5% from 6.9% in March as the European Central Bank (ECB) continued to hike rates to 4.0%. UK headline inflation rate also fell, from 10.1% in March to 8.7%, but worryingly, core inflation (which excludes volatile items such as energy and food) rose 0.9% to 7.1% indicating that inflation is stickier and more entrenched than initially thought. In response, the Bank of England reaccelerated its rate hikes in June to 50bps (up from 25bps). The unemployment rate across these economies are at historic lows.
- Investors expecting to make returns comfortably ahead of inflation in 2023
- Have the big super-trends for the next decade changed since Covid?
The US debt ceiling also came to the forefront in Q2 with the ideological divide between the Democrats and Republicans over the issue seemingly insurmountable, threatening the first US default in history. Ultimately, a compromise between the two parties was found and an agreement to lift the debt ceiling was reached and signed into law in early June by President Joe Biden, averting global economic chaos.
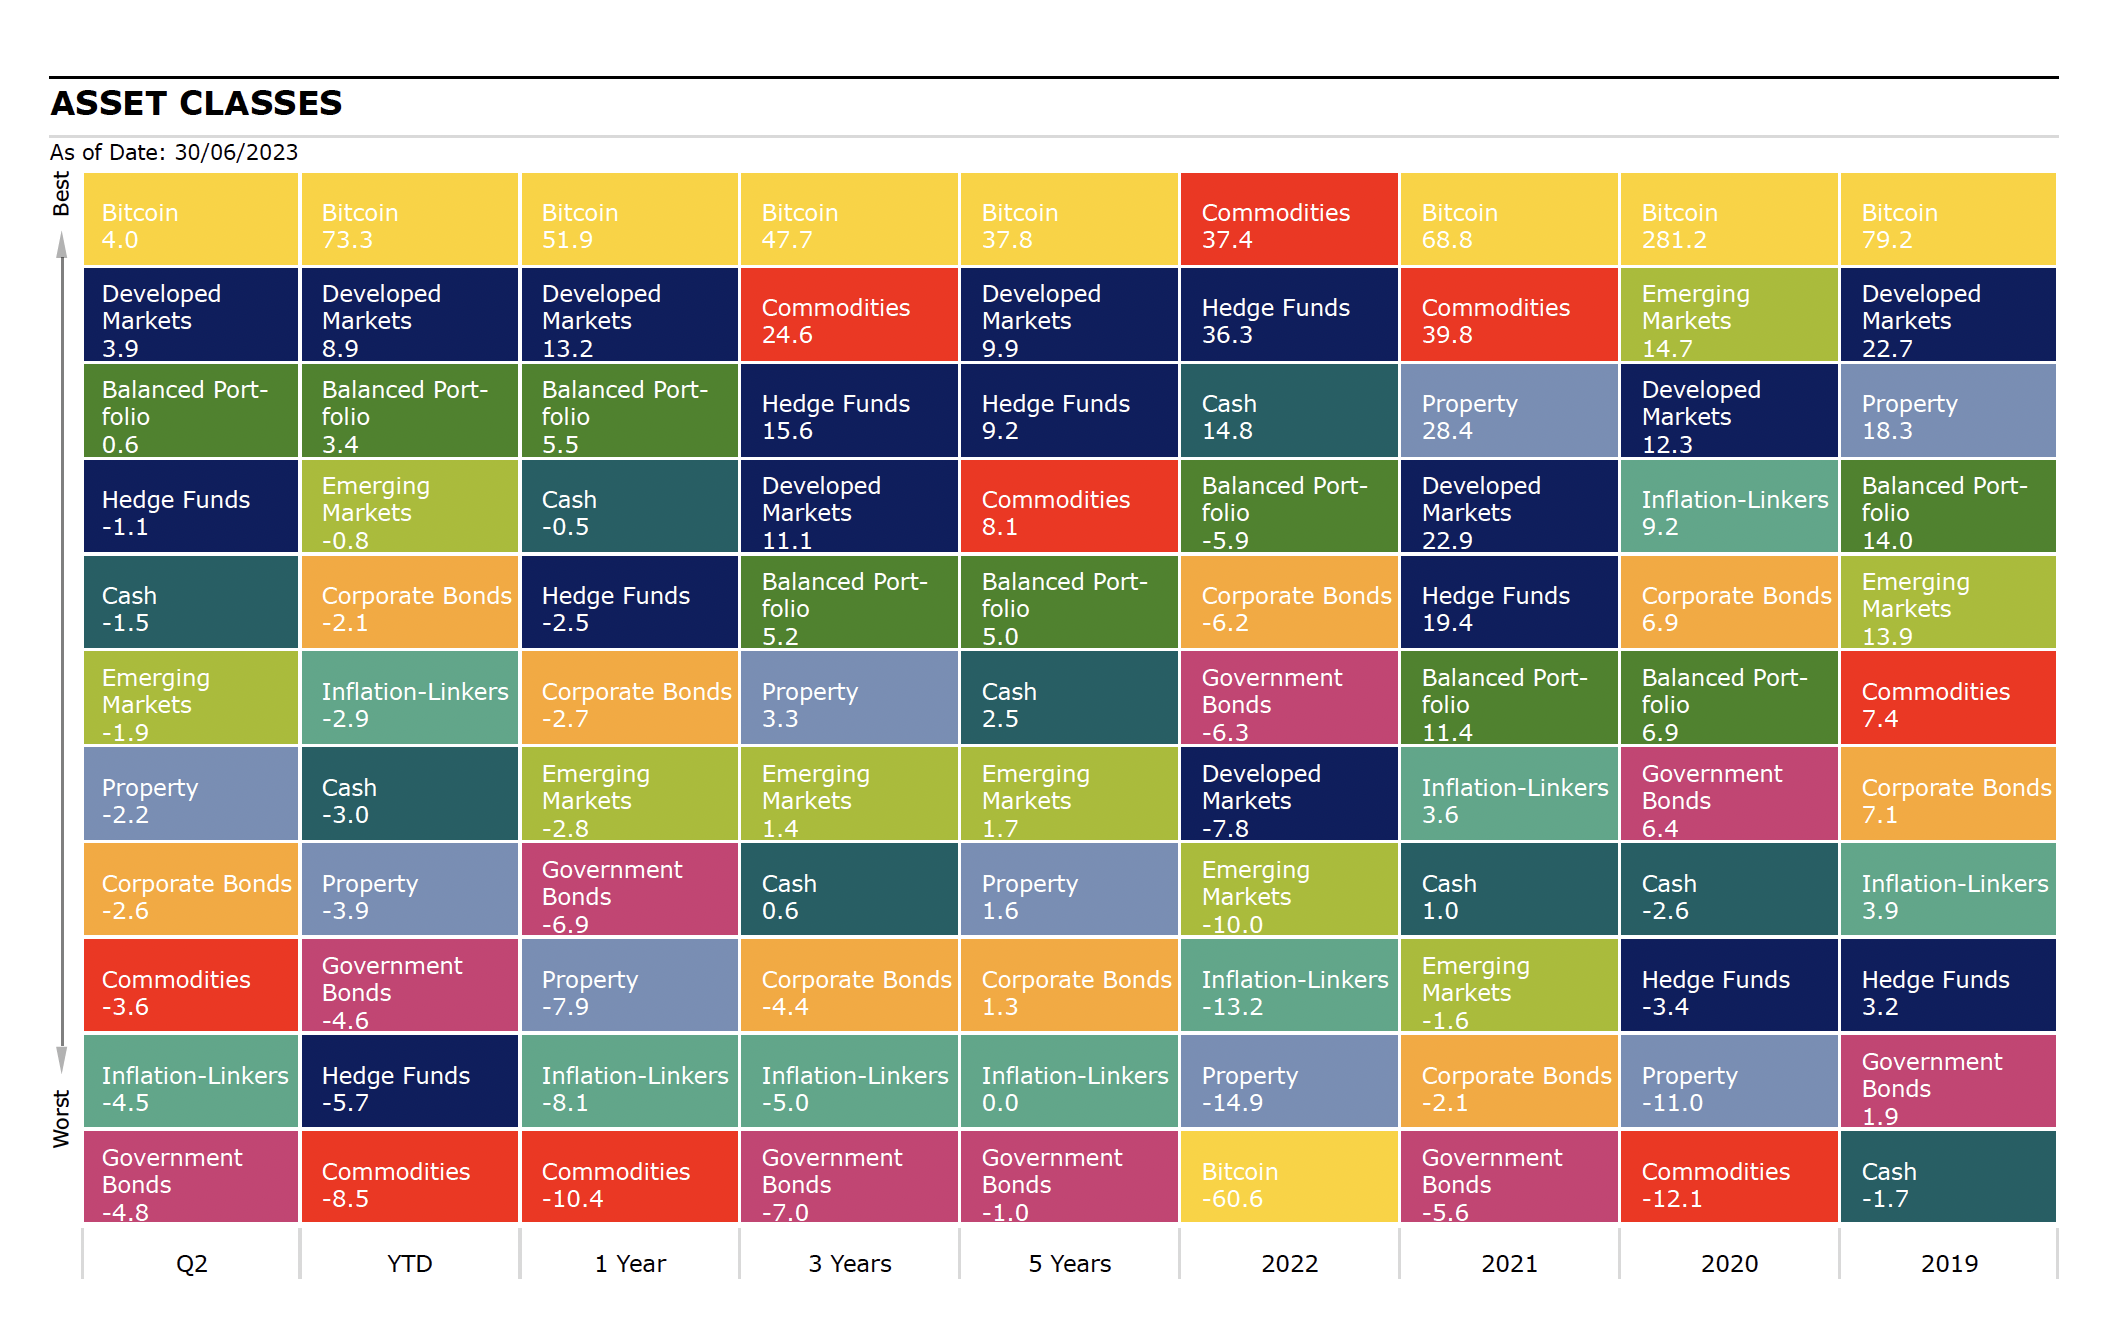
Source: Morningstar as of 30 June 2023. Total Returns in GBP. Developed Markets: MSCI World, Emerging Markets: MSCI EM, Corporate Bonds: ICE BofA Global Corporate, Commodities: TReuters/CoreCommodity, Property: FTSE EPRA Nareit Developed, Inflation-Linkers: Bloomberg Global Inflation Linked, Government Bonds: JPM GBI Broad, Bitcoin: MarketVector Bitcoin, Hedge Funds: Morningstar Broad Hedge Fund, Balanced Portfolio: FTSE UK Private Investor Balanced, Cash: ICE LIBOR 1 Month
Equities
In Q2, global equities as measured by the MSCI ACWI Index returned 3.26% with Developed Markets (DM) outperforming its Emerging Markets (EM) counterparts.
UK equities fell 0.46% over the quarter with the largest detracting sectors being Telecoms (-13.21%), Basic Materials (-7.58%) and Consumer Staples (-4.75%). The adverse performance in Telecoms was predominately driven by Vodafone (LSE:VOD), the largest constituent among telecom names, which fell 12.84% over the same period as it announced circa 11,000 job cuts and lower than expected FY23 results. Basic Materials detracted due to declining commodity prices, indications of an economic slowdown in China, and the strength of sterling, which also impacted sectors that are heavy dollar earners.
In the US, the S&P 500 rose 5.76% in Q2, with June contributing to most of the returns in the quarter as investor fears over the US debt ceiling abated with Congress passing legislation to lift the debt ceiling and avert default at the start of June. IT led all sectors as it rose 13.91% driven by the sustained euphoria over artificial intelligence, which benefited chipmakers in particular. Consumer Discretionary (11.35%) and Communications (9.89%) also contributed positively to US equities, while sectors such as Utilities (-5.42%), Energy (-3.87%) and Consumer Staples (-2.50%) were the largest detractors.
- Best and worst AIM shares in first half of 2023
- Merryn Somerset Webb: the scariest chart in the world
In sterling terms, MSCI Europe ex-UK was flat in Q2 (0.07%, 2.49% in dollar terms), IT (2.10%), Financials (1.92%) and Utilities (1.38%) were the largest contributors, while the largest detractors were Real Estate (-21.69%), as financing becomes increasingly difficult as the ECB continued to raise interest rates, Communications (-7.12%) and Energy (-4.60%).
Japanese equities gained 2.49% as measured by TOPIX in Q2, which underperformed global equities in sterling terms due to the weakness of the yen against sterling. In local currency terms, TOPIX rose 14.45% in Q2. The Nikkei had reached its highest levels in 33 years in June, which was driven by a mix of corporate governance reforms, inflow from foreign investors, and structural shifts in the macro economy as inflation makes a welcome return.
The MSCI Emerging Markets fell 1.87% in Q2 with concerns over China’s economic outlook being a large contributor to emerging market performance as the MSCI China index declined 12.19% in Q2. Continued geopolitical tensions between the US and China, and the US debt ceiling (until its resolution) also cast dark clouds over emerging markets. Other countries that detracted included South Africa, with the country’s electricity crisis continuing to deteriorate, and Turkey as President Recep TayyipErdogan won re-election, continuing his two-decade long rule. Brazil on the other hand, was the best emerging markets performer as domestic equities rose 17.36% in Q2 over optimism about potential rate cuts in the near term, improving economic data and easing fiscal policy concerns.
| Name | 3 months | YTD | 1 year | 3 years | 5 years |
| FTSE All Share | -0.46 | 2.61 | 7.89 | 10.02 | 3.11 |
| FTSE 100 | -0.31 | 3.24 | 9.15 | 10.85 | 3.58 |
| FTSE 250 | -1.56 | -0.6 | 1.87 | 5.1 | 0.1 |
| FTSE Small Cap | 0.66 | -0.62 | 1.2 | 9.93 | 3.8 |
| MSCI Europe Ex UK | 0.07 | 8.97 | 19 | 9.03 | 6.8 |
| S&P 500 | 5.76 | 10.6 | 14.24 | 13.52 | 13.16 |
| MSCI AC Asia Pacific Ex Japan | -3.75 | -2.52 | -3.71 | 1.52 | 2.35 |
| TOPIX | 2.49 | 5.98 | 12.85 | 4.61 | 3.51 |
| MSCI Emerging Markets | -1.87 | -0.76 | -2.8 | 1.35 | 1.7 |
| MSCI Brazil | 17.36 | 10.55 | 24 | 12.35 | 7.08 |
| MSCI China | -12.19 | -10.55 | -20.54 | -11.1 | -4.56 |
| MSCI India | 9.15 | -0.55 | 9.05 | 18.2 | 9.58 |
| MSCI World | 3.9 | 8.89 | 13.21 | 11.11 | 9.9 |
Source: Morningstar as of 30 June 2023. Total Returns in GBP. MSCI World Indexes.
Sectors
Perhaps already alluded to in the previous section, global growth returns at 6.20% trumped global value at 0.15% in Q2. Growth’s outperformance was led by IT (10.56%), as mega-cap names in the US such as NVIDIA (NASDAQ:NVDA), Meta Platforms (NASDAQ:META), Apple Inc (NASDAQ:AAPL), Microsoft (NASDAQ:MSFT) and Alphabet (NASDAQ:GOOGL) outperform and the concentration of these names in the S&P 500 continues to rise and, by extension, in global indices too. Other sectors that contributed positively to global returns include Communications (4.12%) and Consumer Discretionary (5.25%), as consumer spending remains robust despite elevated inflation.
The largest detractor at the global level was Materials (-3.56%) mainly due to a decline in commodity prices over concerns of faltering economic recovery in China. Other detracting sectors included Utilities (-2.82%) and Consumer Staples (-2.42%).
| Name | 3 months | YTD | 1 year | 3 years |
| Consumer Discretionary | 5.25 | 16.92 | 13.91 | 6.44 |
| Consumer Staples | -2.42 | -1.87 | 2.85 | 6.41 |
| Energy | -1.97 | -7.58 | 8.16 | 22.94 |
| Financials | 2.27 | -1.96 | 6.49 | 12.41 |
| Health Care | -0.56 | -4.91 | 0.98 | 6.58 |
| Industrials | 3.38 | 7.35 | 19.61 | 12.68 |
| Information Technology | 10.56 | 29.53 | 28.27 | 14.87 |
| Materials | -3.56 | -1.19 | 7.06 | 10.84 |
| Communication Services | 4.12 | 18.68 | 5.58 | 2.29 |
| Utilities | -2.82 | -6.10 | -3.77 | 5.06 |
Source: Morningstar as of 30 June 2023. Total Returns in GBP. MSCI ACWI Sector Indexes.
Bonds
The Bloomberg Global Aggregate Index fell 4.23% as government yields rose over Q2. All major central banks raised rates throughout the quarter with the exception being the Bank of Japan. Notably, the Federal Reserve was the first in the cohort to hit pause to its tightening programme after consecutive rises for a year.
In the UK, Gilts and Index-Linked Gilts fell 5.42% and 6.89% respectively as inflation remained stubbornly high at 8.70% (May 2023) and the latest core inflation rising to 7.10%, from the March rate of 6.20%, with salary increases owing to a stronger-than-expected labour market suggested as a major driver. In response, the Bank of England reaccelerated its rate hikes to 50bps in June, up from 25bps.
The UK 10-year yield increased from 3.49% to 4.49% and the UK two-year yield increased from 3.44% to 5.26% in Q2. In terms of corporates, UK high yield outperformed UK investment grade.
- Why bonds are back and how you can invest in them
- Day in the life of a bond fund manager: M&G’s Eva Sun-Wai
The US 10-year yield increased from 3.47% to 3.81%, with the two-year yield increasing from 4.03% to 4.87%. US corporates outperformed treasuries with high yield outperforming its investment grade counterparts.
| Name | 3 Months | YTD | 1 Year | 3 Years | 5 Years |
| Global Aggregate | -4.23 | -4.03 | -5.74 | -5.86 | -0.34 |
| Global Government | -4.84 | -4.61 | -6.9 | -7.03 | -0.99 |
| UK Gilts | -5.42 | -3.49 | -14.46 | -11.51 | -4.17 |
| Global Corporate | -2.65 | -2.09 | -2.65 | -4.39 | 1.26 |
| Sterling Corporate | -3.35 | -1.06 | -7.1 | -6.24 | -1.45 |
| Euro Corporate | -1.91 | -1.19 | -0.2 | -5.21 | -1.8 |
| Global High Yield | -1.16 | -0.39 | 4.78 | 0.5 | 3 |
| Global Inflation Linked | -4.46 | -2.89 | -8.11 | -5 | 0.03 |
| UK Inflation Linked | -6.89 | -2.95 | -17.6 | -13.19 | -4.64 |
Source: Morningstar as of 30 June 2023. Total Returns in GBP. Global Aggregate: Bloomberg Global Aggregate, Global Government: JPM GBI Broad, UK Gilts: FTSE Act UK Conventional Gilts All Stocks. Global Corporate: ICE BofA Global Corporate, Sterling Corporate: ICE BofA Sterling Non-Gilt, Euro Corporate: Markit iBoxx EUR, Global High Yield: ICE BofA Global High Yield, Global Inflation Linked: Bloomberg Global Inflation Linked, UK Inflation Linked: Bloomberg Global Inflation Linked UK.
Commodities and Alternatives
During Q2 of 2023, Commodities (as measured by TReuters Core Commodity index) fell by 3.6% in sterling terms. An initial rise in oil prices after a surprise announcement on production cuts by OPEC+ in April was not sustained as Brent Crude fell 8.7% in GBP terms in the quarter.
| Name | 3 months | YTD | 1 year | 3 years | 5 years |
| Global REITs | -2.22 | -3.88 | -7.9 | 3.31 | 1.59 |
| UK REITs | -6.87 | -8.13 | -22.59 | -3.67 | -5.26 |
| Gold | -6.44 | -0.62 | 0.26 | 1.47 | 9.59 |
| Oil | -8.68 | -17.51 | -37.68 | 20.94 | -0.42 |
| Global Infrastructure | -2.86 | -1.77 | -0.5 | 9.6 | 6.11 |
| Natural Resources | -6.31 | -8.33 | 3.52 | 17.43 | 6.69 |
| Commodities | -3.59 | -8.51 | -10.38 | 24.56 | 8.06 |
| Hedge Funds | -1.14 | -5.73 | -2.54 | 15.6 | 9.24 |
| Volatility | -29.32 | -40.66 | -54.78 | -24.29 | -2.59 |
Source: Morningstar as of 30 June 2023. Total Returns in GBP. Global REITS: FTSE EPRA Nareit Developed, UK REITs: FTSE EPRA Nareit UK, Gold: LBMA Gold Price AM, Oil: Oil Price Brent Crude, Global Infrastructure: S&P Global Infrastructure, Natural Resources: S&P Global Natural Resources, Commodities: TReuters/CoreCommodity CRB, Hedge Funds: Morningstar Broad Hedge Fund, Volatility: CBOE Market Volatility (VIX).
Most-traded shares on the ii platform in Q2 2023
Most-bought shares on ii platform in Q2 2023 |
Most-sold shares on ii platform in Q2 2023 |
These articles are provided for information purposes only. Occasionally, an opinion about whether to buy or sell a specific investment may be provided by third parties. The content is not intended to be a personal recommendation to buy or sell any financial instrument or product, or to adopt any investment strategy as it is not provided based on an assessment of your investing knowledge and experience, your financial situation or your investment objectives. The value of your investments, and the income derived from them, may go down as well as up. You may not get back all the money that you invest. The investments referred to in this article may not be suitable for all investors, and if in doubt, an investor should seek advice from a qualified investment adviser.
Full performance can be found on the company or index summary page on the interactive investor website. Simply click on the company's or index name highlighted in the article.