Share Sleuth: here’s how the portfolio has performed each year
Richard Beddard explains why he doesn’t publish performance figures in the way funds do by displaying one, three and five-year numbers. However, here, he's made an exception and also reveals how the portfolio has fared each year since launch in 2009.
8th February 2024 09:46
by Richard Beddard from interactive investor

Here are three words I bet you never thought I would say: performance, performance, performance.
Although I am a dedicated ignorer of Share Sleuth’s performance, I have devoted most of this article to the subject.
- Invest with ii: Open a Stocks & Shares ISA | ISA Investment Ideas | Transfer a Stocks & Shares ISA
Adding more Focusrite
But first, this month’s trade.
Last month’s portfolio update read like a death sentence for Tristel, and even though I have since re-scored the hospital disinfectant manufacturer and confirmed it remains a unique business, its high price still dulls its allure.
It remains the bottom-ranked Share Sleuth share in the Decision Engine, my universe of 40 shares
When I sat down to trade, though, the portfolio had just over £5,000 of spare cash. There was no need to liquidate a holding to fund an addition. Share Sleuth’s minimum trade size, 2.5% of its total value, was just under £5,000.
Pulling the trigger on Tristel (LSE:TSTL)was not an inevitability because my goal is to keep Share Sleuth nearly fully invested.
Lined up in the Decision Engine’s buy zone were nine companies scoring 7/10 or more, under-represented in the portfolio and not coming up for their annual re-score. These were the top six:
Share | Score (/10) | Rank (/40) | Ideal (%) | Portfolio (%) |
Focusrite | 9 | 4 | 7.8% | 2.9% |
Oxford Instruments | 9 | 8 | 7.3% | 0.0% |
Dewhurst | 8 | 9 | 7.0% | 2.1% |
Advanced Medical Solutions | 8 | 12 | 6.1% | 2.1% |
Softcat | 8 | 15 | 5.7% | 0.0% |
Anpario | 8 | 17 | 5.5% | 1.5% |
In practice, it came to a shoot-out between Focusrite (LSE:TUNE), currently one of the portfolio’s worst-performing shares in terms of share price, and Oxford Instruments (LSE:OXIG), which would be a new addition.
Given what I am about to say about letting analysis drive investment decisions and not movements in the share price, it would be hypocritical to let the falling share price put me off adding more of the slightly more highly ranked Focusrite shares.
I slept on the decision, and on Thursday 1 February added 970 more shares in Focusrite at a price of £5.15. The total cost including £10 in lieu of broker fees was £5005.50.
The trade brought Share Sleuth’s Focusrite holding up to 5.5% of the portfolio’s total value.
Focusrite designs equipment for making and playing sound. Its famous brands are Scarlett and Clarett, interfaces that connect instruments, microphones and headphones to computers where musicians record, produce and edit music.
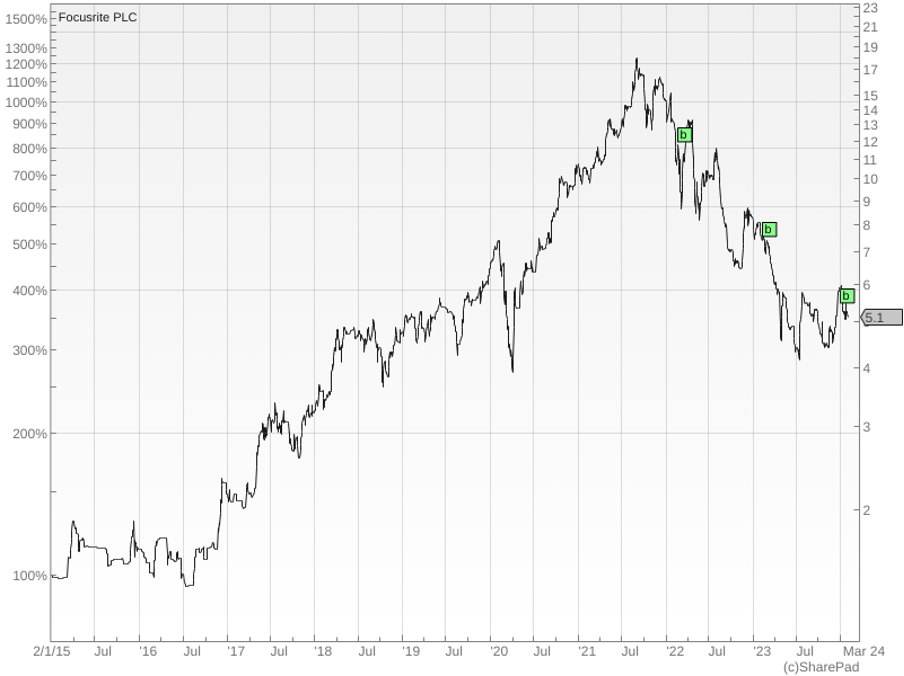
‘B’ indicates an addition to the Share Sleuth portfolio. So far adding Focusrite shares has been chastening. Past performance is not a guide to future performance.
Share Sleuth performance
Every so often I receive an email from a reader, MS, congratulating me on the performance of the Share Sleuth portfolio.
MS thinks Share Sleuth’s performance is so good that one of the fund management companies should offer me a job. I think they would be most unwise to take me on. They would probably be fitting a square peg into a round hole.
MS is interested in the one, three, five-year performance of the portfolio, as reported by funds. I think knowing that is detrimental, and I am not the only one.
One of our best-known former fund managers Anthony Bolton wrote in his autobiographical book on investing that he thought fund managers would be better off not knowing how well they were performing.
The risk is that short-term underperformance would influence long-term decision making. If we are constantly reminding ourselves that things are going badly, for example, we are more likely to act on that information reflexively. Cut our losers, say, and follow the herd.
But to win over the long term we must do things differently, have the courage of our convictions. Sometimes that means enduring the pain of falling share prices, and that is much easier if you do not feel it.
This does not mean never admitting we are wrong. I have an opportunity to admit I am wrong every year, for every share in the Share Sleuth portfolio, when I read its annual report and score it again. But that decision will not be informed directly by movements in the share price, it will be informed by my analysis.
- Six value share tips for 2024 and beyond
- Shares for the future: tech firm among 28 stocks rated good value
Why then go to the trouble of calculating statistics that could do the portfolio harm? In investing, where we direct our attention is everything. I believe that my attention is best focused on researching and scoring companies, “feeding the machine” (my Decision Engine), I call it.
Sometimes I forget that readers might be interested!
I guess MS gave up waiting for me to produce the stats, because they asked for the raw data and calculated the numbers. I love it when readers fill in gaps, or check my numbers (one FL has spotted a number of minor errors over the years).
This is not just because it saves me work or embarrassment, but because it feels like Share Sleuth and the Decision Engine are supported (thanks to all those who helped me fine-tune my scoring system, and particularly MS, who I actually met in January).
I love it when readers get involved, so I am publishing the performance numbers to honour MS and maybe to satisfy your curiosity.
The performance of both Share Sleuth and the FTSE-All Share index tracking benchmark include reinvested dividends. In its first year, the Share Sleuth portfolio was not fully invested:
Year | Share Sleuth | Index tracker |
2009 | 2.91% | 10.78% |
2010 | 22.80% | 13.11% |
2011 | -7.80% | -3.73% |
2012 | 11.93% | 14.33% |
2013 | 41.03% | 17.20% |
2014 | -2.46% | -2.78% |
2015 | 28.93% | -3.27% |
2016 | 19.42% | 27.86% |
2017 | 33.56% | 11.50% |
2018 | -4.51% | -8.48% |
2019 | 50.27% | 17.21% |
2020 | 12.49% | -7.27% |
2021 | 14.83% | 15.49% |
2022 | -9.49% | 4.20% |
2023 | 0.47% | 0.51% |
Source: MS, from the author’s data maintained in SharePad.
Annualised | Share Sleuth | Index tracker |
1 year | 0.47% | 0.51% |
3 years | 1.45% | 6.55% |
5 years | 12.04% | 5.62% |
7 years | 12.29% | 4.29% |
10 years | 12.95% | 4.90% |
12 years | 14.98% | 6.63% |
All time | 13.63% | 6.92% |
Source: MS, from the author’s data maintained in SharePad.
What I will not do is attempt to explain these numbers. They exist because I took the decisions I made, and those decisions are examined in my articles every week. They exist because the stock market is a wild and chaotic thing.
Now we know Share Sleuth has performed relatively poorly over the last three years, you may be wondering whether it is jinxed? Will I start trading manically? I do not think so.
For a start, we already knew the portfolio is well below its previous high, from the chart we publish monthly (below).
Most importantly you (and my editor) have allowed me to get away with not publishing this data for more than 14 years. I am grateful. That enabled me to develop without fear of temporary underperformance. Now, I am at least somewhat immune to the pernicious impact of price watching.
I have no plans to change my monthly reporting format, although, if MS is willing, we may update these figures occasionally in future.
Please note, my figures and MS’ do not tally because MS provided me with their calculations more than a little over a week ago.
More Share Sleuth performance!
At the close on Friday 2 February, Share Sleuth was worth £191,224, 537% more than the £30,000 of pretend money we started with in September 2009.
The same amount invested in accumulation units of a FTSE All-Share index tracking fund would be worth £78,532, an increase of 162%.
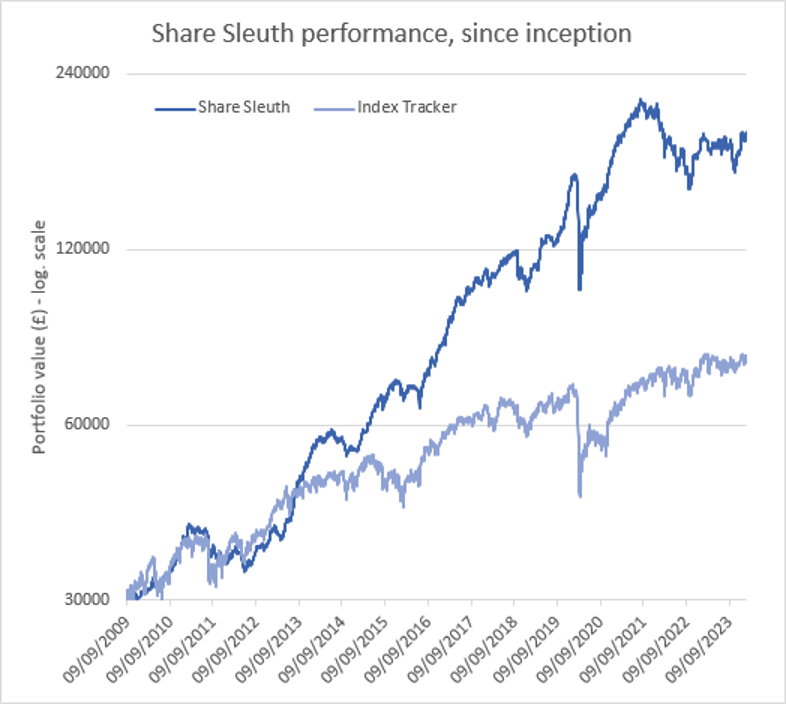
Past performance is not a guide to future performance.
After the addition of more Focusrite shares and dividends paid during the month from Focusrite, Latham (James) (LSE:LTHM) and Jet2 Ordinary Shares (LSE:JET2), Share Sleuth’s molehill of cash is £44.
The minimum trade size, 2.5% of the portfolio’s value, is £4,800.
Share Sleuth | Cost (£) | Value (£) | Return (%) | ||
Cash | 44 | ||||
Shares | 191,180 | ||||
Since 9 September 2009 | 30,000 | 191,224 | 537 | ||
Companies | Shares | Cost (£) | Value (£) | Return (%) | |
ANP | Anpario | 1,124 | 4,057 | 2,951 | -27 |
BMY | Bloomsbury | 1,681 | 5,915 | 8,010 | 35 |
AMS | Advanced Medical Solutions | 1,965 | 4,503 | 4,176 | -7 |
BNZL | Bunzl | 201 | 4,714 | 6,448 | 37 |
CHH | Churchill China | 1,058 | 12,223 | 14,283 | 17 |
CHRT | Cohort | 1,600 | 3,747 | 9,664 | 158 |
CLBS | Celebrus | 1,528 | 3,509 | 3,476 | -1 |
DWHT | Dewhurst | 532 | 1,754 | 4,256 | 143 |
FOUR | 4Imprint | 190 | 3,688 | 10,412 | 182 |
GAW | Games Workshop | 100 | 4,571 | 9,865 | 116 |
GDWN | Goodwin | 266 | 6,646 | 15,588 | 135 |
GRMN | Garmin | 53 | 4,413 | 5,069 | 15 |
HWDN | Howden Joinery | 2,020 | 12,718 | 16,221 | 28 |
JET2 | Jet2 | 456 | 250 | 6,037 | 2,315 |
LTHM | James Latham | 750 | 9,235 | 8,700 | -6 |
PRV | Porvair | 906 | 4,999 | 5,980 | 20 |
PZC | PZ Cussons | 1,870 | 3,878 | 2,416 | -38 |
QTX | Quartix | 3,285 | 7,296 | 5,913 | -19 |
RSW | Renishaw | 234 | 6,227 | 8,106 | 30 |
RWS | RWS | 2,790 | 9,199 | 6,506 | -29 |
SOLI | Solid State | 356 | 1,028 | 4,414 | 329 |
TET | Treatt | 763 | 1,082 | 3,521 | 225 |
TFW | Thorpe (F W) | 2,000 | 2,207 | 7,800 | 254 |
TSTL | Tristel | 750 | 268 | 3,638 | 1,256 |
TUNE | Focusrite | 2,020 | 14,128 | 10,302 | -27 |
VCT | Victrex | 292 | 6,432 | 3,954 | -39 |
XPP | XP Power | 240 | 4,589 | 3,475 | -24 |
Notes
1 Feb 2024: Added more Focusrite
Costs include £10 broker fee, and 0.5% stamp duty where appropriate
Cash earns no interest
Dividends and sale proceeds are credited to the cash balance
£30,000 invested on 9 September 2009 would be worth £191,224 today
£30,000 invested in FTSE All-Share index tracker accumulation units would be worth £78,532 today
Objective: To beat the index tracker handsomely over five-year periods
Source: SharePad, Close on Friday 2 February 2024.
Richard Beddard is a freelance contributor and not a direct employee of interactive investor.
Richard owns shares in all the shares in the Share Sleuth portfolio
See our guide to the Decision Engine and the Share Sleuth Portfolio for more information.
Contact Richard Beddard by email: richard@beddard.net or on Twitter: @RichardBeddard
These articles are provided for information purposes only. Occasionally, an opinion about whether to buy or sell a specific investment may be provided by third parties. The content is not intended to be a personal recommendation to buy or sell any financial instrument or product, or to adopt any investment strategy as it is not provided based on an assessment of your investing knowledge and experience, your financial situation or your investment objectives. The value of your investments, and the income derived from them, may go down as well as up. You may not get back all the money that you invest. The investments referred to in this article may not be suitable for all investors, and if in doubt, an investor should seek advice from a qualified investment adviser.
Full performance can be found on the company or index summary page on the interactive investor website. Simply click on the company's or index name highlighted in the article.
Disclosure
We use a combination of fundamental and technical analysis in forming our view as to the valuation and prospects of an investment. Where relevant we have set out those particular matters we think are important in the above article, but further detail can be found here.
Please note that our article on this investment should not be considered to be a regular publication.
Details of all recommendations issued by ii during the previous 12-month period can be found here.
ii adheres to a strict code of conduct. Contributors may hold shares or have other interests in companies included in these portfolios, which could create a conflict of interests. Contributors intending to write about any financial instruments in which they have an interest are required to disclose such interest to ii and in the article itself. ii will at all times consider whether such interest impairs the objectivity of the recommendation.
In addition, individuals involved in the production of investment articles are subject to a personal account dealing restriction, which prevents them from placing a transaction in the specified instrument(s) for a period before and for five working days after such publication. This is to avoid personal interests conflicting with the interests of the recipients of those investment articles.