Singling out top multi-asset investment trusts
8th July 2022 14:01
Kepler identifies four different strategies, including the one-stop-shop approach and return-seeking diversifiers, and examines how they behaved under contrasting market conditions.

This content is provided by Kepler Trust Intelligence, an investment trust focused website for private and professional investors. Kepler Trust Intelligence is a third-party supplier and not part of interactive investor. It is provided for information only and does not constitute a personal recommendation.
Material produced by Kepler Trust Intelligence should be considered a marketing communication, and is not independent research.
In the first article of our series examining the AIC Flexible Investment sector, we divided this widely disparate group of trusts into what we think are more comparable sub-groups, identifying four roughly similar types of strategy.
In this article, the second in our series, we examine those four sub-groups – one-stop-shop, return-seeking diversifiers, protective diversifiers and hedge fund-style strategies – and the way they have behaved in two very different market environments.
It would be difficult to imagine how the last two discrete years could be more different. The year between June 2020 and June 2021 saw equity markets soar, buoyed by vast government stimulus, a thundering performance from tech stocks, which came into their own in a ‘remote-only’ world and – later – the retreat of Covid-19 and the consequent splurge of savings built during the forced frugality of lockdowns.
The year between June 2021 and June 2022, on the other hand, has seen markets collapse as the froth came off obscene valuations for tech stock, inflation beginning its ascent, and latterly the cost of food and energy soaring as the grinding catastrophe in Ukraine continues to unfold.
The graph below shows the differences of NAV total returns of three major indices and their respective volatilities (proxied using an open-ended product) over these two periods.
In our view, this provides an ideal testing ground to re-examine how the trusts within our four subcategories fared and see if our original thesis for banding them together has proved correct or whether the testing times seen over the last 12 months suggest we need to re-think any designations. Here we will compare how the four sub-categories have performed over two periods: 01/06/2020 to 31/05/2021 (period one) and 01/06/2021 to 31/05/2022 (period two).
NAV TOTAL RETURNS AND VOLATILITY OF MAJOR GLOBAL INDEXES OVER PERIOD ONE & PERIOD TWO
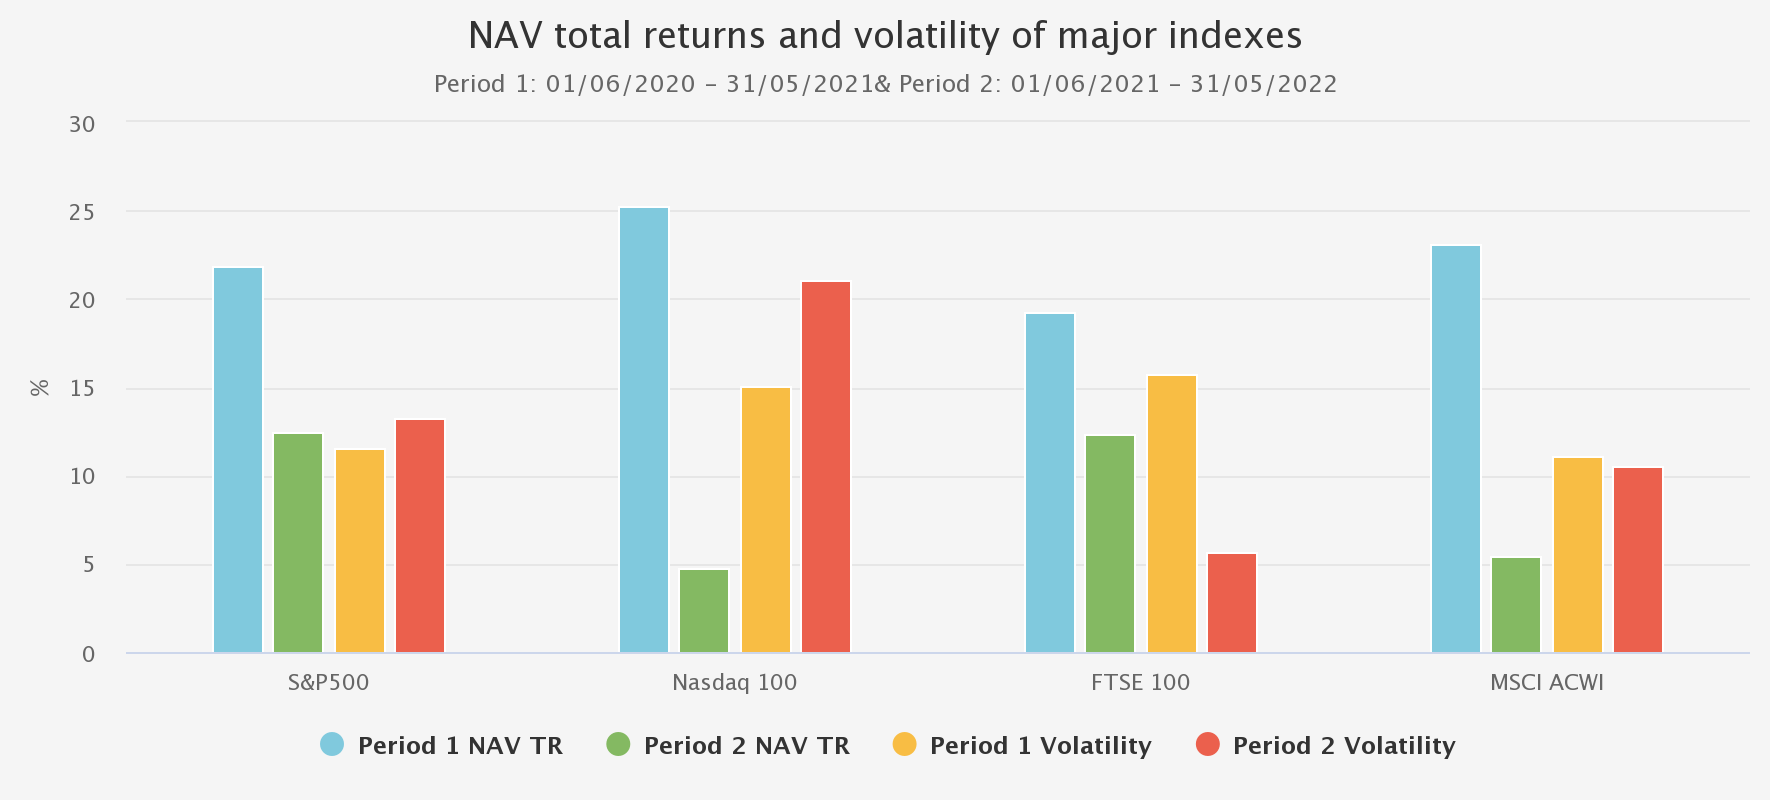
Source: Morningstar. Past performance is not a reliable indicator of future results.
Flexible Investment Universe
The chart below illustrates the distribution of NAV total return performances across the sector since the start of 2020. We have used daily data to illustrate the cumulative best-performing trust, the worst-performing trust, and the average and median performance values of the sector at each point in time. This has been updated from our previous article extending the analysis from July 2021 onwards. The close convergence of the median and simple average has been maintained showing that the distributions across the performance spectrum have remained relatively equitable. However, the difference between the best and worst performers at any one point in time goes some way to explaining the disparity of returns across the sector over this period and has continued to widen.
It is unsurprising that several trusts have been amongst both the worst performing and best performing across certain time periods for example Tetragon Financial (LSE:TFG) and RIT Capital Partners (LSE:RCP). Although these trusts have been relatively volatile, investors have been somewhat rewarded with them contributing to the best NAV total returns more frequently over the longer term. At the same time, there have been other trusts that have performed more consistently over the period with significantly lower levels of volatility such as Ruffer Investment Company (LSE:RICA)and Capital Gearing (LSE:CGT). We noted that the dispersion in the Flexible Investment sector was the widest among all other AIC sectors, however, the divergence of growth and value over the past 12 months has resulted in the dispersion in NAV total returns across other AIC sectors to also widen. We believe the dynamics behind this increase in dispersion amongst the other sectors is more a shorter-term phenomenon and unlikely to be maintained. On the other hand, the diversity of mandates and the multi-asset exposure the Flexible Investment sector can offer means that in our view a wide dispersion of returns is likely to persist.
PERFORMANCE OF SECTOR SINCE START OF 2020 (UNWEIGHTED), INCLUDING DISTRIBUTION OF PERFORMANCE (BEST/WORST FOR ALL TIME PERIODS)
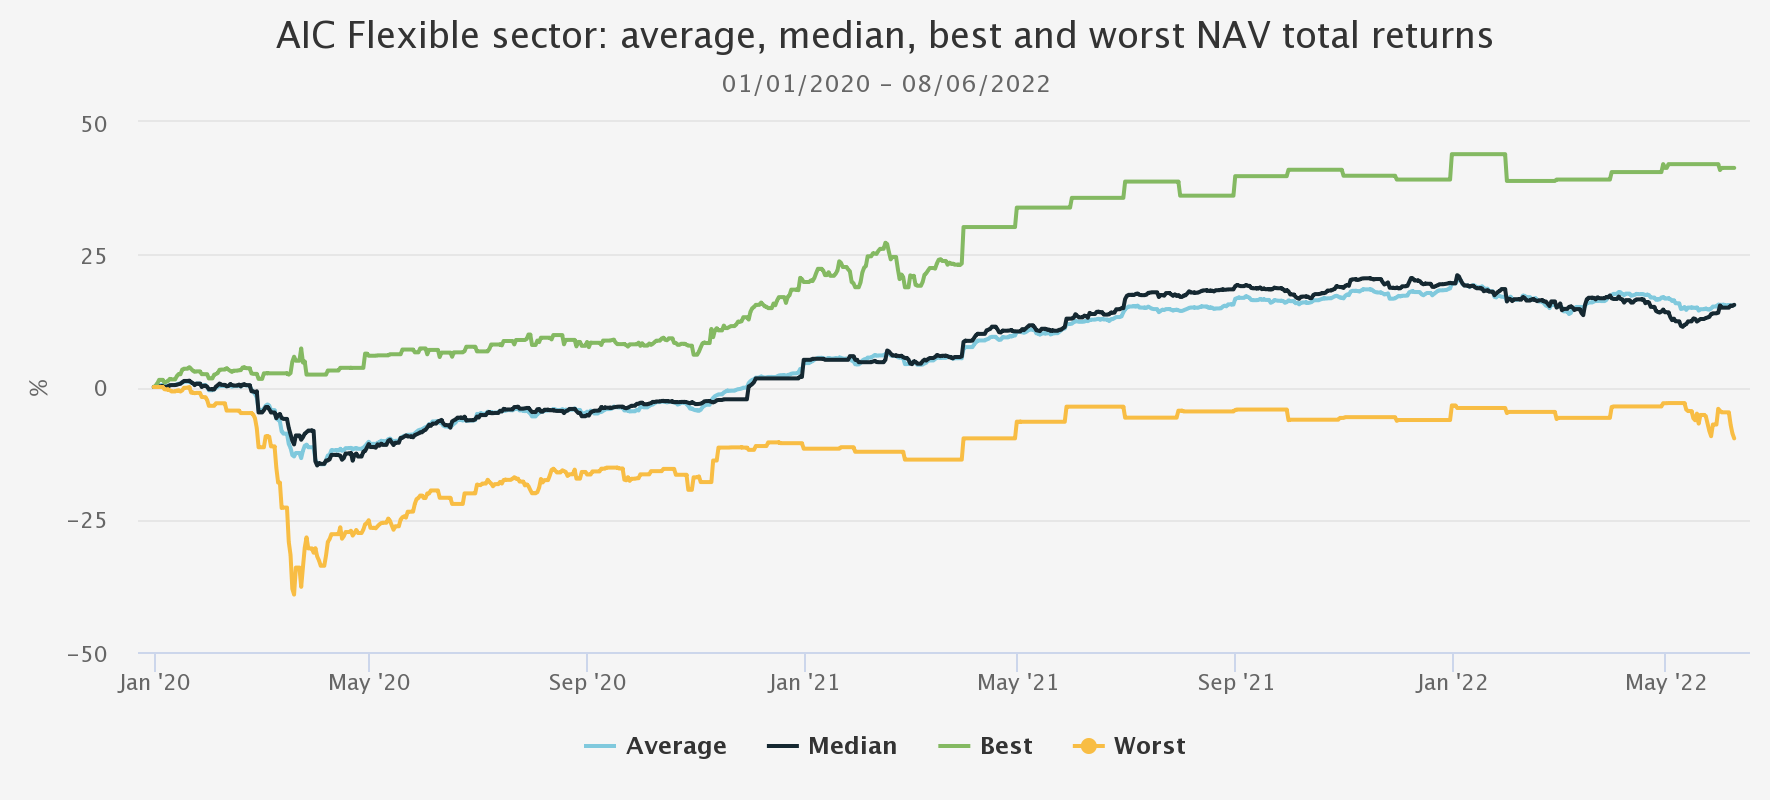
Source: Morningstar, Kepler calculations. Past performance is not a reliable indicator of future results
An allocation to the Flexible Investment sector is often considered because of the diversification benefits a relatively unrestricted, multi-asset approach can offer investors. In addition, the majority of the trusts in the sector have historically offered more favourable risk versus return characteristics (on a NAV basis) compared to broader equity markets. In the chart below, and for the remainder of this article, we see how all the trusts in the sector compare over two time periods. Generally, there hasn’t been a significant change in the average volatility of the sector over two distinct 12-month time periods (01/06/2020 to 31/05/2021 (period one) and 01/06/2021 to 31/05/2022 (period two)) with the sector’s average standard deviation decreasing marginally from 9.6% to 8.7%. This compares to the Global investment trust sector’s volatility increasing from c. 12% to c. 16% over the same period. More notable is the downward pressure on returns we have seen over the last 12 months, with NAV total returns of the flexible sector decreasing from c. 24.1% to c. 3.4%: year-to-date figures are more exaggerated. However, this reduction in returns is far less than what we have seen in the broader equity markets, as represented by the Global investment trust sector decreasing from c. 26% to c. -10.5%, as shown by the blue (period one) and orange (period two) triangles in the scatter chart below, which shows the risk-return statistics of the constituents of the Flexible Investment sector.
AIC FLEXIBLE SECTOR: NAV RETURNS VS VOLATILITY
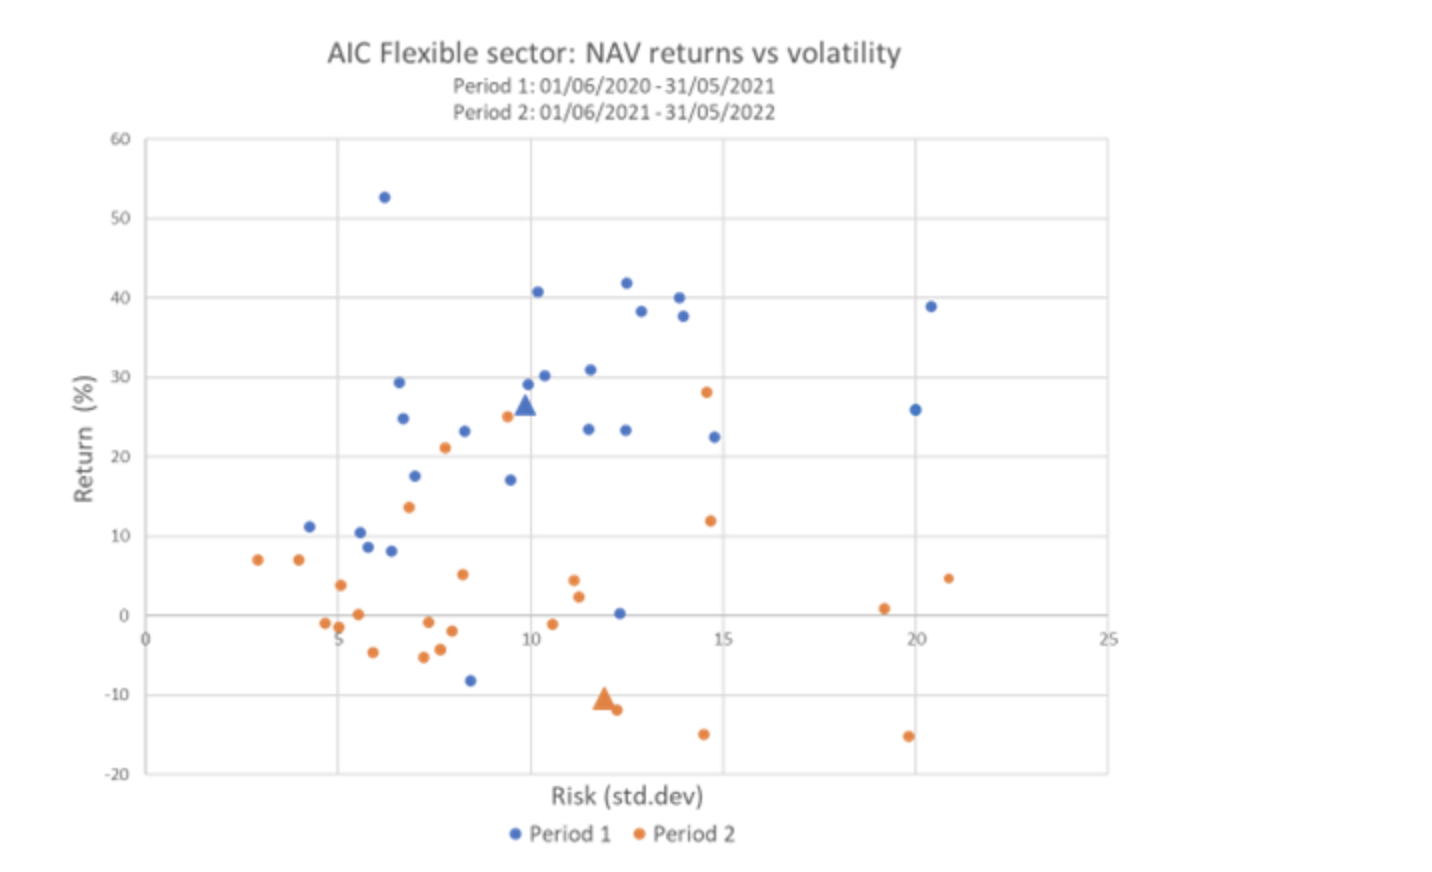
Source: Morningstar, Kepler calculations. Past performance is not a reliable indicator of future results
More information regarding the details of these sub-categories can be found in the previous article; however, we will briefly re-introduce our Flexible Investment sub-sectors again to provide some context.
The one-stop shops: 60/40 alternatives
Arguably the term ‘one-stop shop’ could be used to describe the majority of trusts within the Flexible Investment sector, meaning they can act as a core portfolio holding or alternatively as an investor’s entire portfolio. The classical structure of this kind of portfolio would be a 60% allocation to equities and 40% bonds – the theoretical balanced risk profile for the ‘average’ investor.
Using r2, which is a measure of a trust’s performance correlation relative to a benchmark (Vanguard LifeStrategy 60% Equity tracker fund), we highlighted a selection of trusts we thought are particularly suited to the claim of being a one-stop-shop. In the table below, we look at how these trusts have performed over both time periods. We note the impact of the market downturn on performance has been dramatic, with negative NAV total returns, lower batting averages and also maximum drawdown are significant. Unfortunately, the trusts within our 60/40 sub-sector have not been able to maintain the performance generated in period one, especially those with higher market exposure.
PERIOD TWO: 01/06/2021 - 31/05/2022
| RETURN (NAV TR) | BETA | R2 | BATTING AVERAGE (%) | MAX DRAWDOWN | |
| BMO Managed Portfolio Income | 29.4 | 1.08 | 93.9 | 50 | -4.7 |
| BMO Managed Portfolio Growth | 32.5 | 0.99 | 84.6 | 65 | -8.7 |
| Momentum Multi-Asset Value Trust | 42.1 | 1.28 | 88.7 | 52 | -6.3 |
| Invesco Select: Balanced Risk Allocation | 25.6 | 0.98 | 80.1 | 52 | -3.9 |
| Vanguard Life Strategy 60% Equity | 13.1 | 0.80 | n/a | 38 | -3.7 |
Source: Morningstar, Kepler calculations. Past performance is not a reliable indicator of future results
PERIOD TWO: 01/06/2021 - 31/05/2022
| RETURN (NAV TR) | BETA | R2 | BATTING AVERAGE (%) | MAX DRAWDOWN | |
| BMO Managed Portfolio Income | -1.7 | 0.93 | 86.5 | 38 | -15.0 |
| BMO Managed Portfolio Growth | -11.4 | 0.99 | 88.0 | 40 | -21.3 |
| Momentum Multi-Asset Value Trust | -1.7 | 0.67 | 62.5 | 46 | -11.3 |
| Invesco Select: Balanced Risk Allocation | -0.6 | 0.71 | 62.0 | 44 | -8.8 |
| Vanguard Life Strategy 60% Equity | -1.1 | 0.78 | n/a | 42 | -10.0 |
Source: Morningstar, Kepler calculations. Past performance is not a reliable indicator of future results
BMO Managed Portfolio, which utilises a dual share class structure through BMPGand BMPI, was able to take advantage of the growth-focused recovery following the pandemic: BMPG demonstrated one of the highest batting averages in the sector (a figure above 50% reflects the managers ability to beat the market in terms of weekly intervals). However, the relatively high market beta left the trust exposed to the downside in period two. BMPI provided slightly more downside protection for investors compared to BMPG through investments in revenue-producing alternative assets such as Hipgnosis Songs (LSE:SONG), for example. Invesco Select Balanced Risk Allocation (LSE:IVPB) is the best performer of this group, employing a quantitative process which shifts the tactical allocation of the portfolio on a monthly basis, which results in a lower market beta and reduced impact on NAV total return and Max drawdown in comparison to this sub-sector. Similarly, Momentum Multi-Asset Value Trust (LSE:MAVT) managers strict valuation discipline and fundamental approach, which has resulted in a portfolio with greater exposure to UK equities (c. 32%) and specialist assets (c. 35%), has provided the portfolio with a margin of safety, leaving the portfolio less exposed to the growth sell-off over the period two.
Return-seeking diversifiers
Our return-seeking diversifiers category includes a selection of trusts that can display a high correlation to equities as identified through a high beta to the benchmark, which in this case is the MSCI ACWI (100% equity). This can also lead to relatively high correlations to the 60/40 portfolio during periods of market growth. However, we believe this sub-set invests in a slightly broader range of asset classes to generate returns: providing additional diversification benefits as a result.
The tables below show the dispersion of returns across the two periods and include some trusts that can be considered in other subsectors, such as Aberdeen Diversified Income & Growth (LSE:ADIG). We argue in the following section that although ADIG’s managers take an absolute return approach, it has provided more protective characteristics over both periods exhibiting a consistency of returns whilst minimising drawdowns. We also categorise MIGO Opportunities (LSE:MIGO)as a return-seeking diversifier because the managers look to benefit from mispriced deep value opportunities and special situations and tend to benefit in cyclically driven rising markets by exploiting pricing inefficiencies within the investment trust market. This is shown by strong performance in period one, generating NAV total returns of c. 53%. Although it may be expected within the weaker market environment to see performance suffer, MIGO’s NAV total returns were c. -3.9% over period two.
Trusts such as Hansa and UIL have also struggled in the current economic environment, although they are able to display diversification benefits through relatively low r2 values relative to equities, their high beta values have left them exposed on the downside, reflected in the vast swings in performance over the two periods.
PERIOD ONE: 01/06/2020 - 31/05/2021
| RETURN (NAV TR) | BETA | BATTING AVERAGE (%) | MAX DRAWDOWN | ||
| MIGO Opportunities | 53.6 | 1.07 | 62 | -3.2 | |
| UIL | 39.0 | 1.22 | 48 | -13.2 | |
| Hansa Investment Company | 29.8 | 0.92 | 50 | -3.3 | |
| Aberdeen Diversified Income and Growth | 7.9 | 0.09 | 46 | -7.4 | |
| Vanguard Life Strategy 60% Equity | 13.1 | 0.80 | 38 | -3.7 |
Source: Morningstar, Kepler calculations. Past performance is not a reliable indicator of future results
PERIOD TWO: 01/06/2021 - 31/05/2022
| RETURN (NAV TR) | BETA | BATTING AVERAGE (%) | MAX DRAWDOWN | ||
| MIGO Opportunities | -3.9 | 0.65 | 40 | -13.8 | |
| UIL | -13.1 | 1.28 | 46 | -29.6 | |
| Hansa Investment Company | -5.2 | 0.87 | 48 | -12.7 | |
| Aberdeen Diversified Income and Growth | 7.1 | 0.51 | 52 | -2.55 | |
| Vanguard Life Strategy 60% Equity | -1.1 | 0.78 | 42 | -10.0 |
Source: Morningstar, Kepler calculations. Past performance is not a reliable indicator of future results
Protective diversifiers
Trusts available within the Flexible Investment sector are reviewed by many as protective diversifiers. These trusts place a greater emphasis on capital preservation and a steadier approach to generating returns, aiming to take advantage of the powers of compounding over the very long term. However, this approach can lead to returns often being perceived as lagging the broader equity market during periods of market growth. We show the performance tables below.
PERIOD ONE: 01/06/2020 - 31/05/2021
| RETURN (NAV TR) | BETA | BATTING AVERAGE (%) | MAX DRAWDOWN | STANDARD DEVIATION | |
| Aberdeen Diversified Income and Growth | 7.9 | 0.09 | 46 | -7.4 | 9.2 |
| Ruffer Investment Company | 17.6 | 0.7 | 48 | -3.5 | 9.9 |
| Capital Gearing | 11 | 0.62 | 44 | -2.7 | 6.2 |
| Personal Assets | 8.6 | 0.64 | 42 | -3.5 | 8.4 |
| RIT Capital Partners | 41.9 | 0.78 | 50 | n/a | 18 |
| Vanguard Life Strategy 60% Equity | 13.1 | 0.8 | 38 | -3.7 | 9.8 |
Source: Morningstar, Kepler calculations. Past performance is not a reliable indicator of future results
A key feature of these trusts is their downside protection. For many, this is the most important characteristic the protective diversifiers can offer, especially in light of the current economic environment. In general, volatility, as measured by the one-year standard deviation (see above), is significantly lower than the Vanguard Life strategy 60% equity fund, along with significantly lower drawdowns, better returns and batting averages over period Two. We note that CGT, RICA, andPersonal Assets (LSE:PNL)have protected capital well over the long term, but also in period Two. RCPhas also performed well in protecting capital, although the opportunity to generate stronger returns during periods of market growth, as shown in the first period’s NAV total return of 41.9% and higher batting average, is clearly offset by the slightly lower downside protection and higher volatility than the former trusts we mention. This, together with the use of more complex hedging strategies, is reason enough for us to question if RIT might be more appropriately placed in the return-seeking diversifiers group for future analysis.
We note that ADIG has maintained a consistent performance over both periods. Following a major strategic review in Q4 2020, the management of the trust was taken over by Nalaka De Silva, Jennifer Mernagh and Nic Baddeley. They have built a portfolio which aims to offer a genuinely diversified and unconstrained multi-asset portfolio, which includes a significant focus and allocation to private markets (c. 48%). The portfolio is tilted towards real assets such as infrastructure, real estate and royalties which have also been able to provide a degree of inflation protection and a source of uncorrelated income. It is worth noting that performance over period two is a more accurate reflection of the trusts long-term, private markets-focused strategy. Over period two, the trust generated a NAV total return of 7.1%, outperforming the 1.9% generated by the Flexible Investment sector peer group, along with very low volatility. In addition, ADIG has demonstrated the lowest drawdown of any trust in the Flexible Investment sector and an improved batting average along with its peers in this subsector.
Another trust we would consider provides an element of diversified protection is Schroder BSC Social Impact Trust (LSE:SBSI). SBSI provides an opportunity to invest in an ‘ESG’ strategy – something which is not typically associated with the Flexible Investment sector, and its different nature is demonstrated by its low beta value of 0.22 over period two. The managers, Big Society Capital are a specialist social impact investor focused on addressing UK social challenges. This trust has the potential to provide uncorrelated sources of cash flows which are backed by government subsidies and directly tied to the success of their outcomes. We hope to be publishing our first note on the trust soon. Please click here to be alerted when we do so.
Hedge fund-style strategies
We see this sub-sector as one which provides an opportunity for investors to gain access to more absolute return-type strategies. The hedge fund sector is very broad, and as such, we expect this sub-sector of trusts to employ a more unrestricted investment strategy which exhibits greater diversification and a more uncorrelated return profile to broader equity markets. Again, there is some overlap here with the protective diversifier sector, and we would typically expect some hedge fund style strategies to display lower volatility and the ability to minimize drawdowns, as they can use hedging strategies to dampen down risk.
We referred to Third Point Investors (LSE:TPOU)in our previous note and our reasoning behind its suitability for inclusion in this subsector. TPOU is effectively a long-biased multi-asset fund. As one might have expected, given its relatively high exposure to venture capital and early-stage technology companies, it has displayed significant volatility (as shown by the standard deviation) and dispersion of NAV total returns over periods one and two, along with a maximum drawdown of c. 26% over the latter period. We wonder whether TPOU would be better represented in the return-seeking diversifiers category.
PERIOD ONE: 01/06/2020 - 31/05/2021
| RETURN (NAV TR) | BETA | BATTING AVERAGE (%) | |
| Tetragon Financial | 14.13 | 0.29 | 40 |
| Ruffer Investment Company | 17.6 | 0.7 | 48 |
| Third Point Investors | 56.82 | 0.54 | 56 |
Source: Morningstar, Kepler calculations. Past performance is not a reliable indicator of future results.
PERIOD TWO: 01/06/2021 - 31/05/2022
| RETURN (NAV TR) | BETA | BATTING AVERAGE | MAX DRAWDOWN | STANDARD DEVIATION | |
| Tetragon Financial | 13.9 | 0.29 | 54 | -9.8 | 11.9 |
| Ruffer Investment Company | 4.9 | 0.44 | 50 | -4.6 | 5 |
| Third Point Investors | -10.3 | 0.54 | 54 | -26.5 | 17.4 |
Source: Morningstar, Kepler calculations. Past performance is not a reliable indicator of future results
We touched on the inflation sensitivities of a handful of trusts offering varying degrees of protection against inflation, including RICA, CGT and PNL. As noted in the protective diversifiers section, these trusts have performed well over the past 12 months, which seems logical given the evolution of inflationary pressures over this period. In the previous note, we highlighted that RICA’s managers, Duncan MacInnes and Hamish Baillie, have maintained their flexible yet risk-averse approach throughout the 24-month period following the coronavirus pandemic. The trusts unconstrained approach has allowed it to grow investors’ capital over the long-term while protecting it against the inflationary pressures and rate-hiking cycles by incorporating hedging strategies that reduce their exposure to any single theme. For example, one such hedging strategy that has paid off over the past 12 months has been their allocation to interest rate options which increase in value as interest rates rise and have offset their detracting position in index-linked bonds.
As we see in period two, the breadth of strategies in this subsector can leave investors sometimes exposed to higher levels of volatility and greater drawdowns when looking over isolated periods of downward market pressures. However, TFG has provided investors with a source of returns uncorrelated to equity markets generating one of the highest NAV total returns within the Flexible Investment sector of 13.9% against the Morningstar Flexible Investment sector peer group average of 1.9%. The highly diverse nature of the portfolio, as shown by its relatively low beta of 0.29, has enabled Tetragon to maintain its consistent performance over the last 12 months, reflected in a batting average of over 50% over both periods.
Conclusion
The two periods under examination are useful in that they offer very different market conditions and – while any actual investment in one of these trusts should be made with a longer-term time horizon – examine the performance of the wide variety of strategies in the Flexible Investment sector in these two very different phases is illuminating.
In our view, the diverse spread of strategies present in this sector should mean most investors can find something that suits their needs. However, as we have shown, comparisons across the sector are difficult for the same reason - making it necessary to break the sector down into the more comparable groups that we offer.
Kepler Partners is a third-party supplier and not part of interactive investor. Neither Kepler Partners or interactive investor will be responsible for any losses that may be incurred as a result of a trading idea.
These articles are provided for information purposes only. Occasionally, an opinion about whether to buy or sell a specific investment may be provided by third parties. The content is not intended to be a personal recommendation to buy or sell any financial instrument or product, or to adopt any investment strategy as it is not provided based on an assessment of your investing knowledge and experience, your financial situation or your investment objectives. The value of your investments, and the income derived from them, may go down as well as up. You may not get back all the money that you invest. The investments referred to in this article may not be suitable for all investors, and if in doubt, an investor should seek advice from a qualified investment adviser.
Full performance can be found on the company or index summary page on the interactive investor website. Simply click on the company's or index name highlighted in the article.
Important Information
Kepler Partners is not authorised to make recommendations to Retail Clients. This report is based on factual information only, and is solely for information purposes only and any views contained in it must not be construed as investment or tax advice or a recommendation to buy, sell or take any action in relation to any investment.
This report has been issued by Kepler Partners LLP solely for information purposes only and the views contained in it must not be construed as investment or tax advice or a recommendation to buy, sell or take any action in relation to any investment. If you are unclear about any of the information on this website or its suitability for you, please contact your financial or tax adviser, or an independent financial or tax adviser before making any investment or financial decisions.
The information provided on this website is not intended for distribution to, or use by, any person or entity in any jurisdiction or country where such distribution or use would be contrary to law or regulation or which would subject Kepler Partners LLP to any registration requirement within such jurisdiction or country. Persons who access this information are required to inform themselves and to comply with any such restrictions. In particular, this website is exclusively for non-US Persons. The information in this website is not for distribution to and does not constitute an offer to sell or the solicitation of any offer to buy any securities in the United States of America to or for the benefit of US Persons.
This is a marketing document, should be considered non-independent research and is subject to the rules in COBS 12.3 relating to such research. It has not been prepared in accordance with legal requirements designed to promote the independence of investment research.
No representation or warranty, express or implied, is given by any person as to the accuracy or completeness of the information and no responsibility or liability is accepted for the accuracy or sufficiency of any of the information, for any errors, omissions or misstatements, negligent or otherwise. Any views and opinions, whilst given in good faith, are subject to change without notice.
This is not an official confirmation of terms and is not to be taken as advice to take any action in relation to any investment mentioned herein. Any prices or quotations contained herein are indicative only.
Kepler Partners LLP (including its partners, employees and representatives) or a connected person may have positions in or options on the securities detailed in this report, and may buy, sell or offer to purchase or sell such securities from time to time, but will at all times be subject to restrictions imposed by the firm's internal rules. A copy of the firm's conflict of interest policy is available on request.
Past performance is not necessarily a guide to the future. The value of investments can fall as well as rise and you may get back less than you invested when you decide to sell your investments. It is strongly recommended that Independent financial advice should be taken before entering into any financial transaction.
PLEASE SEE ALSO OUR TERMS AND CONDITIONS
Kepler Partners LLP is a limited liability partnership registered in England and Wales at 9/10 Savile Row, London W1S 3PF with registered number OC334771.
Kepler Partners LLP is authorised and regulated by the Financial Conduct Authority.