Stockwatch: this sector could be a prime contrarian pick
After spending several years in a volatile downtrend, analyst Edmond Jackson believes there may now be value in this cyclical industry. Three stocks catch his eye.
17th October 2025 11:37
by Edmond Jackson from interactive investor

Since one adage is to sell shares that fall on record operating results, does the inverse apply – to buy those rising after declaring another set of poor numbers?
- Invest with ii: Top UK Shares | Share Tips & Ideas | Cashback Offers
When shares top out, the inference is that the technical situation (balance between buyers and sellers) is weakening as most investors who are likely to own the shares already do, and those sitting on big profits are edgy as soon as there’s no immediate rise from the operating numbers. Any selling is into a weak market, so the price drops.
Similarly on the downside, then, where the selling has started to exhaust itself, a company may only need to declare “things are no worse than expected” (whether by management or the market) for shares to rise.
Obviously, we need to be selective, ensuring the company is not in fundamental long-term decline and that the sector doesn’t have bad economics. There are plenty of possible rallies in a bear market; it’s why some investors prefer the chart to properly establish a low/reversal over time, such as a “bowl” pattern.
Recruiters have risen 9-21% in under four weeks
Mid-cap recruitment companies Hays (LSE:HAS) and PageGroup (LSE:PAGE) have nearly mirrored each other from the third week in September, although Hays didn’t issue an update in respect of its first quarter to 30 September until 10 October, followed by PageGroup’s third-quarter 2025 update on 15 October.
There initially looks to be some macro influence, with possibly a bout of selling in September having been absorbed, hence an upwards adjustment.
Hays’ best region was Australia & New Zealand, where net fee income (the essential performance benchmark in this industry) fell 5% year-on-year, but Germany fell 7% and the UK and Ireland 9%. There was an 8% drop at the group level, with a typical split in challenged times, of temporary/contracting down 5% but permanent down 13%.
Management spoke of further structural cost savings being made, hence its comment that “we will benefit materially when markets recover” but “we have limited forward visibility...this is likely to persist through the 2026 fiscal year”.
PageGroup similarly cited group net fee income down 7% in the third quarter but with the US relatively strong, affirming macro data of resilience despite fears of tariff effects.
- Reaction to Entain and PageGroup third-quarter results
- FTSE 100 dividend stars: City view on M&G, Phoenix and L&G
The Americas as a whole edged up 0.4% or 3.5% at constant currency, whereas Europe, the Middle East and Africa fell 8%, Asia-Pacific nearly 5% and the UK over 14%. Temporary employment offered no respite, down 6.5% versus 7.0% for permanent.
The outlook was quite similarly ambivalent amid “subdued levels of sentiment and confidence in Europe, particularly our two largest markets, France and Germany, as well as in the UK”. There was the standard pleasantry issued by cyclical firms about how “we remain confident in the execution of our strategy”, while avoiding the cliché of “well positioned to take advantage of the upturn when it comes”, which you probably will see elsewhere in the industry.
Robert Walters (LSE:RWA) is more positively explicit about prospects, which is likely why its shares rose 7% on each of the two days following a third-quarter 2025 update last Tuesday. This is despite year-on-year group net fee income dropping 12% over the three months, or 13% in the first nine months, albeit “with some improvement on the second quarter” such that fees were down 9% in September. It’s not yet clear how significant a change that is. At least the market appeared to think it significant enough in the near term.
Since this group was founded by Australians, Asia Pacific remains the largest segment at 45% and it fell the least this quarter at 6%. Europe fell 24%, the UK 5% and rest of world (including a modest US exposure) by 17%.
There was “broad-based improvement” within Asia Pacific’s modest decline and UK specialist recruitment grew year-on-year. It appears the market is respecting Walters’ geographic exposure to this often more vibrant region.
The outlook statement is a curate’s egg, mind. It said: “While we are seeing signs of sustained improvement in a select number of hiring markets, overall conditions globally remain fragile. As such, our planning assumption continues to be that recovery in hiring markets will develop very gradually.”
Scope to take bullish long-term view
Yes, any improvements may only be very gradual but the trend is all important, and it’s possible to conjure various earnings outcomes on these recruiters, especially looking a few years ahead. Cyclical shares especially, often do try to anticipate recovery.
The obvious dilemma is that there’s so much uncertainty: the US-China trade wars, conflating with an eventual impact from US tariffs; global sovereign debt; and whether stock markets fall and affect consumer spending.
- SpaceX supplier tipped to generate 44% upside
- Sign up to our free newsletter for investment ideas, latest news and award-winning analysis
This time last year I wrestled with recruiters and stood back from “buy” stances, but felt that it could be an over-reaction to issue a “sell” rating unless the economy turned down. Since then, Hays has fallen as much as 38%, PageGroup 40% and Walters 67%.
The extent of such declines begs the question - might such shares be roughly around trough value?
Valuation multiples can still seem high
Where the market respects longer-term prospects for earnings recovery, and where the businesses have a strong competitive position, higher price/earnings (PE) multiple are to be expected.
But there are other considerations here. Might investment in artificial intelligence (AI) fundamentally reduce the number of jobs, even in high-skilled white-collar roles? I tend to see the effect as marginal rather than transformational; decades ago we were told machines would take over and that the problem would be filling leisure time!
On a 12-month forward basis, for what consensus forecasts are currently worth, at around 58p Hays looks to be on a multiple around 29x while yielding only 1.5%, despite re-visiting share price lows around the 2008 crash and again in 2011 during the eurozone debt crisis.
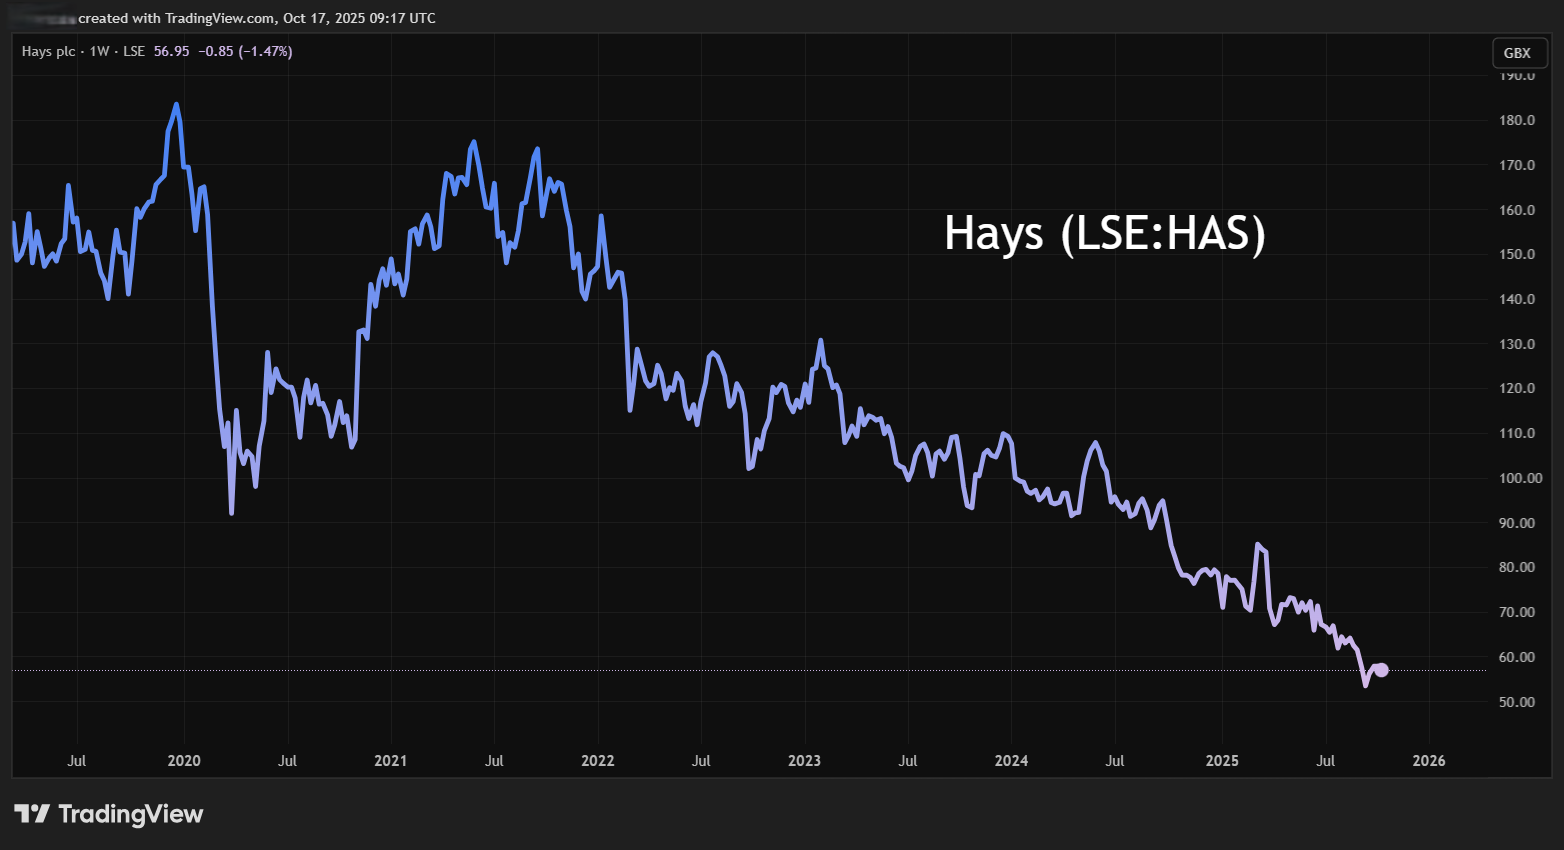
Source: TradingView. Past performance is not a guide to future performance.
PageGroup, at 238p, is similarly on a 29x PE where a yield of 6.75% is explained by consensus for earnings cover below 0.5 versus compared with more like 2.0 for Hays. Make of that what you will, but in the short to medium term it looks like the cut to special dividends from 2024 will remain.
PageGroup - financial summary
Year end 31 Dec
| 2015 | 2016 | 2017 | 2018 | 2019 | 2020 | 2021 | 2022 | 2023 | 2024 | |
| Turnover (£ million) | 1,065 | 1,196 | 1,372 | 1,550 | 1,654 | 1,305 | 1,644 | 1,990 | 2,010 | 1,739 |
| Operating margin (%) | 8.5 | 8.4 | 8.6 | 9.2 | 8.9 | 1.3 | 10.3 | 9.9 | 5.9 | 3.0 |
| Net profit (£m) | 66.2 | 72.1 | 83.1 | 104 | 103 | -5.7 | 118 | 139 | 77.1 | 28.4 |
| Reported earnings/share (p) | 21.1 | 23.1 | 26.4 | 32.4 | 32.2 | -1.8 | 37.0 | 43.5 | 24.3 | 9.0 |
| Normalised earnings/share (p) | 21.3 | 23.1 | 26.4 | 32.4 | 32.2 | -1.7 | 37.0 | 44.5 | 26.7 | 10.5 |
| Return on capital (%) | 39.5 | 39.3 | 40.8 | 42.1 | 33.5 | 4.3 | 38.7 | 43.2 | 29.5 | 13.8 |
| Operating cash flow/share (p) | 26.3 | 28.4 | 27.4 | 28.3 | 48.9 | 42.9 | 46.7 | 57.9 | 48.3 | 40.2 |
| Capex/share (p) | 4.8 | 8.1 | 6.7 | 8.0 | 8.2 | 7.1 | 8.9 | 9.9 | 9.9 | 5.8 |
| Free cash flow/share (p) | 21.5 | 20.3 | 20.8 | 20.3 | 40.7 | 35.8 | 37.8 | 48.0 | 38.4 | 34.4 |
| Ordinary dividend per share (p) | 11.5 | 12.0 | 12.5 | 13.1 | 13.7 | 0.0 | 15.0 | 15.7 | 16.4 | 17.1 |
| Special dividend per share (p) | 16.0 | 6.4 | 12.7 | 12.7 | 12.7 | 0.0 | 26.7 | 26.7 | 15.9 | 0.0 |
| Covered by earnings (x) | 0.8 | 1.3 | 1.0 | 1.3 | 1.2 | 0.0 | 0.9 | 1.0 | 0.8 | 0.5 |
| Cash (£m) | 95.0 | 92.8 | 95.6 | 97.7 | 97.8 | 166 | 154 | 131 | 90.1 | 95.3 |
| Net assets per share (p) | 68.0 | 75.6 | 82.6 | 97.0 | 98.7 | 96.1 | 103 | 107 | 93.3 | 79.9 |
Source: historic company REFS and company accounts.
But as shown by the 10-year context, this company delivered earnings per share (EPS) in a circa 20p to 40p range and was cash generative, requiring little capital expenditure, hence its special dividend culture. Roughly median EPS of 30p implies a PE of 8x if the group can recover to those returns. The market expects EPS around 4p this year and towards 10p in 2026.
Walters looks the livelier recovery prospect given its small-cap status and Asia Pacific weighting. At 139p, it trades on 24x consensus for EPS of 5.7p in 2026, but if you respect the 45p achieved in 2017-18, and higher in 2021-22, then the PE drops to an astonishingly low 3x.
Robert Walters - financial summary
Year-end 31 Dec
| 2015 | 2016 | 2017 | 2018 | 2019 | 2020 | 2021 | 2022 | 2023 | 2024 | |
| Turnover (£ million) | 813 | 999 | 1,166 | 1,233 | 1,216 | 938 | 971 | 1,100 | 1,064 | 892 |
| Operating margin (%) | 2.8 | 2.6 | 3.6 | 4.0 | 4.2 | 1.6 | 5.6 | 5.3 | 2.5 | 0.6 |
| Operating profit (£m) | 23.1 | 26.2 | 41.9 | 49.7 | 51.2 | 14.8 | 54.1 | 58.2 | 26.3 | 5.2 |
| Net profit (£m) | 15.3 | 19.9 | 29.3 | 35.6 | 34.0 | 5.7 | 33.5 | 39.1 | 13.4 | -6.0 |
| Reported earnings/share (p) | 18.7 | 25.4 | 38.9 | 45.8 | 44.9 | 7.5 | 43.7 | 53.4 | 19.0 | -9.1 |
| Normalised earnings/share (p) | 19.3 | 26.0 | 39.5 | 46.2 | 45.0 | 8.9 | 43.0 | 53.8 | 19.0 | -9.1 |
| Return on capital (%) | 24.7 | 25.2 | 33.9 | 32.2 | 23.3 | 6.8 | 23.7 | 23.8 | 11.5 | 2.7 |
| Operating cashflow/share (p) | 19.3 | 37.6 | 42.4 | 80.8 | 92.3 | 131 | 43.9 | 52.0 | 64.6 | 30.1 |
| Capex/share (p) | 7.3 | 6.4 | 9.3 | 8.1 | 12.6 | 13.1 | 17.2 | 21.7 | 22.6 | 15.4 |
| Free cashflow/share (p) | 12.0 | 31.2 | 33.1 | 72.7 | 79.7 | 118 | 26.7 | 30.3 | 42.0 | 14.8 |
| Dividend per share (p) | 7.1 | 8.5 | 12.0 | 14.7 | 4.5 | 15.5 | 20.4 | 23.5 | 23.5 | 23.5 |
| Covered by earnings (x) | 2.6 | 3.0 | 3.2 | 3.1 | 10.0 | 0.5 | 2.1 | 2.3 | 0.8 | -0.4 |
| Cash (£m) | 43.4 | 62.6 | 61.9 | 79.9 | 112 | 156 | 142 | 123 | 95.7 | 68.1 |
| Net assets per share (p) | 119 | 133 | 162 | 202 | 211 | 222 | 228 | 246 | 228 | 191 |
Source: historic company REFS and company accounts.
The company is expected to make a near £11 million net loss this year, mind, and a 23.5p dividend was maintained last year, despite negative EPS of 9p. The last interim dividend was passed on the grounds of maintaining a strong balance sheet, which as at 30 June had £55.1 million cash, down 13% year-on-year, while near-term bank debt rose 71% to £25.0 million, although total leases fell 15% to £68.4 million. The interim net interest charge was £2.0 million, extending a £7.8 million operating loss.
You can perhaps see how Walters shares are sensitive to any hint of a silver lining to presently dark clouds.
At current levels, I regard PageGroup as interesting both for future yield and capital upside; Walters also, especially for potential capital growth. While I haven’t assessed Hays in similar detail, I notice that its shares do track PageGroup quite closely, and on 1 October a Hays director bought £96,200 worth of shares at 56.6p versus 58.1p today. There hasn’t been similar material insider buying at PageGroup, although several Walters’ directors are under water on purchases at around 375p some 18 months ago.
They are tantalising situations: there’s possible further downward drift if economies weaken, but you might never catch the trough, and the market will try to anticipate recovery. If you understand that higher risk and speculation is involved, then I rate all three stocks a “buy” with an averaging-in approach.
Edmond Jackson is a freelance contributor and not a direct employee of interactive investor.
Lee Wild, ii’s head of editorial, owns Hays shares
These articles are provided for information purposes only. Occasionally, an opinion about whether to buy or sell a specific investment may be provided by third parties. The content is not intended to be a personal recommendation to buy or sell any financial instrument or product, or to adopt any investment strategy as it is not provided based on an assessment of your investing knowledge and experience, your financial situation or your investment objectives. The value of your investments, and the income derived from them, may go down as well as up. You may not get back all the money that you invest. The investments referred to in this article may not be suitable for all investors, and if in doubt, an investor should seek advice from a qualified investment adviser.
Full performance can be found on the company or index summary page on the interactive investor website. Simply click on the company's or index name highlighted in the article.
Disclosure
We use a combination of fundamental and technical analysis in forming our view as to the valuation and prospects of an investment. Where relevant we have set out those particular matters we think are important in the above article, but further detail can be found here.
Please note that our article on this investment should not be considered to be a regular publication.
Details of all recommendations issued by ii during the previous 12-month period can be found here.
ii adheres to a strict code of conduct. Contributors may hold shares or have other interests in companies included in these portfolios, which could create a conflict of interests. Contributors intending to write about any financial instruments in which they have an interest are required to disclose such interest to ii and in the article itself. ii will at all times consider whether such interest impairs the objectivity of the recommendation.
In addition, individuals involved in the production of investment articles are subject to a personal account dealing restriction, which prevents them from placing a transaction in the specified instrument(s) for a period before and for five working days after such publication. This is to avoid personal interests conflicting with the interests of the recipients of those investment articles.