Divvying up investment trusts in the flexible sector
Kepler Trust Intelligence splits investment trusts in the sector into two different groups of diversifiers.
14th June 2024 14:47

This content is provided by Kepler Trust Intelligence, an investment trust focused website for private and professional investors. Kepler Trust Intelligence is a third-party supplier and not part of interactive investor. It is provided for information only and does not constitute a personal recommendation.
Material produced by Kepler Trust Intelligence should be considered a marketing communication, and is not independent research.
The Flexible sector continues to be rather hard to pin down. A glass-half-full view might show the sector as a poster child of all that makes investment trusts so great – the ability to allocate capital pretty much anywhere, irrespective of the difficulties presented by illiquidity and unburdened by the confines of narrow mandates. A glass-half-empty view might be that the sector represents a rag-tag of misfits and oddball trusts that perhaps fit nowhere else.
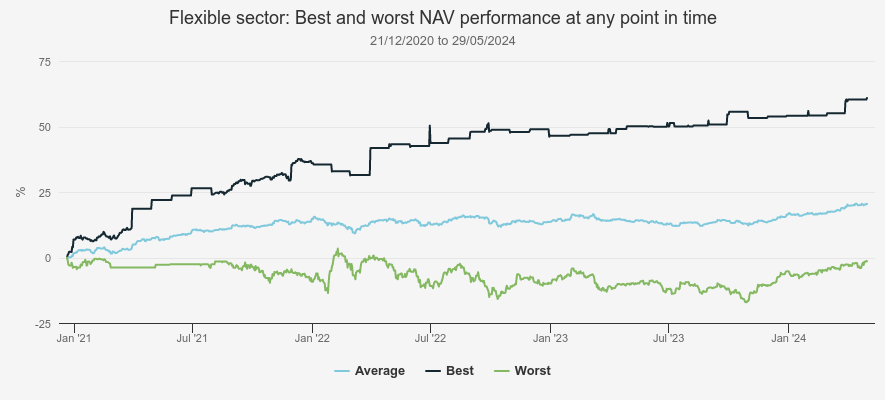
The reality of this sector is that it continues to show a very high dispersion of returns, which has a couple of important consequences. Fundamentally, a sector name should help investors understand (broadly) what they are getting. And second, a peer group should represent a reasonable benchmark with which to compare trusts. As it stands, the Flexible sector arguably does neither. As we highlight in the graph below, trusts continue to show very different return characteristics.
PERFORMANCE OF SECTOR SINCE START OF 2020 (UNWEIGHTED), INCLUDING DISTRIBUTION OF PERFORMANCE (BEST/WORST FOR ALL TIME PERIODS)
Source: Morningstar, Kepler calculations. Past performance is not a reliable indicator of future results
Our previous two attempts (here and here) to define the Flexible sector better have been undone by subsequent events. Since 2021, when we first attempted a categorisation, several trusts have drawn stumps, which means that two of our previous four categories of trusts with similar characteristics are now categories with only one trust. Others have also joined the Flexible sector following changes to their mandate. As a result, and looking at the sector with a fresh pair of eyes, we attempt once again to categorise what some might say is the un-categorisable.
Arbitrary decisions…
Trusts in the Flexible sector have a number of different objectives and investment strategies. With a sober assessment of their similarities and differences, before we pronounce on a new categorisation, there is one other subgroup that we are not proposing to include in our analysis.
These trusts have rather ‘esoteric’ strategies and/or very concentrated portfolios, but they also have a very significant single shareholder, or group of shareholders. These include Bailiwick (97% owned by one family), Castelnau (Valderrama, or Dignity Group represents 92% of the portfolio) and UIL (one of Duncan Saville’s investment vehicles). While Hansa, New Star (John Duffield owns 59.1%) and Caledonia have significant family shareholders who influence the investment strategy, they have reasonably balanced portfolios that, while the discount to NAV may not narrow because of the strictures presented by significant shareholders, and still offer a diversified portfolio and a coherent investment strategy. As such, we include the latter three trusts in our analysis, but exclude the others. Abrdn Diversified Income and Growth is in a wind-up process, and as such we exclude it too.
Hoping not to test our readers’ patience too greatly by moving goalposts, we are also adding two trusts to our analysis, both of which currently represent the significant players in the AIC’s Hedge Fund sector. Third Point Offshore and BH Macro in our view share some characteristics with our two new categories within the Flexible sector, and aside from their relatively high charges ratios, in some ways represent shining examples of what the Flexible sector might offer investors.
Breaking down the sector into two subgroups
In simple terms, we believe there is a case to be made for the Flexible sector to be seen as two different types of diversifying trusts. The ‘return-seeking diversifiers’ think less about risk in absolute terms, and more about risk in relative terms compared to equity markets. This set are correlated to equity markets, but perhaps seek to achieve returns with a lower volatility than equity markets. By investing in specialist areas of the market, these trusts tend to distinguish their returns from a simple beta 1 or ETF exposure. Their aim over time is to generate returns ahead or in line with world equities but with less of a bumpy ride. These trusts aim to reduce volatility with actively managed exposures in other asset classes. As such, we would expect drawdowns to be less than equity markets but not necessarily insignificant, given these trusts do still have a hefty element of equity exposure. We would expect that over time, their risk-adjusted returns should be better than equity markets, but rather than seeing risk in absolute terms (as implied by a Sharpe ratio), we would see risk-adjusted returns in the context of equity market exposure, or beta (as implied by the Treynor ratio). So we think the best yardstick for measuring returns and risk for these trusts is in relative terms, rather than in absolute terms.
The other group we call the ‘defensive diversifiers’. This group of trusts aims to deliver absolute returns - in many cases ahead of inflation over time - and seeks to achieve this aim by investing mainly outside quoted equity markets. NAV volatility is expected to be considerably lower than equity markets.
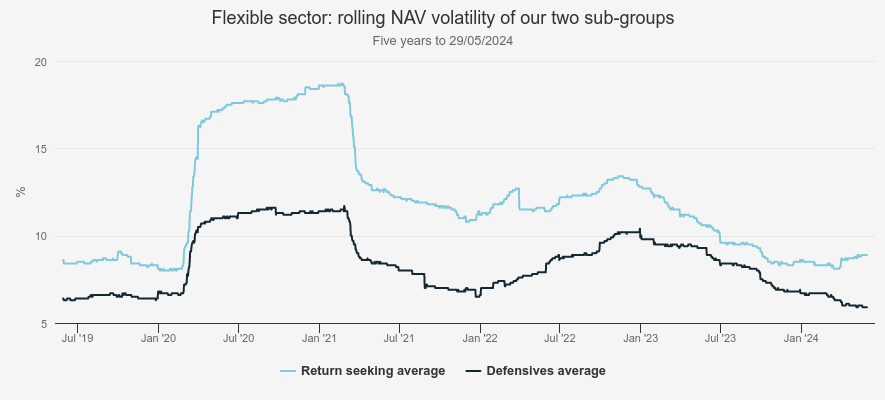
We show below the rolling volatility of the two different groups we identify, suggesting that, at least on the surface, we are on the right track.
ROLLING VOLATILITY
Source: Morningstar, Kepler Partners Past performance is not a reliable indicator of future returns
Return-seeking diversifiers
We show below the trusts we believe fit the bill of being a return-seeking diversifier. Assuming these trusts achieve what we understand they are aiming to do, they will add good diversification to a portfolio, without necessarily reducing long-term returns. As we show, exposure to public market equities is typically above 50%, with the average just shy of 70%. Private equity (i.e. equity in companies that are private – which can be one or a combination of buyouts, venture or growth capital) typically represents between 0% -35%, whilst non-equity, alternative, real assets or cash makes up an average of 20%. The average discount to NAV of this group of trusts is around 20%, although given the aforementioned large family shareholdings in some of these trusts, we would not advocate seeing all of these trusts as prospective discount narrowers.
RETURN-SEEKING DIVERSIFIERS: PORTFOLIO COMPOSITION & DISCOUNT
| GROUP / INVESTMENT | % QUOTED EQUITY | % PRIVATE EQUITY | % NON-EQUITY / ALTERNATIVE / REAL ASSETS / CREDIT/ CASH | DISCOUNT (%) |
| Caledonia Investments Ord (LSE:CLDN) | 62 | 28 | 10 | -37 |
| Third Point Investors USD Ord (LSE:TPOU) | 61 | 6 | 33 | -22 |
| RIT Capital Partners Ord (LSE:RCP) | 41 | 35 | 24 | -27 |
| Hansa Investment Company Ltd Ord (LSE:HAN) | 89 | 0 | 11 | -43 |
| MIGO Opportunities Trust Ord (LSE:MIGO) | 69 | 0 | 31 | -2 |
| Global Opportunities Trust Ord (LSE:GOT) | 43 | 8 | 49 | -16 |
| New Star Investment Trust Ord (LSE:NSI) | 83 | 2 | 15 | -38 |
| CT Global Managed Portfolio Growth Ord (LSE:CMPG) | 100 | 0 | 0 | -3 |
| CT Global Managed Portfolio Income Ord (LSE:CMPI) | 100 | 0 | 0 | 2 |
| Majedie Investments Ord (LSE:MAJE) | 57 | 0 | 43 | -10 |
| Average | 71 | 8 | 22 | -20 |
Source: Kepler Partners, Morningstar. Past performance is not a reliable indicator of future results
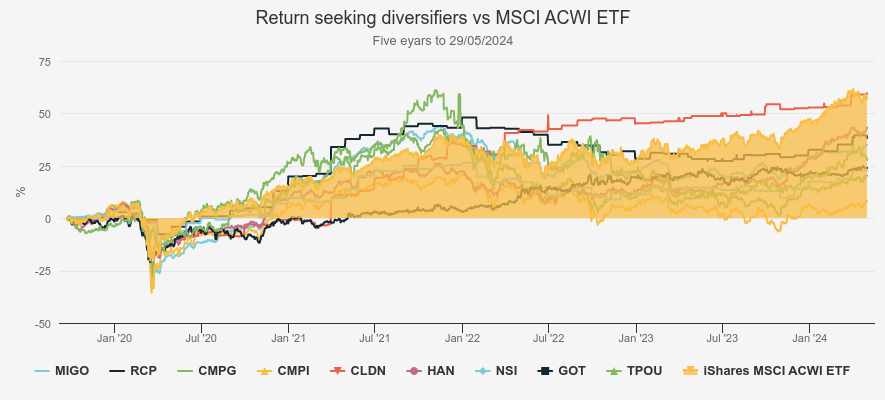
The last five years offers an interesting window to review performance of this group. The rather crowded graph below illustrates that most of this group fell less in NAV terms than global equities in the early parts of 2020, and many rebounded faster than equities in the rally of 2021. We would highlight Third Point Investors USD Ord (LSE:TPOU) and RIT Capital Partners Ord (LSE:RCP)as being strong performers during this period on a NAV basis. However, both have suffered poor NAV performance since then, whilst Caledonia Investments (LSE:CLDN) (CLDN) and Hansa (HAN)have delivered strong performances over 2022 and subsequently. Of this group, only CLDN has outperformed equities over the five-year period, but as we shall come to later, many of the return-seeking defensive group’s lower beta characteristics mean that outperformance of equities is perhaps not the fairest yardstick for these trusts.
FIVE-YEAR NAV RETURNS VS. GLOBAL EQUITIES
Source: Morningstar. Past performance is not a reliable indicator of future returns
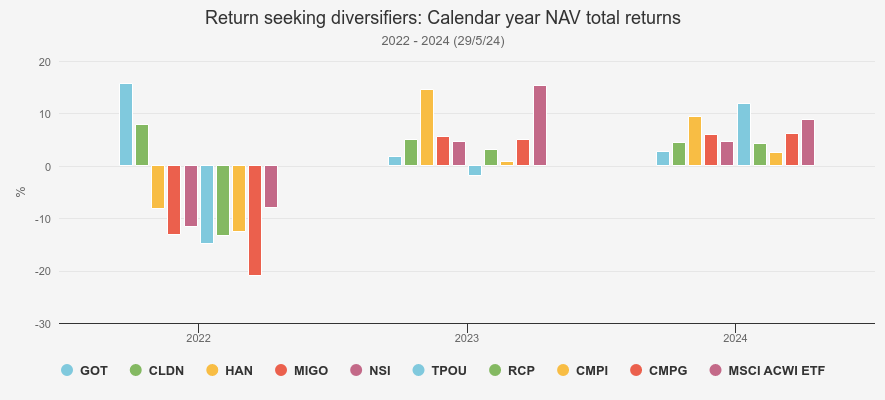
In the graph below we illustrate the NAV performance of the subgroup in recent calendar years. Most of these trusts have underperformed world equities in 2022, 2023 and so far in 2024. However, in our view this is missing the point to some extent, although we would have hoped that performance on the downside would have been better in a negative year such as 2022. That was the year in which the Covid-19-induced ‘everything rally’ was popped, and growth strategies in particular suffered, meaningCT Global Managed Portfolio Growth Ord (LSE:CMPG) shares in particular delivered a poor performance.
On the other hand, Global Opportunities Trust, the self-managed trust run by Sandy Nairn, which entered the Flexible sector in 2022, put in a strong performance thanks to the value bias of the trust, as well as high cash levels and a mid-teens allocation to a long-short fund. Caledonia’s strong performance was a result of the very strong performance of their private capital pool of assets. On the whole, however, performance during 2022 (seen in isolation) seems to have been a poor one for this group of trusts, with the average significantly underperforming world equity markets. For those trusts with holdings in other investment trusts in their portfolio, this period was especially tough, given the significant widening of discounts across the sector.
Fresh challenges arrived in 2023, including the bankruptcy of Silicon Valley Bank. However, despite worries of global financial stability and Credit Suisse being forcibly taken over by UBS, equity markets staged quite a recovery, which has largely continued into 2024. For 2023 TPOU delivered a very underwhelming result, but performance during 2024 has seen it make up some of the lost ground by delivering the best NAV performance of this subgroup of trusts so far this calendar year. Over the entire period, by delivering a performance broadly in line with world equities, HAN has done well, although as the risk statistics below show, it has a much higher correlation to equities than peers, which does not necessarily add to its attractions as a diversifier. A surprisingly consistent performer has beenMIGO Opportunities Trust Ord (LSE:MIGO), which while underperforming in 2022, has delivered reasonable returns since then relative to the peer group. With the trust invested in an array of eclectic investment trusts on wide discounts, the potential for MIGO to continue to benefit from the higher pace of corporate activity seen in the sector is clearly there, with the trust a beneficiary of the cash offer for Foresight Sustainable Forestry but one example.
RECENT NAV RETURNS
Source: Morningstar. Past performance is not a reliable indicator of future returns
NAV returns are relatively bald statistics, especially given the nuances of the trusts within the Flexible sector, all of which have relatively open mandates. The risks that managers are taking to achieve returns is clearly a critical piece of information to consider. In the table below we summarise various risk metrics for this subgroup. Of course, some of these statistics may be flattered by only publishing NAVs monthly, or weekly in other cases. Overall, the last five years has been a relatively strong period for equity returns, with the MSCI ACWI achieving an annualised return of 9.4%, and in this context returns from this peer group are by and large underwhelming. However, the table shows that taking into account the much lower risks some trusts have achieved their returns with, provides a different perspective. In our view, standout trusts on a risk-adjusted basis include RCP and CLDN, which have achieved strong returns with significantly lower volatility than world equities, a low R2 and a much lower max drawdown. Both trusts publish NAVs only monthly and have a reasonable proportion of private investments, which means that volatility and drawdown statistics are perhaps less comparable. Nevertheless, both have demonstrated a lower beta, and as a result have respectable Treynor ratios.
We have removed Majedie Investments Ord (LSE:MAJE) statistics from the table below, owing to the change in strategy in early 2023 making past performance statistics misleading. Under new manager Marylebone Partners, MAJE now seeks to offer a liquid endowment-like investment solution, and as discussed in our recently published note, we look forward to seeing the track record develop. The managers’ focus on investing in a differentiated portfolio of equities to deliver inflation-beating returns over the long term reflects a commitment to provide strong absolute returns rather than focussing on relative returns against a specific benchmark . Elsewhere, the three constituents with 100% of their investments represented by other investment trusts (MIGO and the two CT Global Managed Portfolio share classes) have betas of 1, illustrating they are effectively 100% invested in quoted equities, despite the underlying investments being very different. All three have likely suffered over the five years from discounts widening, leading to underwhelming risk-adjusted returns. Those who anticipate a turn in sentiment towards trusts, may see the current juncture as being close to the bottom, and should discounts across the sector narrow we imagine these trusts will start to deliver attractive risk-adjusted returns once again.
RETURN-SEEKING DIVERSIFIERS: RISK STATISTICS (FIVE YEARS TO END APRIL 2024)
| RETURN (% PA) | BETA | R2 | SHARPE RATIO (PA) | TREYNOR RATIO (PA) | MAX DRAWDOWN (%) | |
| Caledonia | 10.7 | 0.5 | 8.46 | 0.6 | 16.39 | -14.0 |
| Third Point Investors | 6.7 | 0.6 | 0.05 | 0.4 | 7.38 | -38.1 |
| RIT Capital Partners | 7.5 | 0.7 | 7.18 | 0.4 | 6.39 | -14.1 |
| Hansa | 6.9 | 0.9 | 30.12 | 0.3 | 4.10 | -24.0 |
| MIGO Opportunities | 5.7 | 1.0 | 34.87 | 0.2 | 2.77 | -34.0 |
| Global Opportunities | 4.7 | 0.5 | 37.67 | 0.2 | 3.07 | -23.2 |
| New Star Investment Trust | 4.6 | 0.8 | 7.51 | 0.1 | 1.96 | -15.1 |
| CT Global Managed Portfolio Growth | 3.8 | 1.0 | 48.84 | 0.1 | 0.75 | -33.5 |
| CT Global Managed Portfolio Income | 2.3 | 1.0 | 45.00 | 0.0 | -0.73 | -40.3 |
| Vanguard Life Strategy 60% Equity / 40% bond | 4.7 | 0.8 | 79.05 | 0.1 | 1.97 | -17.8 |
| MSCI ACWI ETF | 9.4 | 1.0 | 100.00 | 0.6 | 7.24 | -33.7 |
Source: Morningstar. Past performance is not a reliable indicator of future returns.
Defensive Diversifiers
The other subgroup of trusts we define in the Flexible sector seek to keep NAV volatility low. In most cases, they tend to have a relatively low equity exposure, and diversify across different or negatively correlated asset classes. We call this group the ‘defensive diversifiers’. As the table below shows, these trusts have an average exposure to quoted equities of just 15%. By and large, this peer group has no exposure to private equity, but a significant portion of these portfolios is invested in inflation linked bonds, real assets, cash or other ‘alternatives’.
There are several very different approaches in this subgroup. Capital Gearing Ord (LSE:CGT),Personal Assets Ord (LSE:PNL)andRuffer Investment Company Ord (LSE:RICA)all have significant exposure to index-linked government bonds, and relatively low equity exposure. Schroder BSC Social Impact Trust Ord (LSE:SBSI) is invested in a range of innovative alternative assets, designed to deliver a financial return, but at the same time deliver a positive societal benefit. BH Macro GBP Ord (LSE:BHMG) isn’t an official constituent of the Flexible sector, but we believe it fits very broadly with the returns that others in the peer group aim to deliver. Tetragon Financial Ord USD (LSE:TFG) is neither fish nor fowl, being largely invested in the equity of management companies running alternatives funds as well as a range of alternative strategies. Its historic return statistics suggests it fits better into this group, rather than the return-seeking diversifiers. As a subgroup, aside from TFG, discounts to NAV are significantly narrower than the return-seeking diversifier group.
DEFENSIVE DIVERSIFIERS: PORTFOLIO COMPOSITION & DISCOUNT
| GROUP / INVESTMENT | % QUOTED EQUITY | % PRIVATE EQUITY | % NON-EQUITY / ALTERNATIVE / REAL ASSETS ETC | DISCOUNT (CURRENT) |
| BH Macro | 0 | 0 | 100 | -12 |
| Capital Gearing | 30 | 0 | 70 | -2 |
| JPMorgan Global Core Real Assets | 16 | 0 | 84 | -14 |
| Personal Assets | 28 | 0 | 72 | -1 |
| Ruffer Investment Company | 17 | 0 | 83 | -5 |
| Schroder BSC Social Impact Trust | 8 | 0 | 92 | -17 |
| Tetragon Financial | 6 | 62 | 32 | -68 |
| Average | 15 | 9 | 76 | -17 |
Source: Kepler Partners, Morningstar. Past performance is not a reliable indicator of future returns.
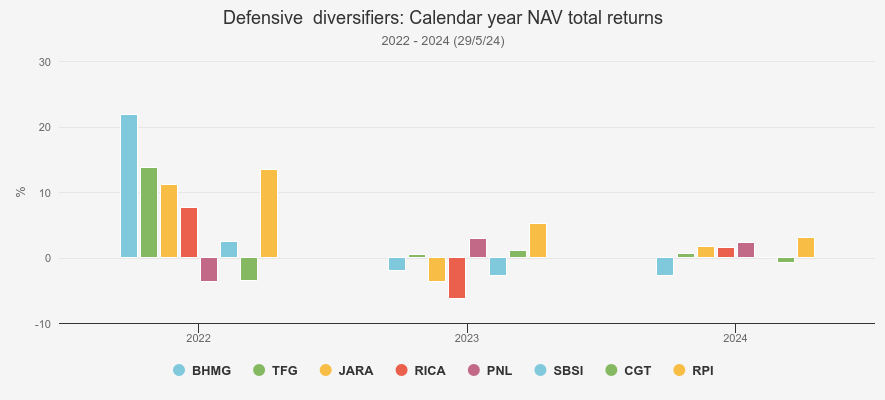
As with the other subgroup, 2022 performance might be seen as a defining period for the defensive diversifiers. As a benchmark, UK inflation as measured by RPI put up quite a high hurdle during the year. However, as portfolio diversifiers, in the context of a -7.9% return for the MSCI ACWI ETF, delivering a positive performance during the year can be seen as valuable from a portfolio context. BHMG delivered a knock-out performance during the year, benefitting from the significant rise in yields and rise in volatility. JPMorgan Global Core Real Assets Ord (LSE:JARA) is in a unique position to provide exposure to real estate, infrastructure, and transportation assets on a global basis through the vast scale of its manager. The trust offers an attractive dividend yield of 5.4% from a portfolio of core assets, which should be more resilient to the economic cycle and to inflation over time.
RICA’s managers had long been talking up the risks from a significant rise in inflation, as had the managers of PNL and CGT, and these trusts all had portfolios potentially exposed to benefit from a rise in inflation. As it was, whilst inflation jumped, the impact of interest rates rising in tandem meant that long duration index-linked bonds did not benefit. RICA was the only one of these three trusts to deliver a positive return, thanks in large part to the hedges employed by its managers to reduce the bond portfolio duration. As a wider group, performance over 2023 and 2024 to date has been relatively lacklustre from the defensive diversifiers. In large part we attribute this to interest rates remaining elevated. As rates fall, we imagine this will be a tailwind to many of the strategies in this subgroup.
RECENT NAV RETURNS
Source: Morningstar. Past performance is not a reliable indicator of future returns
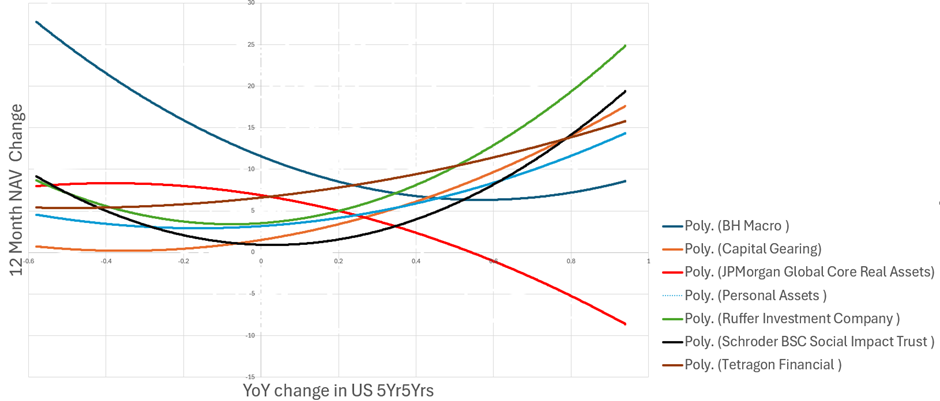
Comparing these trusts’ cumulative performance relative to a benchmark (as we do with the other subgroup above) is not in our view very illustrative. Several trusts in this subgroup aim to position their portfolios without any particular directional bias. At the very least, they are aiming to deliver a ‘heads I win, tails I don’t lose’ type return pattern, and ideally better than this, which is poorly expressed in a traditional five year return chart. RICA exemplifies this, in that it is managed with an absolute return mindset that seeks to balance return-seeking buckets designed to be of benefit in different environments. BHMG on the other hand has a number of traders underpinning it, with no house view on what the future might hold. The team are intensively risk managed, but may take differing or offsetting views at any one time. The result is that BHMG offers a convex payoff profile (see below).
Many of the managers of the trusts in the defensive diversifiers group have long been warning of a sustained rise in inflation. As such, we have graphed the subgroup’s one-year rolling returns correlated with that of changes in US inflation expectations (using 5-year, 5-year forward prices). The graph below shows the convexity demonstrated over the last five years with regards to changes in the market’s inflation expectations. Most of these trusts demonstrate strong convexity, with BHMG showing strongly positive returns in both falling and rising inflation environments. RICA too, and perhaps surprisingly SBSI also showing well. JARA is the only trust that shows a concave profile, reflecting the fact it owns a portfolio of real assets, which are sensitive to interest rates, and through this to inflation. We would note that if inflation is vanquished, its real assets should have an element of a tailwind from interest rates falling. In a scenario where inflation remains sticky, the core infrastructure portfolio should provide some resilience.
INFLATION SENSITIVITES (FIVE YEARS TO END APRIL 2024)
Source: Morningstar, Kepler Partners. Past performance is not a reliable indicator of future returns
The table below illustrates the various risk measures as applied to the defensive diversifiers. As we might expect beta and R2 across the group is low, aside from PNL and CGT, which both have a beta of 0.6 over the last five years. The low returns across most of these trusts over the past two years have undoubtedly dented Sharpe ratios, which are only marginally positive. The standout performer in terms of risk and return is BHMG, delivering equity-beating returns with significantly lower-risk characteristics. These trusts have done a good job at protecting and growing capital, having all largely beaten a 60/40 equity and bond ETF in total return terms, with lower beta and volatility.
That said, RICA is at the higher end of volatility for the subgroup, and the max drawdown of 10.6% is at the high end too. 2023 was RICA’s worst ever in performance terms, with a negative 6.2% return. In the words of the manager, the trust was broadly set up for “an uncomfortable ride”, and the costs of protection exceeded the offsetting positives in the portfolio during the year. It is encouraging that 2024 has so far gone better for the trust. One might argue that in a higher rates / higher inflation environment, these trusts should deliver higher absolute returns, and their portfolios would suggest that they are set up for this eventuality.
DEFENSIVE DIVERSIFIERS: RISK STATISTICS (FIVE YEARS TO END APRIL 2024)
| RETURN (% PA) | BETA | R2 | SHARPE RATIO (PA) | TREYNOR RATIO (PA) | MAX DRAWDOWN (%) | STD DEV (% PA) | |
| BH Macro | 10.3 | 0.1 | 8.1 | 0.7 | 69.0 | -7.8 | 9.4 |
| Capital Gearing | 4.3 | 0.6 | 29.0 | 0.1 | 2.2 | -10.1 | 6.9 |
| Personal Assets | 5.2 | 0.6 | 55.0 | 0.2 | 3.9 | -9.7 | 8.8 |
| Ruffer Investment Company | 6.0 | 0.5 | 15.7 | 0.2 | 6.3 | -10.6 | 11.8 |
| Tetragon Financial | 7.5 | 0.2 | 0.0 | 0.6 | 33.6 | -11.6 | 14.3 |
| Vanguard Life Strategy 60% Equity / 40% Bonds | 4.7 | 0.8 | 79.1 | 0.1 | 2.0 | -17.8 | 11.5 |
| MSCI ACWI | 9.4 | 1.0 | 100 | 0.6 | 7.2 | -33.7 | 20.4 |
Source: Morningstar. Past performance is not a reliable indicator of future returns.
Conclusion
Splitting the Flexible sector in two qualitatively, we believe our analysis of the return and risk statistics backs up which group each trust properly sits in. Of course, these are all very different strategies, and in putting trusts in one of two boxes, it is inevitable that many of the nuances of each strategy will get lost. That said, we think that going forward it will be helpful to view the performance and risk characteristics of each of these trusts in the context of these new subgroups. At the very least, this may help to identify where trusts are delivering ahead of or behind expectations.
If we were to gaze into the crystal ball, the big opportunity for some of the risk-seeking diversifiers is a significant uptick in private equity realisation activity. We suspect that there is plenty of latent value in these portfolios, which hitherto hasn’t been demonstrated in NAV returns. Trusts such as RCP, trading on a mid-twenties discount, may be a beneficiary of this in NAV terms and in sentiment turning to narrow the discount.
In terms of the defensive diversifiers, interest rates falling could see these trusts starting to deliver higher nominal total returns, given many of them have long duration (inflation linked) bond exposure. Their lack of correlation to equity markets is part of the reason they fit in a portfolio, and so a higher nominal return could help tip the balance and attract buyers. That said, the discounts across this group are not so startling, so there is perhaps less of a value opportunity here. At their core, many of these trusts might be seen as a hedge against central banks not being able to engineer a ‘soft landing’. Markets appear to be pricing in an incredible escape from the inflationary environment of the past few years. As a result, a typical equity and bond portfolio could be dangerously exposed if this outcome doesn’t emerge, and these trusts could provide valuable protection in this scenario.
Kepler Partners is a third-party supplier and not part of interactive investor. Neither Kepler Partners or interactive investor will be responsible for any losses that may be incurred as a result of a trading idea.
These articles are provided for information purposes only. Occasionally, an opinion about whether to buy or sell a specific investment may be provided by third parties. The content is not intended to be a personal recommendation to buy or sell any financial instrument or product, or to adopt any investment strategy as it is not provided based on an assessment of your investing knowledge and experience, your financial situation or your investment objectives. The value of your investments, and the income derived from them, may go down as well as up. You may not get back all the money that you invest. The investments referred to in this article may not be suitable for all investors, and if in doubt, an investor should seek advice from a qualified investment adviser.
Full performance can be found on the company or index summary page on the interactive investor website. Simply click on the company's or index name highlighted in the article.
Important Information
Kepler Partners is not authorised to make recommendations to Retail Clients. This report is based on factual information only, and is solely for information purposes only and any views contained in it must not be construed as investment or tax advice or a recommendation to buy, sell or take any action in relation to any investment.
This report has been issued by Kepler Partners LLP solely for information purposes only and the views contained in it must not be construed as investment or tax advice or a recommendation to buy, sell or take any action in relation to any investment. If you are unclear about any of the information on this website or its suitability for you, please contact your financial or tax adviser, or an independent financial or tax adviser before making any investment or financial decisions.
The information provided on this website is not intended for distribution to, or use by, any person or entity in any jurisdiction or country where such distribution or use would be contrary to law or regulation or which would subject Kepler Partners LLP to any registration requirement within such jurisdiction or country. Persons who access this information are required to inform themselves and to comply with any such restrictions. In particular, this website is exclusively for non-US Persons. The information in this website is not for distribution to and does not constitute an offer to sell or the solicitation of any offer to buy any securities in the United States of America to or for the benefit of US Persons.
This is a marketing document, should be considered non-independent research and is subject to the rules in COBS 12.3 relating to such research. It has not been prepared in accordance with legal requirements designed to promote the independence of investment research.
No representation or warranty, express or implied, is given by any person as to the accuracy or completeness of the information and no responsibility or liability is accepted for the accuracy or sufficiency of any of the information, for any errors, omissions or misstatements, negligent or otherwise. Any views and opinions, whilst given in good faith, are subject to change without notice.
This is not an official confirmation of terms and is not to be taken as advice to take any action in relation to any investment mentioned herein. Any prices or quotations contained herein are indicative only.
Kepler Partners LLP (including its partners, employees and representatives) or a connected person may have positions in or options on the securities detailed in this report, and may buy, sell or offer to purchase or sell such securities from time to time, but will at all times be subject to restrictions imposed by the firm's internal rules. A copy of the firm's conflict of interest policy is available on request.
Past performance is not necessarily a guide to the future. The value of investments can fall as well as rise and you may get back less than you invested when you decide to sell your investments. It is strongly recommended that Independent financial advice should be taken before entering into any financial transaction.
PLEASE SEE ALSO OUR TERMS AND CONDITIONS
Kepler Partners LLP is a limited liability partnership registered in England and Wales at 9/10 Savile Row, London W1S 3PF with registered number OC334771.
Kepler Partners LLP is authorised and regulated by the Financial Conduct Authority.