Share Sleuth: why this company has lost its place in the portfolio
4th May 2022 09:33
by Richard Beddard from interactive investor
Richard Beddard has moved to cut losses in a company that he has lost confidence in.

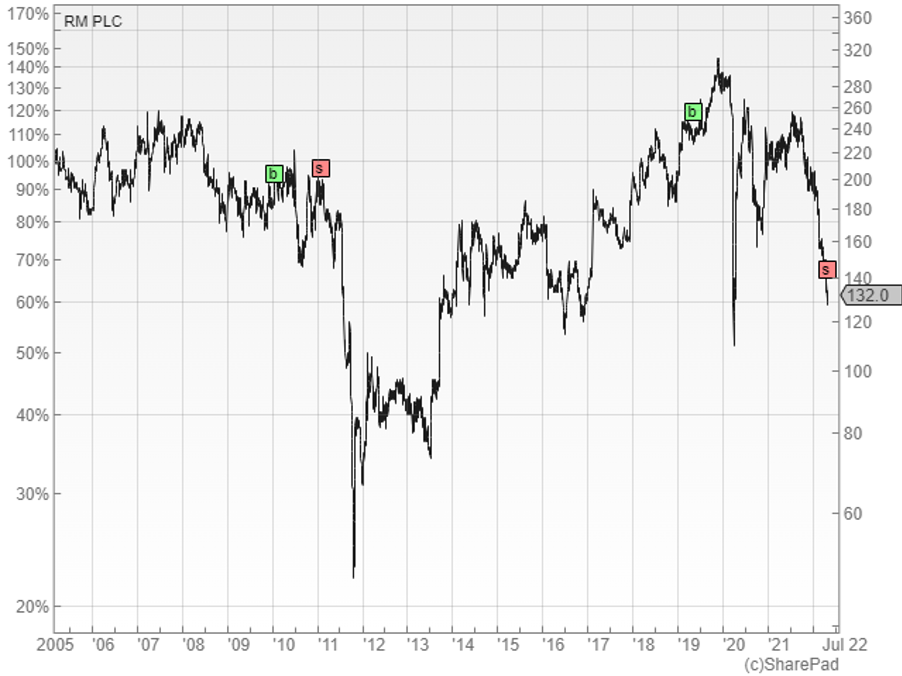
If you read my annual appraisal of RM (LSE:RM.)earlier this month, it will probably not be a surprise that the share has left the portfolio.
RM is a supplier of educational materials, IT, and testing and marking software.
I can see clearly now
I approached this year’s appraisal with a determination to be more clinical than in previous years.
Ever since I spoke to students in March about systematic biases, the way we rush to judgement and pull the wool over our own eyes, I have been more aware of the biases I succumb to myself.
By scoring shares according to their profitability, risks, strategy, fairness and price, I hope to consider each facet of the investment independently and come to an unbiased conclusion.
But sometimes my enthusiasm for a share can infect the analysis.
When I forced myself to be rigorous, I gave RM a score of only 5 out of 9. It scored one out of two in each of the first four categories, which determine the quality of the share, and one out of one for price.
In other words, the shares look cheap, but I cannot determine the quality.
- Share Sleuth: new addition takes number of holdings up to 30
- Share Sleuth: my first trades of 2022 lead to a new holding
There is a good reason for that. RM is a turnaround, and it has a strategy typical of many turnarounds.
The company’s relatively new chief executive is trying to right inefficiencies that are making RM uncompetitive.
Specifically, the multiple warehouses from which it supplies educational materials to primary schools are being rationalised into one new automated warehouse. Also, RM is migrating 50 IT systems into four.
These actions may well result in a recovery for RM’s profits and share price, but they come at a cost in the short-term that means the company is more indebted than I would like.
To invest in RM, I must believe it will do well at least over the next 10 years, better than all the alternative shares I can include in the Share Sleuth portfolio.
RM’s inefficiencies, the multiple warehouses and IT systems, are the result of its convoluted history. As the business has been stressed by technological change, and vacillations in government funding, it has diversified through acquisition, each business bringing its own infrastructure to the mothership.
Repairing these inefficiencies is just the start. The company is already thinking about how it can be more than the sum of its parts, although it does not really say how in its annual report.
I can see no obvious reason these parts should be together. RM Resources sells classroom resources to primary schools. RM Technology sells IT, its biggest market is secondary schools. RM Assessment sells testing and marking software as a service to academic and professional examination bodies.
The other legacy of RM’s acquisitions is, of course, debt and a large pension obligation.
Because I cannot see what makes RM special and its finances are relatively weak, I cannot invest with confidence for the long term.
Confession
If I am seeing this clearly now, I need to confess the reason I think I did not see it before - I was blinded by affection for RM.
We have been here before. I added the company to the Share Sleuth portfolio in 2010 and removed it almost exactly a year later when I discovered errors in my calculations.
Past performance is not a guide to future performance.
RM was more indebted and more expensive than I thought, and I felt I had rushed the analysis because I had already decided I wanted the company in the portfolio.
In January 2011, I wrote here on interactive investor: “As a former teacher, who used to work for an educational publisher, whose children use RM Maths, who knows many, many teachers, and has a lifelong interest in education, I let the story, the undoubted benefits of IT in education, take precedence over the analysis.”
I might have added that I wrote my Postgraduate Certificate in Education (PGCE) dissertation on “A computer for every child”.
The problem was though, I wrote that dissertation in 1990 and taught my last lesson in a UK school in 1992.
As I admitted to one of my editors when I was considering investing in RM again in 2018, fond memories of a brand from decades before are not a good basis for investment.
By voicing this fear, I gave myself permission to make the same mistake all over again and I added the shares to the Share Sleuth portfolio at a price of 236p in May 2019.
On Friday 22 April, I removed Share Sleuth’s entire holding of 1,275 shares at a price of 131p, the actual price quoted by interactive investor.
The sale raised £1,611, a return of -42.5% after adding dividends and subtracting trading fees and stamp duty (from the original purchase).
Share Sleuth performance
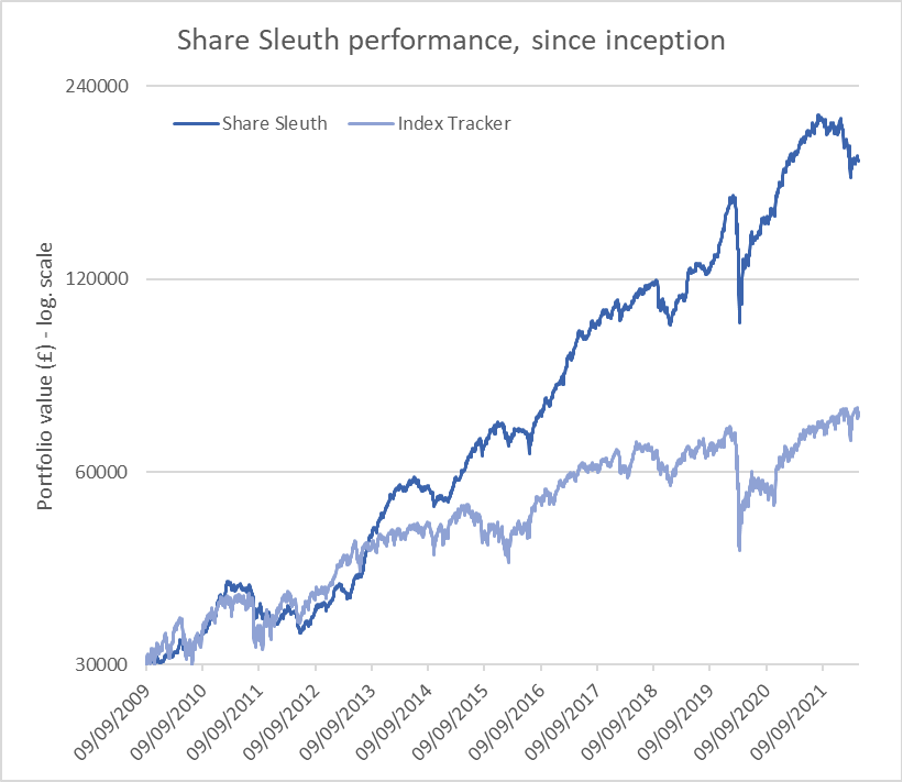
At the close on Friday 29 April, the Share Sleuth portfolio was worth 184,447, 515% more than the notional £30,000 invested in the portfolio’s first year, from September 2009.
Past performance is not a guide to future performance.
The portfolio’s cash balance is £2,599, augmented by the removal of RM and a bonanza of dividends from PZ Cussons (LSE:PZC), Quartix (LSE:QTX), Renishaw (LSE:RSW), RM, Trifast (LSE:TRI), Tristel (LSE:TSTL) and XP Power (LSE:XPP).
There is not enough cash to fund new additions at the minimum trade size of 2.5% of the portfolio’s total value (about £4,650).
Share Sleuth | Cost (£) | Value (£) | Return (%) | ||
Cash | 2,599 | ||||
Shares | 181,847 | ||||
Since 9 September 2009 | 30,000 | 184,447 | 515 | ||
Companies | Shares | Cost (£) | Value (£) | Return (%) | |
ANP | Anpario | 1,124 | 4,057 | 5,901 | 45 |
BMY | Bloomsbury | 2,676 | 8,509 | 10,731 | 26 |
BNZL | Bunzl | 201 | 4,714 | 6,237 | 32 |
BOWL | Hollywood Bowl | 1,615 | 3,628 | 4,167 | 15 |
CHH | Churchill China | 341 | 3,751 | 5,030 | 34 |
CHRT | Cohort | 1,600 | 3,747 | 8,704 | 132 |
D4T4 | D4t4 | 1,528 | 3,509 | 4,393 | 25 |
DWHT | Dewhurst | 532 | 1,754 | 7,368 | 320 |
FOUR | 4Imprint | 190 | 3,688 | 5,187 | 41 |
GAW | Games Workshop | 76 | 218 | 5,632 | 2,484 |
GDWN | Goodwin | 266 | 6,646 | 8,911 | 34 |
HWDN | Howden Joinery | 1,368 | 8,223 | 10,416 | 27 |
JDG | Judges Scientific | 159 | 3,825 | 10,653 | 179 |
JET2 | Jet2 | 456 | 250 | 5,657 | 2,163 |
LTHM | James Latham | 400 | 5,238 | 4,960 | -5 |
NXT | Next | 106 | 6,071 | 6,388 | 5 |
PRV | Porvair | 906 | 4,999 | 5,345 | 7 |
PZC | PZ Cussons | 1,870 | 3,878 | 3,834 | -1 |
QTX | Quartix | 1,085 | 2,798 | 3,743 | 34 |
RSW | Renishaw | 92 | 1,739 | 3,914 | 125 |
RWS | RWS | 1,000 | 4,696 | 4,400 | -6 |
SOLI | Solid State | 986 | 2,847 | 11,043 | 288 |
TET | Treatt | 763 | 1,082 | 8,073 | 646 |
TFW | Thorpe (F W) | 2,000 | 2,207 | 9,350 | 324 |
TRI | Trifast | 2,261 | 3,357 | 2,442 | -27 |
TSTL | Tristel | 750 | 268 | 2,325 | 767 |
TUNE | Focusrite | 400 | 4,530 | 3,980 | -12 |
VCT | Victrex | 292 | 6,432 | 5,338 | -17 |
XPP | XP Power | 240 | 4,589 | 7,728 | 68 |
Table notes:
No new additions this month. Liquidated holding in RM
Costs include £10 broker fee, and 0.5% stamp duty where appropriate
Cash earns no interest
Dividends and sale proceeds are credited to the cash balance
£30,000 invested on 9 September 2009 would be worth £184,447 today
£30,000 invested in FTSE All-Share index tracker accumulation units would be worth £74,385 today
Objective: to beat the index tracker handsomely over five-year periods
Source: SharePad, 29 April 2022.
Richard Beddard is a freelance contributor and not a direct employee of interactive investor.
Richard owns all the shares in the Share Sleuth portfolio
For more information about Richard’s scoring and ranking system (the Decision Engine) and the Share Sleuth portfolio powered by this research, please read the FAQ.
Contact Richard Beddard by email: richard@beddard.net or on Twitter: @RichardBeddard
These articles are provided for information purposes only. Occasionally, an opinion about whether to buy or sell a specific investment may be provided by third parties. The content is not intended to be a personal recommendation to buy or sell any financial instrument or product, or to adopt any investment strategy as it is not provided based on an assessment of your investing knowledge and experience, your financial situation or your investment objectives. The value of your investments, and the income derived from them, may go down as well as up. You may not get back all the money that you invest. The investments referred to in this article may not be suitable for all investors, and if in doubt, an investor should seek advice from a qualified investment adviser.
Full performance can be found on the company or index summary page on the interactive investor website. Simply click on the company's or index name highlighted in the article.
Disclosure
We use a combination of fundamental and technical analysis in forming our view as to the valuation and prospects of an investment. Where relevant we have set out those particular matters we think are important in the above article, but further detail can be found here.
Please note that our article on this investment should not be considered to be a regular publication.
Details of all recommendations issued by ii during the previous 12-month period can be found here.
ii adheres to a strict code of conduct. Contributors may hold shares or have other interests in companies included in these portfolios, which could create a conflict of interests. Contributors intending to write about any financial instruments in which they have an interest are required to disclose such interest to ii and in the article itself. ii will at all times consider whether such interest impairs the objectivity of the recommendation.
In addition, individuals involved in the production of investment articles are subject to a personal account dealing restriction, which prevents them from placing a transaction in the specified instrument(s) for a period before and for five working days after such publication. This is to avoid personal interests conflicting with the interests of the recipients of those investment articles.