Shifting gears: trusts’ borrowing methods explained
A Kepler analyst examines the different gearing options of investment trusts, and how they influence behaviour, and risk.
13th June 2025 13:57

This content is provided by Kepler Trust Intelligence, an investment trust focused website for private and professional investors. Kepler Trust Intelligence is a third-party supplier and not part of interactive investor. It is provided for information only and does not constitute a personal recommendation.
Material produced by Kepler Trust Intelligence should be considered a marketing communication, and is not independent research.
“There are many ways to skin a cat”, as the saying goes, which is a strange thing to say when you think about it: are there really? Researching the origin of the phrase, it has been traced as far back as John Russell Bartlett’s 1848 Dictionary of Americanisms, which relates it to the saying “there are more ways to kill a cat than choking it with cream”. That version at least is certainly true.
- Invest with ii: Invest in Investment Trusts | Top UK Shares| Interactive investor Offers
The team’s AI assistant suggests that there would have been different techniques used for skinning animals on the US frontier, so it may simply show modern, townie ignorance to question the version we currently use. In any case, it seems like we can’t blame the Americans for the phrase, as it can be traced back even further, appearing to derive from a 17th-century British proverb: “There are more ways to kill a dog than hanging.”
The phrase must have stuck in our language so long after the literal interpretation made any sense because of the vivid imagery. It is certainly much more memorable than the phrase “there are many ways for an investment trust to take on debt, but they have important differences.”
Unfortunately for those readers hoping for a primer in bush-tucker techniques or the history of executing animals (the French once put weevils on trial for damaging vineyards, although the verdict and sentence are unknown), the subject matter of this note will indeed be the gearing methods of investment companies.
That then, is the end of the entertainment for today, but hopefully, readers will stick with us for a discussion that might be a little more useful. For we think there are a number of important considerations when it comes to investing in geared vehicles that can easily be overlooked.
There are many ways to gear an investment trust
Investment trusts are highly flexible vehicles with a number of advantages over open-ended funds. One is their flexibility when it comes to gearing. We have been pulled up by readers before for some loose language on this so let’s be precise: it isn’t that open-ended funds can’t gear at all, but that the methods available to them are more limited.
UCITS rules mean that open-ended funds can take out bank debt, but only if it is to be used on a short-term basis, essentially for liquidity management. And this debt is restricted to 10% of NAV. On the other hand, they can use derivatives to gear up, with a high ceiling of 100% of additional NAV exposure. However, UCITS rules do specify that it must be possible to net off or realise these positions at short notice, which in practice should restrict funds to liquid contracts that are traded on exchange rather than bespoke over-the-counter contracts.
The reason this specification is important is the open-ended fund manager has to be able to deal with outflows. The exposure of geared derivative positions as a size of the fund will grow if the fund shrinks unless the position is altered. Similarly, insisting bank debt is short term and readily repayable, prevents the debt from growing as a percentage of NAV when the fund sees outflows.
Closed-ended funds like investment trusts don’t have this problem. They are fixed pools of capital (or at least can be until boards decide they want to grow or shrink their assets). Outflows aren’t a consideration, and the relevant restrictions are set under UK listing rules rather than UCITS regulations. Trusts can take out long-term bank debt or issue debentures or loan notes into the market, or, indeed, use more esoteric funding mechanisms like zero dividend preference shares (ZDPs).
They also have more freedom when it comes to managing any short-term debt or derivative positions by virtue of the structure rather than regulations. Just as managers can make investment decisions without worrying whether they could sell if they saw heavy outflows or what the portfolio would look like if they had to sell their most liquid investments first, so too can the board and manager implement a gearing strategy and take out debt without worrying about the impact of rapid withdrawals on their position.
There are more ways to gear a trust than raising the beta
The upshot is that investment trusts have more options than open-ended funds when it comes to taking on gearing and these options can produce very different return profiles. In fact, we think that understanding the method of taking on gearing is crucial to understanding the potential behaviour of a trust.
To investigate this, we looked at the performance of trusts which invest in the same markets but take very different approaches to gearing. We think intuitively investors are likely to assume that a trust with a high level of gearing is likely to have a high beta, but the data suggests it is more complicated than that.
Consider Fidelity China Special Ord (LSE:FCSS), for example. On their range of investment trusts, Fidelity uses derivatives to take most of their gearing exposure, specifically contracts for difference (CFDs).
CFDs allow investors to take a position in a stock or index while putting down a relatively small margin. While the Fidelity range all use them, and all use them to take short positions as well as longs, there are differences in the approach to gearing across the range, depending on the manager’s strategy and the market.
Dale Nicholls, manager of FCSS, is quite aggressive when it comes to using gearing, the net position averaging circa 20% over the past five years. However, the trust’s five-year beta is below one, at 0.94 to be precise.
For readers who need a refresher, beta is a measure of market sensitivity, and a beta below one implies that should the market fall by 1% the investment should be expected to fall by less than this, before accounting for any expected alpha. (It’s worth noting that these numbers are backwards-looking, so the usual warnings against assuming past performance patterns will be repeated apply.) This means that for FCSS to have a beta below one is highly surprising.
Why this might be emerges if we look at the beta on a more granular basis. We looked at the one-year rolling beta, calculated each month over the past five years. The figures for FCSS show far more variability, with the standard deviation of the beta being significantly higher than the two other specialist China trusts.
BETA OVER FIVE YEARS: China sector
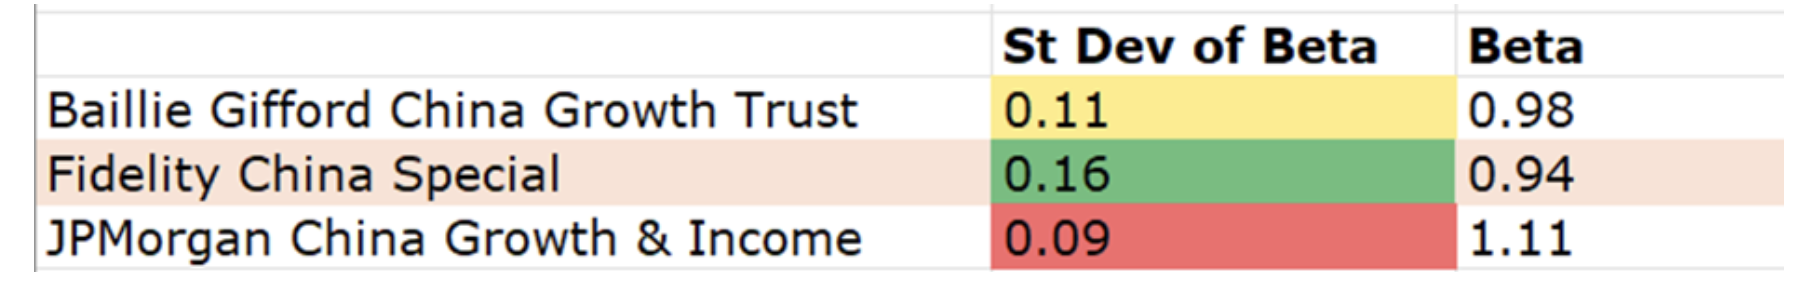
Source: Morningstar, Kepler calculations. Past performance is not a reliable indicator of future results
Clearly, this is indicative of a tactical approach to gearing rather than a structural approach. But we think there is more going on too. Because Dale takes out CFDs on individual stocks, it is possible for him to do so without necessarily boosting the trust’s beta. If a manager gears up positions in low beta stocks, the resulting beta will be lower than if he or she gears up high beta stocks, but the effect on the headline gearing number will be the same. Long-term bank debt is typically invested pro-rata across the portfolio, with the manager effectively just playing with a larger pool of capital, but this approach that Dale takes is very different and the net effect will vary depending on the particular stocks he is gearing up.
Another factor is the effect of any short positions. It is interesting to note that FCSS also had structural bank debt throughout most of the period under review, although the debt has expired and not been renewed. We think this may bias down the beta in future but also potentially increase the variability.
This isn’t just a matter of the method of taking out gearing. Long-term bank debt or debentures are perhaps more likely to be invested across the whole portfolio as described above, but the same effect could be achieved by taking out futures or options and rolling them. It is true though, that there would be the roll yield to consider, which would mean that there would be a cost to any investor when contracts expired and were replaced. In our experience, it is far more common to see a manager take out and roll a short position in an index than to take out gearing this way, and index futures or options are usually used tactically in the investment trust sector.
It is also possible for CFDs to be used with a more long-term stable approach though, and indeed we have seen a number of trusts switch to using CFDs over bank debt in recent years. In some cases, it may be due to the higher yields that would need to be digested in order to take out fresh debt post-pandemic, and so CFDs could be a bridging solution until yields come down. It’s worth noting though, that CFDs are not cost-free, and holding positions overnight will typically involve a funding cost linked to short-term interest rates; they are, however, easily closeable positions and not the long-term commitments of bank debt. High yields still aren’t much of a problem in Japan, however, whereCC Japan Income & Growth Ord (LSE:CCJI)uses CFDs to implement a structural approach to gearing, maintaining leverage within a fairly consistent level of 20%, with variations largely due to market movements.
NET GEARING
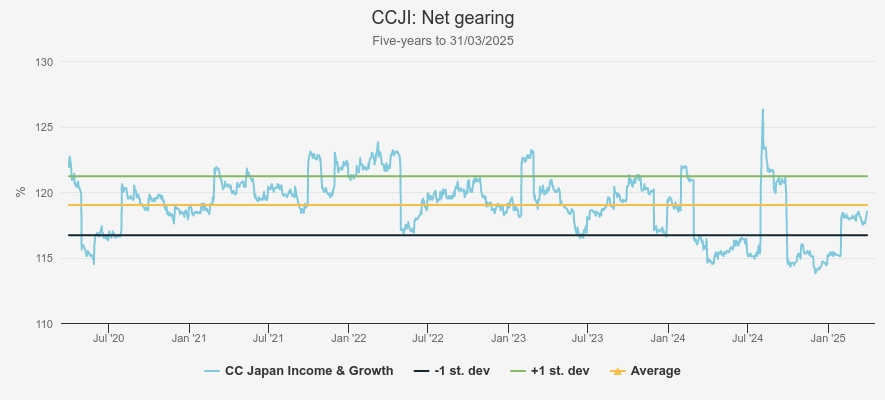
Source: Morningstar
Despite this high level of gearing, CCJI’s beta is almost the very lowest in the AIC Japan sector at 1.04, as the table below shows. Meanwhile, Fidelity Japan Trust Ord (LSE:FJV), which has averaged a gearing position only marginally higher than CCJI at 23%, has a beta of 1.26 over the past five years. FJV, like FCSS, can hold private companies, so one could consider the beta to the equity market as lower than this. However, while private companies lag the market, they should still move in line over the longer term.
Meanwhile, JPMorgan Japanese Ord (LSE:JFJ)’sbeta and the variability of its beta have both been in line with FJV’s despite the fact that for the vast majority of the period in question, the gearing was taken out through a mixture of long-term and short-term bank debt. We think this highlights the importance of investment style to the beta experienced: while CCJI invests in high-quality companies with an eye for valuation and yield, FJV and JFJ are both very growth-oriented, with significant allocations to small caps. Style is therefore another important factor to bear in mind when considering what impact gearing is likely to have on an investment: it is crucial to understand what type of equities the gearing is invested in.
BETA OVER FIVE YEARS: Japan sector
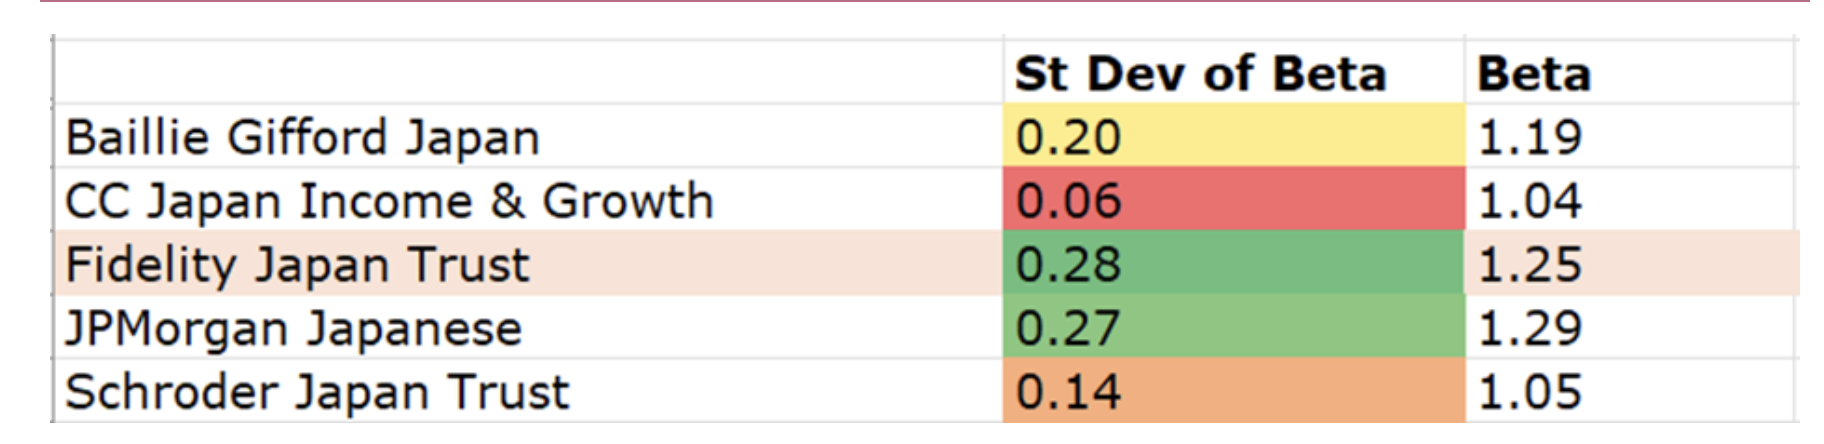
Source: Morningstar. Past performance is not a reliable indicator of future results
Interestingly, in the European sector, Fidelity European Trust Ord (LSE:FEV) takes an approach to gearing that is more in tune with that of CCJI than its stablemate. Since 2020, the policy has been to keep a stable level of gearing around 13% or so rather than trying to time the market. The beta experienced over this time is exactly one, rather than the 1.13 that might be expected, with an extremely low standard deviation. CCJI’s beta and the standard deviation of that beta are almost identical to that of JJPMorgan European Growth & Income Ord (LSE:JEGI)which only uses long-term fixed rate borrowings, via a €50m private placement note that matures in 2035 and which is currently worth c. 5% of NAV. FEV has a more quality and value-tilted portfolio and JEGI has a more growth-tilted approach, although neither has strong style biases. We think this is an interesting comparison: a greater tilt to growth seems to have been equivalent to taking on the same market risk as the additional gearing of c. 8%.
BETA OVER FIVE YEARS: Europe sector
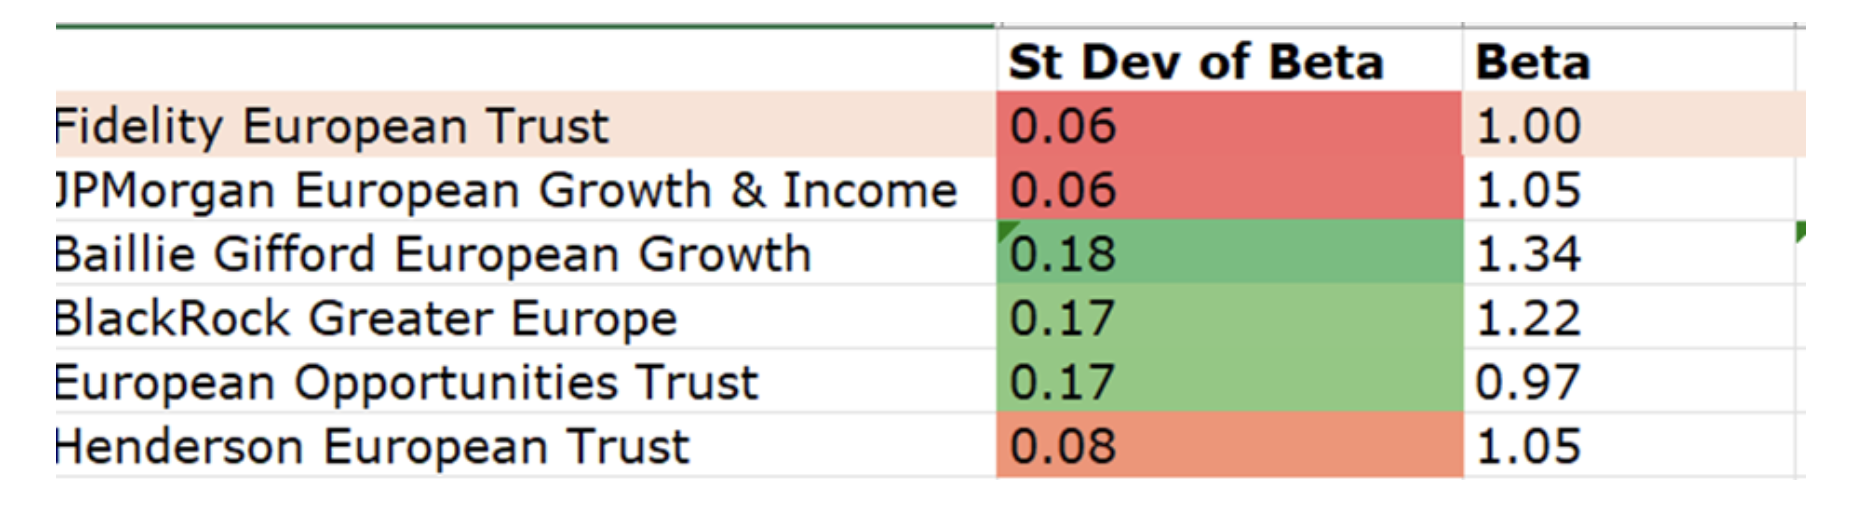
Source: Morningstar. Past performance is not a reliable indicator of future results.
There are two principal ways to gear a trust
Quite a few of the trusts we have looked at so far use CFDs, a method which is also available to open-ended funds. We have seen that they can be used in a number of different ways and to effect different return profiles. However, we do think long-term bank debt, a method trusts can use but not open-ended funds, has some advantages.
CFDs are not cost-free. As highlighted above, short-term interest rates will affect the cost of holding a position via these contracts. The cost of locking in long-term debt is also likely to rise when short-term interest rates are high, although it should incorporate expected rates over its life, and so can be cheaper than borrowing at the overnight rates. But there are other costs associated with CFDs too, for example, there is typically a spread between the buy and sell price of a contract. CFDs can be open-ended, meaning the need to close out and buy again isn’t there, but there is still a price to getting into the position which can change over time. Volatility is one factor which can cause spreads to widen and therefore the cost of taking on a position to rise. While there are spreads in the cash equity market, they should be generally narrower than on CFDs too. This all means that the cost of entering a position in CFDs could be more expensive than simply entering a position with bank debt.
We think that high short-term interest rates are likely pushing managers towards using CFDs at the moment. The rates for long-term debt aren’t currently very attractive in most parts of the developed world while interest rates are expected to come down, meaning the cost of taking out debt should do too. This means it makes sense to wait for rates to decline before trying to lock in cheap financing. Locking in low rates with structural bank debt or debentures could be a material advantage for an investment trust when rates eventually rise once more, as vehicles using CFDs would be paying the higher short-term rate. Edinburgh Investment Ord (LSE:EDIN) is one to have locked in a great rate, with £120 million of debt locked in at an average maturity of 23 years and a cost of just 2.4% per annum. EDIN is a large trust, and this £120 million is 10% of NAV. BGEU’s €60 million in loan notes is an even more meaningful 15% of NAV. BGEU has €30 million maturing in 2036 and €30 million in 2040 on which it pays rates of 1.57% and 1.55% respectively.
BGEU’s example does highlight the potential disadvantage to taking out long-term debt though, or perhaps we should call it a risk to be borne in mind. BGEU’s portfolio sold off heavily in the 2022 financial year, with a 40.4% decline pushing the gearing position from 7% to 16%. Now, gearing up when markets fall is arguably the right way to approach the cycle tactically, so it could be argued this was a desirable effect. But of course, sell-offs and recoveries aren’t predictable, and raising gearing like this increases volatility and exposure to any further market falls too. So, we think this is a risk to be borne in mind with long-term debt, even if we think the effect has been to leave BGEU in an enviable position should we see a sustained recovery in European equities and specifically European growth equities. A trust that had geared through CFDs would be able to adjust the gearing down should it want to, while for BGEU the way to do this would be through increasing cash levels (which the managers have opted not to do).
Conclusion
We think this analysis shows that there is more to consider than simply the level of gearing when looking at the risk profile of a trust. Depending on how gearing is achieved, the risk and return profile can be affected in a very different way. In particular, trusts that gear up single stock positions may do so without boosting the beta as much as might be expected and may be much more variable when it comes to their sensitivity to the market. As well as considering the approach to gearing, the approach to stock selection has to be taken into account as well. Gearing up lower beta stocks won’t have the same effect as gearing up higher beta stocks.
Currently, a number of trusts are shifting to using CFDs to take out gearing. As well as the examples discussed, JPMorgan Asia Growth & Income Ord (LSE:JAGI)has made the shift this year. The flexibility is an advantage, and we think the data shows that their use doesn’t necessarily imply a more tactical use of gearing, which can be harder to employ successfully over the long run. One reason for preferring CFDs at this time may be that managers see the market as more favourable to a stock-picking approach, and they would rather gear up single positions than the market as a whole.
However, we think there is a lot to be said for long-term bank debt when it can be secured at low rates, and with short-term rates currently very high, trusts which have already locked in very low rates have an advantage and should appeal to investors who want to take out a long-term, fire-and-forget geared position.
There is also the danger of reducing the differentiation of the investment trust structure, as open-ended funds can use CFDs too, so investors may be more likely to prefer an open-ended equivalent depending on how they view the opportunities and threats of discounts.
Kepler Partners is a third-party supplier and not part of interactive investor. Neither Kepler Partners or interactive investor will be responsible for any losses that may be incurred as a result of a trading idea.
These articles are provided for information purposes only. Occasionally, an opinion about whether to buy or sell a specific investment may be provided by third parties. The content is not intended to be a personal recommendation to buy or sell any financial instrument or product, or to adopt any investment strategy as it is not provided based on an assessment of your investing knowledge and experience, your financial situation or your investment objectives. The value of your investments, and the income derived from them, may go down as well as up. You may not get back all the money that you invest. The investments referred to in this article may not be suitable for all investors, and if in doubt, an investor should seek advice from a qualified investment adviser.
Full performance can be found on the company or index summary page on the interactive investor website. Simply click on the company's or index name highlighted in the article.
Important Information
Kepler Partners is not authorised to make recommendations to Retail Clients. This report is based on factual information only, and is solely for information purposes only and any views contained in it must not be construed as investment or tax advice or a recommendation to buy, sell or take any action in relation to any investment.
This report has been issued by Kepler Partners LLP solely for information purposes only and the views contained in it must not be construed as investment or tax advice or a recommendation to buy, sell or take any action in relation to any investment. If you are unclear about any of the information on this website or its suitability for you, please contact your financial or tax adviser, or an independent financial or tax adviser before making any investment or financial decisions.
The information provided on this website is not intended for distribution to, or use by, any person or entity in any jurisdiction or country where such distribution or use would be contrary to law or regulation or which would subject Kepler Partners LLP to any registration requirement within such jurisdiction or country. Persons who access this information are required to inform themselves and to comply with any such restrictions. In particular, this website is exclusively for non-US Persons. The information in this website is not for distribution to and does not constitute an offer to sell or the solicitation of any offer to buy any securities in the United States of America to or for the benefit of US Persons.
This is a marketing document, should be considered non-independent research and is subject to the rules in COBS 12.3 relating to such research. It has not been prepared in accordance with legal requirements designed to promote the independence of investment research.
No representation or warranty, express or implied, is given by any person as to the accuracy or completeness of the information and no responsibility or liability is accepted for the accuracy or sufficiency of any of the information, for any errors, omissions or misstatements, negligent or otherwise. Any views and opinions, whilst given in good faith, are subject to change without notice.
This is not an official confirmation of terms and is not to be taken as advice to take any action in relation to any investment mentioned herein. Any prices or quotations contained herein are indicative only.
Kepler Partners LLP (including its partners, employees and representatives) or a connected person may have positions in or options on the securities detailed in this report, and may buy, sell or offer to purchase or sell such securities from time to time, but will at all times be subject to restrictions imposed by the firm's internal rules. A copy of the firm's conflict of interest policy is available on request.
Past performance is not necessarily a guide to the future. The value of investments can fall as well as rise and you may get back less than you invested when you decide to sell your investments. It is strongly recommended that Independent financial advice should be taken before entering into any financial transaction.
PLEASE SEE ALSO OUR TERMS AND CONDITIONS
Kepler Partners LLP is a limited liability partnership registered in England and Wales at 9/10 Savile Row, London W1S 3PF with registered number OC334771.
Kepler Partners LLP is authorised and regulated by the Financial Conduct Authority.